An Integrated Model for Supplier Quality Evaluation
A Thesis
in
The Department
of
Mechanical and Industrial Engineering
Presented in Partial Fulfillment of the Requirements For the Degree of Master of Applied Science at
CONCORDIA UNIVERSITY Montréal, Québec, Canada
March 2012
CONCORDIA UNIVERSITY
School of Graduate Studies
This is to certify that the thesis preparedBy: Aqeel Al Salem
Entitled: An Integrated Model for Supplier Quality Evaluation and submitted in partial fulfillment of the requirements for the degree of
Master of Applied Science (Industrial Engineering)
complies with the regulations of the University and meets the accepted standards with respect to originality and quality.
Signed by the final Examining Committee:
Chair
Dr. Andrea Schiffauerova
External Examiner Dr. Ketra Schmitt
Examiner Dr. Masoumeh Kazemi Zanjani
Supervisor Dr. Anjali Awasthi
Co-Supervisor Dr. Chun Wang
Approved
Chair of Department or Graduate Program Director
Dean of Faculty Date
iii
ABSTRACT
An Integrated Model for Supplier Quality Evaluation
Aqeel Asaad Al Salem
Supplier quality evaluation is a multi-criteria decision-making (MCDM) problem that involves multiple, heterogeneous criteria of different weights. The literature addresses quality, delivery, technology, value and service as the five most common criteria used for supplier quality evaluation. In this thesis, we have considered the most important criteria for evaluating the quality of suppliers based on a review of the literature and observation in practice. They include both qualitative and quantitative criteria to reflect the real attributes of the supplier in question, and are applied in a supplier quality evaluation performed for a large data set.
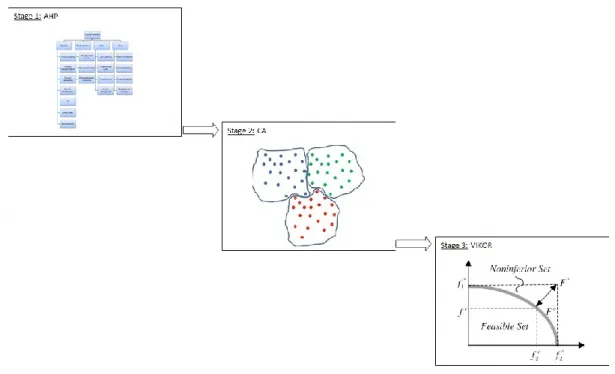
We propose a three-stage model for performing supplier quality evaluation. In the first stage, we identify the evaluation criteria and assign a weight to each criterion. The analytic hierarchy process (AHP) technique is used in this stage. In the second stage, we address the large size of suppliers’ datasets and present a cluster-analysis-based approach to obtain manageable supplier datasets for evaluation purposes. In the third stage, we apply the VIKOR method to evaluate supplier quality in the clusters obtained from the previous stage. A numerical application is provided to demonstrate the proposed approach.
The strength of the proposed model lies in the integrated application of the three techniques, in which each technique is best suited for its respective problem. The model’s other chief advantage
iv
is its ability to deal efficiently with the challenge of evaluating large numbers of suppliers and the data pertaining to their attributes.
v
ACKNOWLEDGEMENTS
First of all, I would like to show my thanks and gratitude to my supervisors Dr. Anjali Awasthi and Dr. Chun Wang for their time, effort and guidance during this work. Truly, words cannot express how thankful I am for what they have done. To Dr. Awasthi, the monitoring guidance and the advisor who was always there following my progress and correcting my path, I am very thankful for your time and support from the first to the last day of this work. Dr. Wang, thank you for being there from the first moment of this work to the last second.
To my best friend and my brother Engineer Ahmad Al Musa, special thanks to him for his support and encouragement and help in editing this thesis. He never stopped asking about my situation and was there when I needed someone, offering me his support and help.
To my lovely wife and the mother of my son, all the thanks for being there by my side and supporting me during this journey. She was the light that shines my way to do what I have done. When I needed someone to hear from, she was there giving me her advice and encouragement. Additionally, this work could not have been done without the welcoming of my little son, Jaber. Whenever I got home, I found him there in front of the door raising his hands waiting for me to hold him.
A special thanks to my family back home. Even though I was far from them, they were the flame behind this work. They never forgot to check my progress and always prayed for me.
Finally, to all of you (those mentioned above) this could have never been done without you. So, thank you very much.
vi
Table of Contents
List of Figures ... viii
List of Tables ... ix List of Acronyms ... xi Chapter 1: ... 1 Introduction ... 1 1.1 Introduction ... 1 1.2 Cost of Quality ... 4 1.2.1 Supplier Quality ... 5 1.2.2 Benchmarking Quality ... 7 1.3 Outsourcing Strategy ... 8
1.3.1 Assessing Suppliers Quality... 9
1.4 Motivation ... 10 1.5 Contribution ... 10 1.6 Thesis Outline ... 12 Chapter 2: ... 13 Problem Statement ... 13 Chapter 3: ... 14 Literature Review ... 14 3.1 Introduction ... 14 3.1.1 Pre-Qualification of Suppliers ... 14
3.1.2 Supplier Quality Evaluation Models ... 17
3.1.3 Selection of the Best Alternative Using Outranking Methods ... 19
3.2 Supplier Quality Evaluation Criteria ... 24
3.3 Practices in Supplier Quality Evaluation ... 29
3.4 Multiple Criteria Decision Making ... 36
Chapter 4: ... 38
Supplier Quality Evaluation and Selection Methodology ... 38
4.1 Introduction ... 38
4.2 First Stage: Determining the criteria and their weights ... 39
4.2.1 Defining the Problem ... 39
vii
4.2.3 Criteria Description ... 40
4.2.4 Finding the Weights ... 45
4.2.5 Evaluating the Pairwise Comparison Results ... 47
4.3 Second Stage: Finding the Suppliers Groups ... 48
4.3.1 Hierarchical Cluster Analysis ... 48
4.3.2 k-means Cluster Analysis ... 51
4.3.3 Pre-qualifying Procedure ... 51
4.4 Third Stage: Supplier Quality Evaluation using VIKOR ... 55
4.4.1 VIKOR ... 55
4.4.2 VIKOR Method and Outranking Methods ... 57
Chapter 5: ... 59
Numerical Example ... 59
5.1 Introduction ... 59
5.2 The Three Stages Solution Approach ... 60
5.2.1 First Stage: Analytic Hierarchy Process ... 61
4.2.2 Second Stage: Cluster Analysis ... 63
4.2.3 Third Stage: VIKOR Method ... 67
5.3 Sensitivity Analysis ... 68
5.4 Validating the Model ... 74
Chapter 6: ... 81
Conclusions and Future Works ... 81
6.1 Conclusions ... 81
6.2 Future Works ... 82
References ... 84
viii
List of Figures
Figure 1.1: Supply chain members ... 2
Figure 1.2: Interactions of supply chain members ... 3
Figure 1.3: The four cycles of supply chain members ... 4
Figure 3.1: Supplier quality evaluation and selection methods ... 16
Figure 3.2: Critical factors affecting purchasing decision making (adopted from de Boer et al., 2001) .... 37
Figure 4.1: The proposed model ... 38
Figure 4.2: Hierarchy for the supplier quality evaluation ... 41
Figure 4.3: Example of dendrogram ... 50
Figure 4.4: Dendrogram showing best cut ... 54
Figure 4.5: Dendrogram showing best cut and cluster memberships ... 55
Figure 4.6: Ideal and compromise solutions adopted from (Opricovic & Tzeng, 2004) ... 56
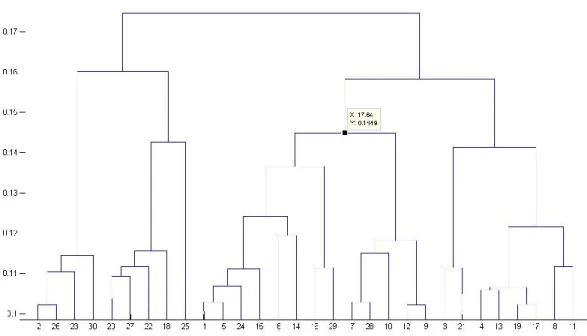
Figure 5.1: Dendrogram for hierarchical analysis... 64
ix
List of Tables
Table 3. 1: Difference between categorical, MP and AHP methods... 22
Table 3. 2: Supplier quality evaluation criteria and methods ... 25
Table 3. 3: Dickson’s supplier quality evaluation criteria ... 28
Table 3. 4: Mentioned criteria in JIT’s articles as concluded by Weber et al., (1991) ... 28
Table 4. 1: Sub-criteria assumption ... 45
Table 4. 2: AHP pairwise comparison scale adopted from (Saaty, 2008) ... 46
Table 4. 3: Random index for each matrix size (adopted from Saaty, 1982) ... 47
Table 5. 1: Linguistic Scale ... 60
Table 5. 2: The evaluation of main criteria ... 61
Table 5. 3: The evaluation of sub-criteria with respect to quality criterion ... 61
Table 5. 4: The evaluation of sub-criteria with respect to performance criterion ... 61
Table 5. 5: The evaluation of sub-criteria with respect to cost criterion ... 62
Table 5. 6: The evaluation of sub-criteria with respect to risk criterion ... 62
Table 5. 7: Consistency test for the criteria ... 62
Table 5. 8: Weights of all sub-criteria ... 63
Table 5. 9: Clusters’ memberships ... 64
Table 5. 10: Criteria and cluster centers ... 65
Table 5. 11: VIKOR results for clusters center ... 66
Table 5. 12: Top 15 suppliers from VIKOR method ... 67
Table 5. 13: Top 15 suppliers evaluated under same weights ... 69
Table 5. 14: Top 15 suppliers evaluated under quality criterion (highest) ... 70
Table 5. 15: Top 15 suppliers evaluated under cost criterion (highest) ... 70
Table 5. 16: Top 15 suppliers evaluated under performance criterion (highest) ... 71
x
Table 5. 18: Top 15 suppliers evaluated under all sub-criteria (equal weights) ... 72
Table 5. 19: Top 10 suppliers evaluated under stability of 𝑣 ... 73
Table 5. 20: River basin systems’ data (Duckstein and Opricovic, 1980) ... 75
Table 5. 21: Keeney and Wood (1977) weights for basin systems criteria with the modified weights ... 75
Table 5. 22: The center of clusters with cluster memberships’ ... 76
Table 5. 23: VIKOR results of river basin systems problem ... 77
Table 5. 24: Choosing river basin system solution from different authors and methods ... 78
Table 5. 25: Weights effect on cluster results ... 79
Table 5. 26: Comparison between partial averaging results and cluster results ... 80
Table A. 1: Generated data ... 95
Table A. 2: Quantitative data (Transformed) ... 97
Table A. 3: Normalized data ... 99
Table A. 4: : The best cluster data ... 101
Table A. 5: VIKOR results ... 102
Table A. 6: Holt’s suppliers’ data ... 103
Table A. 7: Partial Average results to Holts’ data ... 104
xi
List of Acronyms
AHP Analytic hierarch processANP Analytic network process
CA Cluster analysis
CBR Case-based-reasoning
CFM Cost factor measure
CI Consistency Index
CIP Continuous improvement program
CR Consistency ratio
DEA Data envelopment analysis
ELECTRE ELimination Et Choix Traduisant la REalité (ELimination and Choice Expressing REality)
ETO Engineer to order
FCM Fuzzy Cognitive Map
FPP Fuzzy preference programming
GA Genetic Algorithm
ISO International Organization for Standardization JIT Multi-attribute utility theory
MCDM Multi-criteria decision-making MCGP Multi-choice goal programming MILP Mixed integer linear programming MOLP Multi-objective linear programming,
xii
MOMILP Multi-objective mixed integer linear programming
MP Mathematical programming
MTO Make to order
MTS Make to stock
NNB Neural network based
OEM Original equipment manufacturers PAF Prevention, Appraisal & Failure
PROMETHEE Preference Ranking Organization METHod for Enrichment Evaluation
RI Random index
SA: Simulated annealing
SMART Simple multi-attribute rating technique SOFM Self-Organizing Feature Map
TCO Total Cost of Ownership TEU Total Expected Utility
TOPSIS Technique for order preference by similarity to an ideal solution TQM Total Quality Management
1
Chapter 1:
Introduction
1.1
Introduction
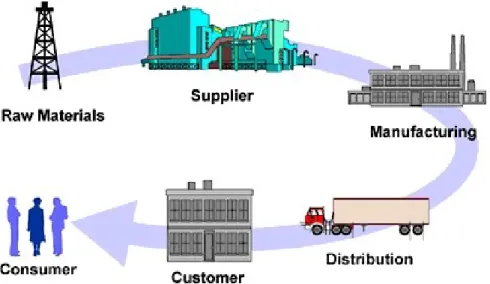
Supply chains are the nervous system that innervates and sustains modern business. Supply chains consist of several organizations, which can be classified into five main categories: suppliers, manufacturers, distributors, retailers and customer (See figure 1.1). These organizations rely on each other, as shown in figure 1.2, which depicts the flow of raw materials directly from supplier to manufacturer all the way to the customer. Alternatively, one manufacturer may receive components from several suppliers and deliver products to many retailers. The concept of the supply chain is premised on the flow of products or services and costs in one direction and the flow of information (or demands) in the other direction. All organizations are directly or indirectly associated with supply chains. Businesses seek to integrate with their supply chain both to minimize their total costs and to increase service levels.
2
Figure 1. 1: Supply chain members
Flow of the right information between the organizations in supply chains plays an important role in reducing the “bullwhip effect”, as capacity planning to meet consumer demand are based on demand forecasts, not the actual demand. Reducing the bullwhip effect leads to increased profitability, increased product availability, decreased replenishment lead-time, and decreased costs of manufacturing, inventory, transportation, shipping and receiving (Chopra & Meindl, 2007).
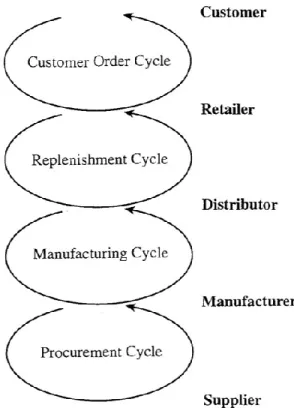
Figure 1.2 suggests that between each chain member there is a cycle of ordering and receiving, thereby amounting to four cycles: the procurement cycle between supplier and manufacturer, the manufacturing cycle between manufacturer and distributor, the replenishment cycle between distributor and retailer, and the customer order cycle between retailer and customer (Chopra & Meindl, 2007). However, the cycles in any supply chain are not necessarily obvious. For example, the replenishment cycle of the manufacturer that sells to the end customer directly
3
without intermediates (distributor & retailer) in its supply chain is not immediately apparent to a casual observer.
Figure 1.2: Interactions of supply chain members
Figure 1.3 presents a schematic diagram of the four typical cycles among supply chain members. In any given supply chain, however, the cycle of procurement should be identified and recognized clearly as it is the first step in reducing cost of quality in supply chain. In this thesis, we will limit the focus of our study to the procurement function (outsourcing) of organizations.
4
Figure 1.3: The four cycles of supply chain members
1.2
Cost of Quality
Costs of Quality are the costs related to having defective products or services (Groocock, 1974). The Cost of Quality can be categorized as: Prevention costs, Appraisal costs and Failure costs (PAF). According to Groocock (1974), Foster (2010), and Dale & Plunkett (1999), Prevention costs are those related to preventing defects from occurring. They include the costs of supplier quality assurance, supplier assessment, training, and other related domains. Appraisal costs, meanwhile, are the costs associated with inspection or testing of products. They include any type of inspections, testing, material evaluation, supplier monitoring or ISO 9000:2008 qualification activities. Failure costs are those associated with the failure of product quality, which can be either (a) internal costs, which occur during production, or (b) external costs, which involve any product failure after its production, including during its ownership by the customer. Groocock
5
(1974), however, asserts that this conception of costs fails to emphasize “the purpose of action”. He stressed the importance of relating costs to the purpose of the preventive action taken in relation to the product, and proposed the following four categories of costs:
1. Screening: the costs of finding defective items and separating them from the conformed items;
2. Replacement of defectives: the costs of substituting defective items with conformed items;
3. Prevention of defectives: the costs of preventing defective items from occurring;
4. Improvement of screening: the costs of reducing screening costs by improving the effectiveness of the screening process.
Dale and Plunkett (1999) argue that there is no clear definition of quality costs upon which all can agree. They assert that the PAF Model is no longer applicable to all companies, given the predominance of new concepts such as TQM, according to which many quality-related activities cannot be clearly assigned to any part of the PAF model. Instead, they propose another approach that focuses on the relationship between suppliers, companies and customers. Its central idea is that “the costs categorized under ‘supplier’, ‘company’ and ‘customer’ headings are more closely related to the way companies operate” (Dale & Plunkett, 1999). Suppliers, as providers of material, are one of the most important determiners of quality in any supply chain; therefore examining a supplier’s quality-related activities is of utmost importance.
1.2.1Supplier Quality
Today, many products are either copied from the original product of its type, reproduced with poor materials, or both. What makes these products substandard is primarily the poor quality of
6
the materials from which they were made. These products tend to be highly unreliable and once they break or malfunction, they cannot be fixed. For example, last year the Chinese police arrested people who manufactured copies of the iPhone (a smart cell phone) that were of very poor quality compared to that of the original, which is trademarked by Apple, Inc (O'Dell, 2012).
Usually, the quality of a product depends on the practices of the supplier. For this reason, most big companies, such as Boeing, for example, carefully choose their suppliers. They know that the standards and operative practices of a supplier have significant impact on buyers’ profits, because they determine product quality and affect the development and speed of production processes. In fact, according to the Harvard Business Review on Supply Chain Management (2006), from 1996 to 2002, the top 100 American manufacturers had increased the proportion of their spending on materials from 43 cents per dollar in 1996 to 48 cents in 2002, showing an increasing reliance on suppliers. According to the same source, the top three automobile companies in the US – Ford, GM and Chrysler – could not compete with the two major Japanese car companies, Toyota and Honda. The reason for this is that these latter two companies have been able to build a “close-knit network of vendors”, enabling them to produce cars faster than the three US companies (taking approximately half the production time), with more reliable products, by sourcing 70% to 80% of their manufacturing costs to US suppliers. Their success has come from integrating the supplier with the company by sharing of learning from each other’s practices. For example, in 1987, Honda sent one of its engineers for 12 months to learn about the candidate supplier who worked there for a year and provided the supplier with suggestions to help them cope with Honda’s production strategy. After one year, the candidate supplier agreed to all of Honda’s recommendations. Years later, both Honda and the supplier reaped the benefits of this sharing of ideas, and the supplier’s business increased steadily over
7
the subsequent five years (Harvard Business Review on Supply Chain Management, 2006). The mutual benefit arose from the companies’ cooperation in improving quality. Another example of the importance of selecting the right supplier is that of Boeing, a major manufacturer of aerospace vehicles and products, which has outsourced to Hamilton Sundstrand Company the manufacturing of nine systems of its 787 Dreamliner aircraft (Trent, 2008). As an aerospace manufacturer, Boeing has placed a high priority on choosing the highest quality suppliers to avoid crises and delay in delivery schedules. The chief reason behind its choice of Hamilton Sundstrand is that this company applies a lean strategy and closely involves suppliers in its business. In keeping with this approach, Hamilton Sundstrand sent a team of its workers to work on-site with its supplier for several months.
1.2.2Benchmarking Quality
According to Boyer and Verma (2010), benchmarking is the process of comparing the practices of a company to the best practices of other companies. Benchmarking of quality involves comparing the quality performance of a given company with that of the best one in its practice domain. Many companies copy the best practices of other successful companies in order to gain maximum competitive advantage. The philosophy of Toyota JIT, for example, has been adopted by many companies. The examples mentioned in the previous sub-section of this chapter involve benchmarking of quality, where the buyer involved with a supplier ensures its fit with the buyer’s regulations. Undoubtedly, the importance of benchmarking has grown to become a standard metric for improving quality.
8
1.3
Outsourcing Strategy
Most companies today depend on outsourcing to build their products. Outsourcing strategy has shown its effectiveness in increasing organizational profits through the development of better products when outsourced from the right supplier. According to Simchi-Levi (2003), outsourcing has the following benefits:
1. Creating economies of scale. This refers to the aggregation of orders from different customers to one supplier. This helps the supplier to reduce its manufacturing and purchasing costs, which leads to mutual benefits for both the supplier and the buyers alike, through the sale of the product at low cost.
2. Risk pooling. Outsourcing leads to reduced uncertainty in management of demands, since the demand is aggregated at the supplier facility from many buyers. This allows the supplier to handle the uncertainty of demand in a more efficient way.
3. Reduction of capital investment. Making the decision to outsource exempts the buyer from investing in manufacturing of the products. However, the capital investment that suppliers make is affordable for them, since they are dealing with many customers. 4. Focus on core competency. Outsourcing products that the buyer is not best at producing
enables the buyer to focus on its core strengths.
5. Increase in flexibility. This can be achieved through faster reaction to customer demands, decreasing the duration of the product development cycle time and enhancing the company’s ability to apply new technologies.
Any company would like to enjoy these benefits, but outsourcing may not be always the best strategy for a company to employ. Although relying on other companies has some benefits, it has
9
some risks as well. In some instances, a company may be better off manufacturing supply components in-house.
The decision to outsource is made by a company’s procurement or purchasing department. The decision involves many factors, and it gets more complex as the number of factors increase. We explore this issue in more detail in chapter 2. However, the challenging question that arises for outsourcing decisions is this: among the many suppliers available to a buyer, which one should it choose and on the basis of what factors?
1.3.1Assessing Suppliers Quality
Once the decision to procure components from outside suppliers is made, a company typically has to choose from a large set of suppliers. Some of these suppliers may be local and others foreign (global). Most companies prefer local suppliers, but several factors may influence a company’s decision to look globally for more distant suppliers. Some of these factors include superior quality and lower price of the components provided. Supplier quality evaluation involves many criteria to be considered when it comes to deciding which supplier to deal with. This makes it a multi-criteria decision-making problem, since some supplier attributes need to be maximized while the others need to be minimized. So, before looking for a supplier, companies typically need to examine a large list of criteria to evaluate the candidate suppliers. Moreover, as the number of relevant criteria increase, the decision of choosing the right supplier becomes more complex. Consequently, a combination of approaches or methods may be required to address this complexity problem. However, before employing such methods, a buyer should examine a list of criteria to evaluate suppliers and determine the weights to be given to each criterion.
10
1.4
Motivation
The problem of evaluating supplier quality is an interesting and complicated MCDM problem. Evidence of its complexity can be found from the fact that it is still an active subject in the literature, despite the presence of a many number of methodologies in literature. Dealing with multi-criteria problems forces decision-makers to accept trade-offs between criteria. There is no other way to generate solution for such problems except by seeking compromises as a supplier might be dominant in one criterion, but not in the others.
In this thesis, we propose a modeling framework for analyzing the quality of a large number of suppliers from different environments. Our review of the literature pertaining to supplier quality evaluation has not revealed any previous study for large sets. Most researchers have applied their model on a small set of suppliers. Some have evaluated suppliers based on very few criteria and in some cases; criteria may not be carefully evaluated. Unfortunately, most of their models do not provide a mechanism for efficient analysis of a large number of suppliers. It is commonly known that as the number of suppliers and criteria increase, the problem of evaluation becomes more difficult and needs more time to be resolved. Therefore, we propose to develop a comprehensive and efficient model to analyze this type of problem for tracking or monitoring the quality performance of suppliers.
1.5
Contribution
The proposed modeling framework integrates three methods that have heretofore been used separately for the purpose of evaluating supplier quality. Each of the methods was adopted for its strengths and advantages with respect to the problem under study. The first method is based on the Analytic Hierarchy Process (AHP) and concentrates on determining criteria and their
11
weights. AHP has the ability to handle qualitative and quantitative criteria, simplifies the problem through building hierarchy, and is widely used and approved by many researchers and consultants for the purpose of prioritizing criteria.
The second method based on cluster analysis (CA) is used to manage large supplier data sets in such a way that suppliers with similar attributes are grouped together in clusters. Cluster analysis has the ability to group similar objects – in this case, suppliers – into clusters. Suppliers in a given cluster are more alike in many aspects than those in other clusters. CA technique was chosen for its ability to handle a large number of data efficiently and to guarantee that the best suppliers are not eliminated at least at the initial levels (Holt, 1996).
The third method based on VIKOR (Vlse Kriterijumska Optimizacija Kompromisno Resenje) technique is used to rank suppliers and select the best supplier(s) based on the overall criteria. The VIKOR method was selected for its ability to find the compromise solution that is closest to the ideal solution. The compromise solution is most likely to be accepted by decision-makers since it was developed on the basis of “the majority of criteria” rule (Opricovic & Tzeng, 2004).
Integrating these methods confers their respective advantages upon the model and enables it to handle the supplier quality evaluation problem in different ways: managing large data sets, evaluating or analyzing them, and ranking them quickly and efficiently. Moreover, this model can be used to monitor selected suppliers’ performance after a period of cooperation through comparison of results at different stages and under different situations. The strength of the proposed model is that it works with both small and large sets of supplier data:, however, its chief purpose is to analyze large data sets, as demonstrated in chapter 5. In short, this model is capable of handling the multi-criteria problem on any scale of information.
12
1.6
Thesis Outline
Chapter 2 presents the problem statement.
Chapter 3 presents a literature review on supplier quality evaluation criteria and methods.
Chapter 4 defines the criteria and sets out the proposed model. The model consists of three stages. The first stage is used to determine the weight of each criterion. The second stage is used to pre-qualify suppliers. The third stage is used for selecting the best supplier.
Chapter 5 applies the proposed model by introducing the problem and applying the three stages model to the information presented.
13
Chapter 2:
Problem Statement
In this thesis, we address the problem of supplier quality evaluation, which is a multi-criteria decision-making problem. The problem consists of evaluating a large number of alternatives (suppliers) under a given set of criteria (quantitative or qualitative). According to Zanakis et al. (1998), most existing methods of supplier evaluation and selection are not suitable for application to a large number of alternatives, since these methods tend to generate inconsistencies. For this reason, the large data sets of suppliers must be treated in a way that overcomes this problem. To this end, the model will solve the following challenges:
1. How do buyers deal with large numbers of suppliers in heterogeneous business environments, that is, under different geographical location, product type and product volume conditions?
2. Which criteria should buyers use for supplier quality evaluation? 3. How should buyers rank criteria or decide criteria weights? 4. How should buyers deal with qualitative and quantitative criteria? 5. How should buyers generate supplier quality rankings?
14
Chapter 3:
Literature Review
3.1
Introduction
We will present the literature review on supplier selection and supplier quality evaluation under three categories:
Pre-qualification of suppliers.
Supplier quality evaluation models.
Supplier selection (the best alternative) using outranking methods.
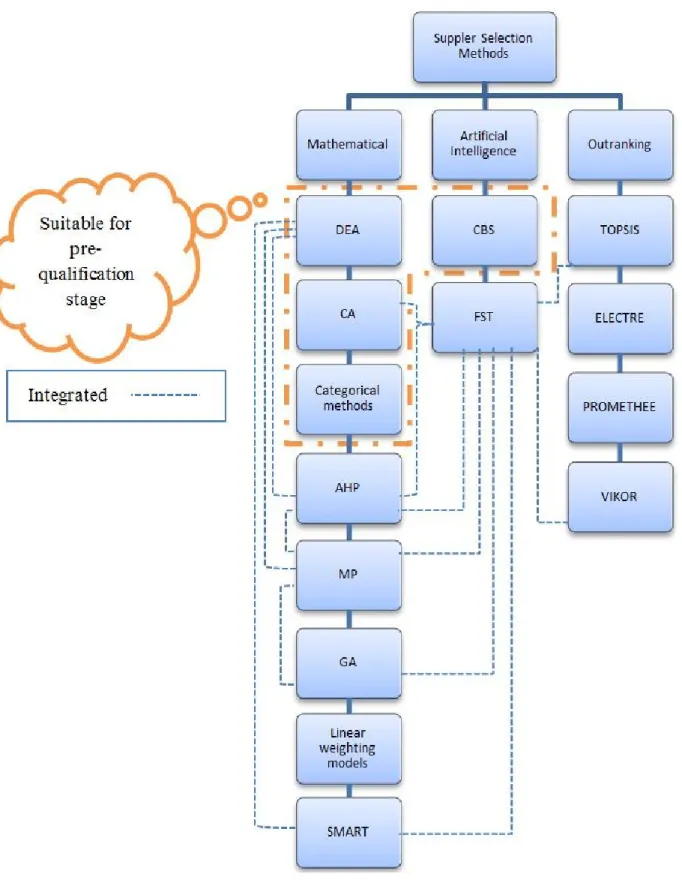
Figure 3.1 presents the commonly used methods reported in the literature to address the above problems.
3.1.1Pre-Qualification of Suppliers
The purpose of Pre-qualification models is to reduce the set of all suppliers to a small and manageable set of suppliers. De Boer et al. (2001) introduce four methodologies for pre-qualification of suppliers. These methods are presented as follows:
15 3.1.1.1Categorical methods
In this method, criteria are listed in matrix form along with the list of suppliers. Suppliers that do not satisfy a particular criterion are given a (-) mark, those that satisfy it receive a (+) mark, and those that are neutral in respect of the criterion receive a (0) mark. The supplier with the most (+) marks is selected (Lam et al., 2010). This method is traditional and has limited applications.
3.1.1.2Data envelopment analysis (DEA)
DEA is a linear programming method that calculates the ratio of weighted outputs to weighted inputs. This method is used to find the efficiency for each supplier by taking the ratio of the weight of the summed outputs to the weight of the summed inputs. Then, the supplier with the highest ratio is considered the best choice (De Boer et al., 2001).
3.1.1.3Cluster analysis (CA)
CA relies on a classification algorithm to group the suppliers in a number of clusters so that similar suppliers occur within defined classes. This algorithm can be applied either through hierarchical clustering or k-mean clustering to find out the set of suppliers that are qualified (Holt, 1998). It is important that the rating be expressed numerically.
3.1.1.4Case-based-reasoning (CBR)
CBR uses artificial intelligence to generate relevant information for decision-makers on the basis of the similar and previous situations (De Boer et al., 2001) for supplier selection purposes.
16
17 3.1.2Supplier Quality Evaluation Models
The supplier quality evaluation models can be categorized as follows:
3.1.2.1Analytic Hierarchy Process (AHP)
AHP has been widely used for the purpose of supplier quality evaluation (Liu and Hai, 2005). The AHP method involves breaking down a complex problem into different levels. Once these levels have been identified, pairwise comparison is performed to find the interrelationships among them (Lam et al., 2010). The AHP method has been combined with other methods such as Fuzzy theory, linear programming, goal programming and data envelopment analysis (Vaidya & Kumar, 2006) for the purpose of supplier selection.
3.1.2.2Simple multi-attribute rating technique (SMART) / MAUT
(SMART) / MAUT method has the ability to deal with deterministic and stochastic decision environments. It is like the AHP method, which breaks down the complex problem to less complex problems and then evaluates the criteria. It can deal with both quantitative and qualitative criteria (Lam et al., 2010). Barla (2003) was able to apply this method in five steps for glass manufacturing. The steps consist of generating criteria; selecting the attribute; developing the SMART criteria by giving a number between 0-100 to each attribute; determining the proportion valve of the attribute; and constructing the SMART evaluation form, in which the supplier that has the highest Total Expected Utility (TEU) is ranked as the first choice, and so on.
3.1.2.3Analytic Network Process (ANP)
ANP is an advanced form of AHP where interaction between criteria and alternatives are considered. This method is used widely in supplier selection. It is used to detect or find the
18
interaction between equivalent levels of criteria and to reduce the judgmental forecast error (Lam
et al., 2010).
3.1.2.4Mathematical Programming
In Mathematical Programming (MP) methods, the decision-maker formulates the problem and proposes an objective function which needs to be maximized or minimized. However, one of the disadvantages of these methods is that they deal only with quantitative criteria (De Boer et al., 2001).Researchers have successfully applied mathematical programming to solve the supplier quality evaluation problem. Five techniques of mathematical programming are more commonly used. These are linear programming, integer programming, non-linear programming, goal programming and multi-objective programming.
3.1.2.5Genetic Algorithm (GA)
The GA works as a search algorithm, through which the good chromosomes survive, to be reproduced again, enabling a solution to be found in a short search period. Ding et al. (2005), used GA as an optimizer in simulation operations to solve the supplier quality evaluation problem.
3.1.2.6Fuzzy Set Theory
This method has been integrated with many other methods to select the right supplier. The benefit of this method is its capacity in dealing with the imprecision and uncertainty of subjective judgment. It can work with qualitative and quantitative variables. When used with qualitative data, linguistic values are selected based on the triangular fuzzy numbers concept. It
19
is also used to assess the weight to be given to criteria. For more information, the reader may refer to Chen et al. (2006), who integrated this method with the AHP and TOPIS methods.
3.1.2.7Linear weighting models
According to De Boer et al. (2001), the linear weighting method is a straightforward approach whereby the weight given to a criterion is multiplied by its corresponding criterion value, and then the rating for each alternative is summed and the one that has the highest rating is selected. This method was used in the basic model. However, different versions were later suggested with little improvement.
3.1.3Selection of the Best Alternative Using Outranking Methods
A variety of ranking methods have been proposed in literature to find the best supplier. Some of these are TOPSIS, ELECTRE, PROMETHEE and VIKOR. A general overview of these methods is given below:
3.1.3.1TOPSIS
This method finds the best solution based on the shortest distance to the ideal solution and farthest distance from the negative-ideal solution (Lai et al., 1994). It can be used with both qualitative and quantitative criteria. The final results of the rankings are based on the alternative distance from the positive ideal and negative-ideal solution. The first-ranked alternative has the shorter value and is the best choice.
20 3.1.3.2ELECTRE
This is considered to be the first outranking technique applied for the purpose of ranking alternatives. The honor of its discovery goes back to Roy and SEMA Company in 1965 (Figueira
et al., 2005). ELECTRE is a preference-based model. For example, if there are alternatives (a) and (b), it compares them to find whether (a) or (b) is strictly preferred to the other, or there is no difference between them, or they are incomparable. Since the original ELECTRE method, a number of versions have come up. Some of these are ELECTRE II, ELECTRE III, and ELECTRE IS, each of these is applicable to a specific type of problem.
3.1.3.3PROMETHEE
PROMETHEE is similar to the ELECTRE method, but the concept differs in that this method considers the outranking flows for evaluating alternatives. The concept is built on pairwise comparison between alternatives, and calculating two outranking flows for each alternative, namely positive and negative outranking flows. The positive outranking flow gives a measure of how the alternative outranks all the others, while the negative outranking flow gives a measure of how the alternative is outranked by all the others. The higher the alternative value is in positive flow, the better the alternative is; the lower the alternative is in positive flow, the better the other alternatives are (Figueira et al., 2005). As with ELECTRE, a number of versions of this method have been created, such as PROMETHEE I, PROMETHEE II, and PROMETHEE GAIA.
3.1.3.4VIKOR
VIKOR method finds the compromise solution from a set of alternatives based on the nearest distance to the ideal solution. The method can be applied to a mixture of data. It uses –metric
21
maximum group utility” rule by integrating the weight of the decision-making strategy ( ) into
its calculation. Voting is considered to be by majority rule where the weight of the decision-making strategy is greater than 0.5, “by consensus” if equal 0.5, or “by veto” if less than 0.5 (Opricovic & Tzeng, 2004; 2007).
Table 3.1 illustrates the advantages and limitations of some supplier quality evaluation methods developed based on the work of Jain et al., (2009).
22
Categorical Mathematical programming Analytic hierarchy process
Advantages Limitations Advantages Limitations Advantages Limitations
Can include both qualitative and quantitative criteria
Equal weight to all criteria Can guarantee optimum solution Difficult to include multiple decision makers Hierarchical representation of a system, can be used to describe how changes in priority at upper levels affect the priority of criteria in lower levels
Use of statistical method is clearly not straightforward for most users and it makes the process quite cumbersome Easy implementation Subjective Objective evaluation Requires arbitrary aspirations levels
Stable and flexible; stable in that small changes have a small effect and flexible in that additions to a well- structured hierarchy do not disrupt the
performance
Cannot effectively take into account risk and uncertainty in assessing the suppliers’ potential performance because it presumes that the relative importance of criteria affecting suppliers’ performance is known with certainty
23
Categorical Mathematical programming Analytic hierarchy process
Advantages Limitations Advantages Limitations Advantages Limitations
Lowest
implementation cost
In LP/MIP. Allow only one objective function and the rest are constraints
The suppliers’ performance can be monitored or at least visible to the buyer to a certain extent leading to better management of suppliers
This may be a time-consuming activity as consensus may need to be reached by reviewing the models with team members Requires minimum data Objective function coefficients should be determined prior to making the model
Characteristic property of AHP is that it is fully comparison based that this might not always be realistic. In addition, the assumption of
comparability is not valid due to lack of information or unwillingness to compare two alternatives with respect to some criterion i.e. it is costly to obtain necessary
information
24
3.2
Supplier Quality Evaluation Criteria
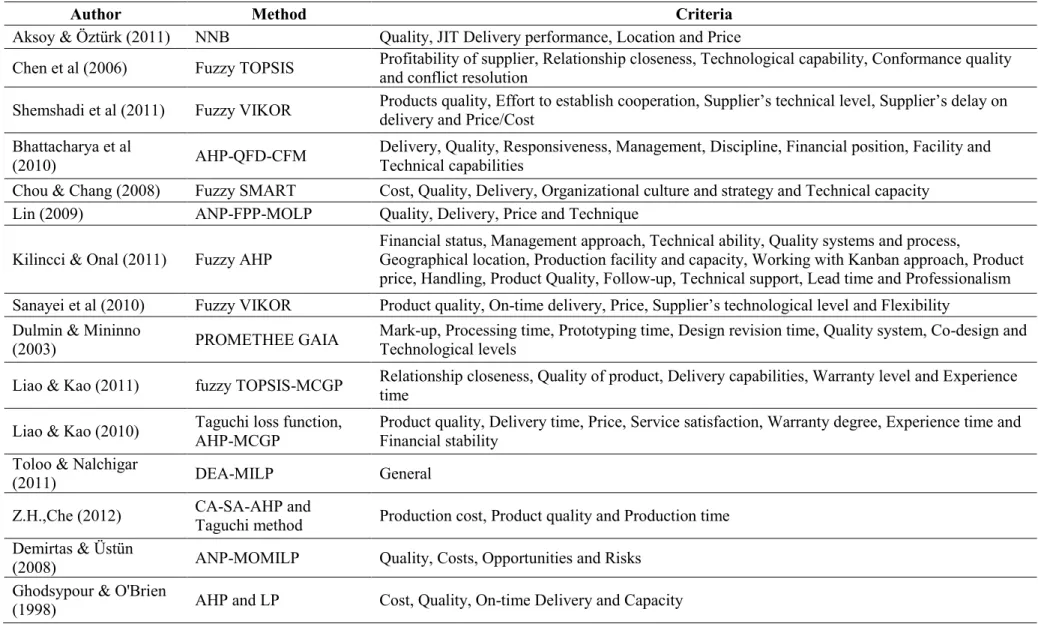
Table 3.2 presents the most commonly used supplier quality evaluation criteria and methods reported in literature. Supplier quality evaluation criteria were first proposed by Dickson in 1966, when he listed 23 criteria for supplier quality evaluation based on a survey of purchasing agents and managers. Dickson’s criteria for supplier quality evaluation are presented in Table 3.3.
It can be seen in table 3.3, that quality is the most important criterion for supplier quality evaluation, followed by delivery. However, this survey was conducted 45 years ago, in 1966. Nowadays, many salient features of supply and production have changed with globalization and technological progress. However, most of these criteria are still valid for evaluation purposes. Weber et al. (1991), studied all the literature pertaining to supplier quality evaluation criteria that had been published from Dickson’s paper until 1991. They found that each of the 74 articles has at least one of the criteria that Dickson mentioned. Moreover, 64% of these articles mentioned at least two of Dickson’s criteria. Weber et al. (1991), also studied thirteen articles related to JIT philosophy in order to see which of Dickson’s criteria were mentioned in them. Their results are listed in table 3.4.
25
Author Method Criteria
Aksoy & Öztürk (2011) NNB Quality, JIT Delivery performance, Location and Price
Chen et al (2006) Fuzzy TOPSIS Profitability of supplier, Relationship closeness, Technological capability, Conformance quality and conflict resolution Shemshadi et al (2011) Fuzzy VIKOR Products quality, Effort to establish cooperation, Supplier’s technical level, Supplier’s delay on
delivery and Price/Cost Bhattacharya et al
(2010) AHP-QFD-CFM
Delivery, Quality, Responsiveness, Management, Discipline, Financial position, Facility and Technical capabilities
Chou & Chang (2008) Fuzzy SMART Cost, Quality, Delivery, Organizational culture and strategy and Technical capacity Lin (2009) ANP-FPP-MOLP Quality, Delivery, Price and Technique
Kilincci & Onal (2011) Fuzzy AHP Financial status, Management approach, Technical ability, Quality systems and process, Geographical location, Production facility and capacity, Working with Kanban approach, Product price, Handling, Product Quality, Follow-up, Technical support, Lead time and Professionalism Sanayei et al (2010) Fuzzy VIKOR Product quality, On-time delivery, Price, Supplier’s technological level and Flexibility
Dulmin & Mininno
(2003) PROMETHEE GAIA
Mark-up, Processing time, Prototyping time, Design revision time, Quality system, Co-design and Technological levels
Liao & Kao (2011) fuzzy TOPSIS-MCGP Relationship closeness, Quality of product, Delivery capabilities, Warranty level and Experience time Liao & Kao (2010) Taguchi loss function,
AHP-MCGP
Product quality, Delivery time, Price, Service satisfaction, Warranty degree, Experience time and Financial stability
Toloo & Nalchigar
(2011) DEA-MILP General
Z.H.,Che (2012) CA-SA-AHP and Taguchi method Production cost, Product quality and Production time Demirtas & Üstün
(2008) ANP-MOMILP Quality, Costs, Opportunities and Risks Ghodsypour & O'Brien
(1998) AHP and LP Cost, Quality, On-time Delivery and Capacity
26
Author Method Criteria
Chen & Yang (2011) Fuzzy AHP and Fuzzy
TOPSIS Product price, Product quality, Delivery time and Risk Chan and Chan (2004) AHP Cost, Quality, Delivery, Service, Flexibility and Innovation Hong et al. (2005) CA and MINP Quality, Price, Frequency and Quantity
Choy et al. (2005) CBR Price, Quantity, Delivery, Innovation level, Level of technology, Culture, Commercial awareness, Production flexibility, Ease of communication and Current reputation
Jain et al. (2004) Fuzzy GA Part rejection rate, Delivery performance, Residual stress and Surface finish Wang et al. (2004) AHP-GP Delivery reliability, Flexibility and responsiveness, Cost and Assets Talluri and Narasimhan
(2003) LP Price, Rejects and Late deliveries
Sarkis and Talluri (2002) ANP Cost, Quality, Time, Flexibility, Culture, Technology and Relationship
Barla (2003) SMART Quality organization, Service, Geographical condition, Reliability of subcontractor, Capability of subcontractor and Financial condition Ramanathan (2007) DEA-TCO-AHP Costs Manufacturing, Quality costs, Technology and After-sales service
Karpak et al. (2001) GP Product cost, Quality of castings purchased, Capacities of each supplier, Demand and Delivery reliability of castings purchased Wadhwa and Ravindran
(2007)
Weighted objective, GP and Compromise programming
Price, Lead time and Quality
Aydin Keskin et al.
(2010) Fuzzy ART
Producing critical/safety part, Producing similar part, Having technically adequate employee and equipment, Having adequate production capacity, Existing test capability, measurement and control apparatus, Ability of managing diversification, Ability of design and improvement, Financial capability to reach raw material, semi-finished product and other resources, Suitable price policy and payment periods, Using/providing its certificates effectively, Existent dispatching performance or dispatching problems, Ability of packing, transportation and logistics demands, Geographical location, Applications of work safety and labor health and Environmental effects and preventive actions
27
Author Method Criteria
Xiao et al. (2012) FCM-fuzzy soft Quality risk of the product, Service risk, Supplier’s profile risk and Long-term cooperation risk Zeydan et al. (2011) fuzzy AHP, fuzzy TOPSIS-DEA
New Project Management, Supplier Management, Quality and Environmental Management, Production Process Management, Test and Inspection Management, Corrective & Preventive Actions Management, Defect Ratio, Warranty Cost Ratio and Quality Management
Florez-Lopez (2007) fuzzy SOFM
Responsiveness, Commit to improvement, Delivery mistakes, Cost reduction effort, Delivery delays, Price, Reliability, Commit to quality, Fluctuation on costs, Order mistakes, Outgoing quality, Timely communication, Customer service and Technical assistance
NNB:Neural Network Based, CFM: cost factor measure, ANP: Analytic network process, FPP: Fuzzy preference programming, MOLP: Multi-objective linear programming, MCGP: multi-choice goal programming, MILP: mixed integer linear programming, SA: simulated annealing, MOMILP: multi-objective mixed integer linear programming TCO: Total Cost of Ownership, FCM: Fuzzy Cognitive Map, SOFM: Self-Organizing Feature Map.
28
Criteria Number of mentioned out of 13 Ranked in Dickson's Table
Quality 13 1
Delivery 13 2
Price 8 5
Geographical location 7 20
Production facilities & capacity 6 6
Table 3.4: Mentioned criteria in JIT’s articles as concluded by Weber et al., (1991)
Rank Factor Mean Rating Evaluation
1 Quality 3.508 Extreme importance
2 Delivery 3.417
Considerable importance 3 Performance History 2.998
4 Warranties and claim policies 2.849 5 Production facilities and capacity 2.775
6 Price 2.758 7 Technical capability 2.545 8 Financial position 2.514 9 Procedural compliance 2.488 Average importance 10 Communication system 2.426
11 Reputation and position in
industry 2.412
12 Desire for business 2.256 13 Management and organization 2.216 14 Operating controls 2.211
15 Repair service 2.187
16 Attitude 2.12
17 Impression 2.054
18 Packaging ability 2.009
19 Labor relations record 2.003 20 Geographical location 1.872 21 Amount of past business 1.597
22 Training aids 1.537
23 Reciprocal arrangements 0.61 Slight importance
29
Notice that even with 45 years difference; these criteria still have relevance. Dickson’s table ranked geographical location as 20th out of the 23 criteria (average importance). When it comes to supplier quality evaluation using JIT philosophy criteria, it might be considered in a more advanced position than under Dickson’s ranking.
Huang and Keskar (2007) proposed comprehensive metrics for supplier quality evaluation of original equipment manufacturers (OEMs). They came up with a list of metrics for seven categories under three divisions: “reliability, responsiveness and flexibility” in the product-related division; “cost and financial” and “assets and infrastructure” in the supplier-product-related division; and safety and environment in the society division. Additionally, they considered three types of products in their construction of the metrics: make to stock (MTS), make to order (MTO), and engineer to order (ETO). They came up with a total of 101 metrics for supplier quality evaluation for OEMs. For the list of metrics, the reader may refer to the original paper by Huang and Keskar (2007).
3.3
Practices in Supplier Quality Evaluation
A. ISO 9000 and ISO 14000 Standards
The International Organization for Standardization (ISO) is well-known for developing a set of standards that “makes the development, manufacturing, and supply of products and services more efficient, safer and cleaner” (Boyer & Verma, 2010). The ISO has created several standards, but the best-known ones are ISO 9000 and ISO 14000. ISO 9000 is used for assessing quality requirements, while ISO 14000 is a standard for environmental quality management. Both are known as “generic management system standards” because they can be applied to any
30
product, service or material (Boyer & Verma, 2010). An ISO certificate can be given to any organization after it prepares its documents containing a description of its business practices in line with the guidelines provided by ISO. According to Liao et al. (2004), acquiring ISO 9000 has the following benefits for an organization:
1. Access to markets. ISO 9000 certification helps organizations maintain their number of customers or even increase them. The European Community Council requires specific sectors to have them in order to establish their work.
2. Customer demand. It is required by customers who prefer that suppliers have it. 3. Improvement of the company's quality system. Getting the certificate helps the
organization to improve its quality system and prepare itself for auditing or surveillance by the ISO.
4. Other advantages. The certificate is well-known around the world, and can improve quality through improving an organization’s overall competitiveness.
B. Boeing Quality Management System Requirements for suppliers
On its website, www.boeingsuppliers.com, Boeing has listed its requirements for the suppliers that it prefers to work with. Some of these suppliers’ requirements for quality management systems include the following (for all requirements, the reader may refer to Boeing, 2012):
1. Has ISO 9001 as supplemented by 9100 and not limited to AS9100C, EN9100 and JISQ 9100;
2. Has AS/EN/JISQ 9100 certified by an accredited Certification Body listed in the International Aerospace Quality Group's (IAQG) OASIS database;
31
3. Maintains AS/EN/JISQ 9100 transition timeline; and
4. Manages the variation of key characteristics (KCs) by having statistical control and capability of KCs, and identifies improvement opportunities and implementation of improvement actions.
C. Bombardier’s suppliers
Bombardier is an aerospace manufacturer that deals with a large number of suppliers – nearly 3000 suppliers from 20 countries (Bombardier, 2012). According to their website (2012) Bombardier has two types of supplier qualification criteria: those directly related to aircraft and those indirectly related to aircraft. Suppliers who have products directly related to aircraft must have the following requirements: AS 9100, National Aerospace and Defense Contractor Accreditation Program (NADCAP) and quality requirements. Meanwhile, suppliers supplying products indirectly related to aircraft must meet these requirements: ISO 9000 (for tooling, tooling fabrication and cutting tools) and if possible ISO 14000. However, in general, Bombardier considers the following criteria for all suppliers during the process of selection:
1. Willingness and ability to share market risk; 2. Ongoing performance;
3. Systems or service facilities’ capabilities; 4. Financial strength;
5. Location; and 6. Certifications.
32
Moreover, Bombardier’s preferred suppliers must sign onto a commitment to keep high labor standards and to regularly self-audit their performance. In these agreements, Bombardier retains the right to investigate and audit suppliers in the following areas:
1. Human rights and labor law 2. Health
3. Safety
4. Environment and governance standards 5. Anti-corruption behavior and
6. Ethics
Bombardier asks its candidate suppliers who have all the above-mentioned criteria to fill out a supplier pre-selection form for the purpose of evaluating the quality of the supplier when Bombardier needs a supplier. In addition, Bombardier selects the suppliers that match its strategic focus on delivering superior engineering, quality and supply chain excellence.
D. Bell Helicopter Supplier Quality
Bell Helicopter chooses its suppliers based on an approved list of suppliers. This list contains 14 criteria, as following (Bell Helicopter Textron Company, 2012):
1. Position in Industry
2. Technology
3. Capacity
33
5. Responsible for Engineering, Development and testing
6. Warranty Commitment
7. Full Service Capabilities (Program management and design capable)
8. Participation in Cost Reduction Programs
9. Progressive Culture with Continuous Improvement Philosophy
10.Service and Support
11.Responsiveness to requests for quotes, technical assistance and e-business
12.Effective Problem Resolution
13.Proactive Approach to Defect Prevention and Continuous Improvement
14.Location
Suppliers that meet these criteria provide Bell Helicopter with high service level “in the areas of quality and delivery performance, cost reduction, technology, diversity content, quality system and registration”. Suppliers, who do not deliver this level of service, are asked to do corrective actions otherwise they will be removed from the list of suppliers.
E. Rolls Royce
Rolls Royce selects their suppliers based on supplier’s overall capability evaluation that involves three factors: economical, environmental and social (Rolls Royce, 2012). Moreover, the process of approving candidate suppliers, when appropriate, is performed through Supplier Total Evaluation process. This process has several assessments to keep supplier providing the highest level of performance and assessing supplier capability.
34
Rolls Royce has supplier quality and development organization that includes the following tasks:
1. Supplier approval and maintenance: responsible for the approved supplier list.
2. Supplier development: responsible for supplier’ development, improvement, control of nonconformance and for driving root cause analysis for supply chain problems.
3. Supplier Quality: responsible for verification of products in the supply chain through process’ observation, inspection and documentation review.
4. ME-P: Manufacturing Engineers responsible for advice supplier about a product or process related issues and to ensure that suppliers have the manufacturing capability.
F. IBM
IBM has minimum requirements for its suppliers and sub-suppliers. One of these requirements is that supplier should have quality program that controls its manufacturing process. Moreover, supplier should measure quality on a continuous basis and report it to IBM. To prevent defective products from occurring, process controls are required. Any quality related problems should be studied and analyzed so that the cause is identified and a set of correction actions is proposed. Supplier or sub-supplier should conduct a continuous improvement to reduce defects and maintains agreed annual goals (IBM, 2011).
35 G. GE Energy
According to GE Energy (2006), supplier should have ISO 9001-2000 certification or any equivalent certification in order to ensure that the production will be in control and fit to GE specifications. However, supplier with no certificate could satisfy above requirements after successfully completing a quality systems audit.
GE has the following requirements to approve suppliers:
1. Properly executed Mutual Non-Disclosure Agreement (MNDA)
2. Acknowledgement of the GE Integrity Guide for Suppliers, Contractors, and Consultants
3. Quality system assessment
4. Technical assessment
5. Environmental, Health and Safety (EHS) and Employment Practices compliance
6. Financial viability assessment.
H. Dell
To do business with Dell, supplier needs to meet some standards. The suppliers at Dell need to cover following priorities and standards (Dell, 2012):
1) Certification and Standards: ISO 14001, occupational health and safety management system standard OHSAS 18001 and ISO 9001. And are willing for
36
2) Capability Building and Assessment:
a) Training
b) Continuous Improvement
c) Quarterly Business Reviews
d) Monitoring
3.4
Multiple Criteria Decision Making
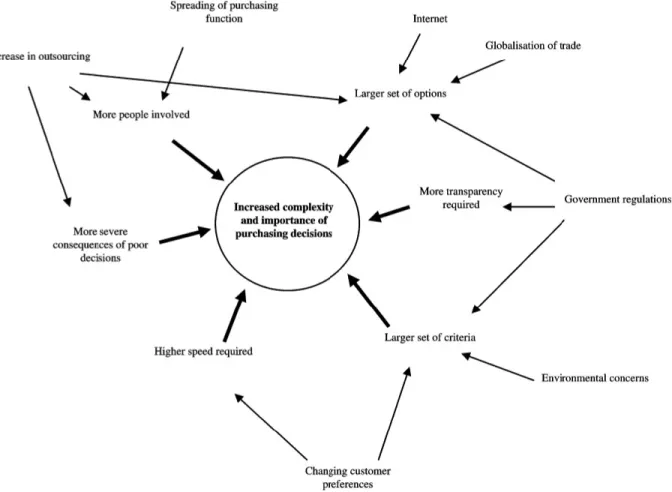
Multiple Criteria Decision Making (MCDM) problems involve selecting or choosing the best alternative(s) from a given set of alternatives based on certain criteria. Often in such problems, the decision-maker confronts conflicting objectives, and no solution is easily evident due to intangibility of criteria and the complexity of the problem. In such circumstances, the decision-maker needs to separate different type of criteria and allocate weights or preferences. The best solution is a compromise, since the decision-maker tries to find an alternative by trading-off the criteria. As the number of criteria and alternatives increase, the problem becomes more complex as what de Boer et al. (2001), clarify in Figure 3.2.
37
Figure 3.2: Critical factors affecting purchasing decision making (adopted from de Boer et al., 2001)
Therefore, a model or method that solves conflicting objectives in MCDM problems is needed. Before that, however, the decision-maker needs to list the criteria on which the evaluation method will be based and how the alternative preferences will be decided. In addition, the decision-maker has to provide weights to each criterion. Many approaches to solve MCDM problems have been proposed in literature. Some of these are AHP, TOPSIS, and VIKOR which have been discussed in section 3.1.2.
38
Chapter 4:
Supplier Quality Evaluation and Selection
Methodology
4.1
Introduction
In this chapter, we present our methodology for supplier quality evaluation and best supplier (s) selection. The proposed model consists of three stages. The first stage is devoted to determining the weight of each criterion or variable. The second stage focuses on pre-qualifying suppliers and grouping them based on similar characteristics. The final stage deals with evaluating supplier quality and finding the best solution. These stages are summarized in Figure 4.1.
39
4.2
First Stage: Determining the criteria and their weights
This stage is concerned with finding criteria and sub-criteria for supplier quality evaluation and assigning them appropriate weights. As mentioned in chapter three, there are a number of methods that can help decision-makers assign weight to the variables. In the proposed model, AHP technique has been considered. Vaidya & Kumar (2006) conducted an overview of applications that had used AHP. From 150 papers, they found that most of the researchers used this method for selection and evaluation purposes. The applications of these papers were in engineering, personal and social categories. Moreover, many researchers such as Narasimhan (1983), Nydick & Hill (1992) and Partovi et al. (1989), suggested using AHP for supplier evaluation and selection because of its ability to deal with qualitative and numerical attributes. However, AHP is more efficient when the pairwise comparisons at each level are reasonably small (Partovi, 1994). Saaty (1980) suggests that each level should be limited to 9 pairwise comparisons. AHP, however, is not a good method to apply for supplier quality evaluation from a large set of alternatives. Hence, to overcome these problems, it will be used to structure the criteria/sub-criteria and determine their weights. The procedure is as follows: first, define the problem; next, build the hierarchy; then, perform pairwise comparisons; and finally, evaluate the weights.
4.2.1Defining the Problem
The first step in AHP is defining the objective of the problem. This will help in framing right criteria/sub-criteria for use in next stage of AHP.
40 4.2.2Structuring the Hierarchy
After defining the problem objective, decision-makers build the hierarchy. The hierarchy is a kind of chart or tree used to simplify the problem by decomposing it into a hierarchy of criteria, sub-criteria and alternatives. It consists of several levels. The first level or level one contains the problem objective as stated in step one. Level two contains the main criteria. Level three contains the sub-criteria associated with the main criteria. At the last level are the alternatives for evaluation.
4.2.3Criteria Description
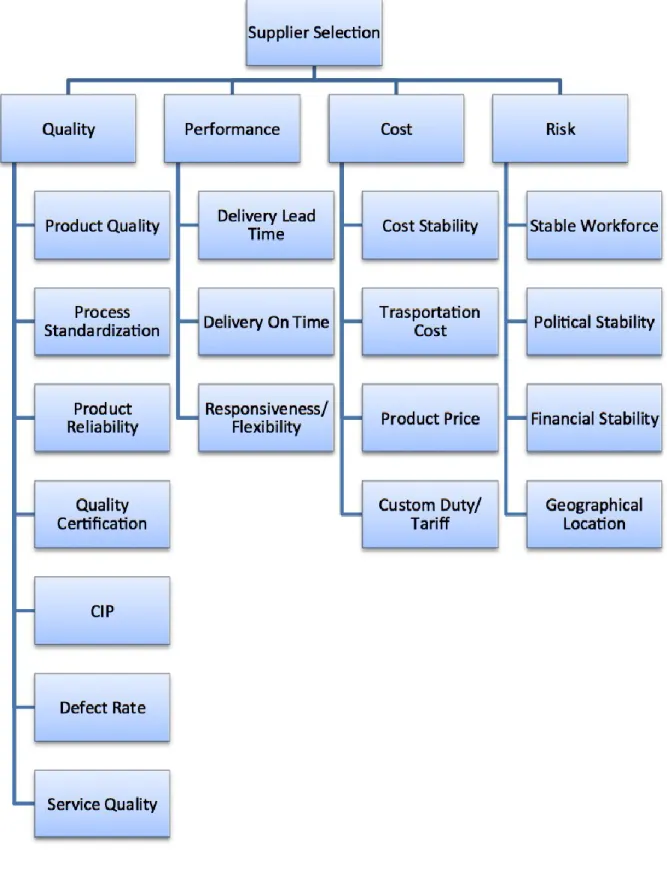
We propose four main criteria namely quality, performance, cost and risk for supplier quality evaluation. Each of these criteria can be divided into several sub-criteria. Figure 4.2 presents the hierarchy of the four criteria and their sub-criteria. The main criteria and sub-criteria are described as following:
4.2.3.1Quality
This is the most important criterion for any organization that is looking to build a strong reputation through satisfying its customers’ needs. It can be measured using the following sub-criteria:
1. Product quality (C01)
The quality of the product fits in with customer regulation, as the organization seeks to gain their customers’ satisfaction about the product. In short, product quality is the essence of what the customers need.
41
42
2. Process standardization (C05)
This is a binary factor; either the supplier has process standardization or it does not. Process standardization pertains to the use of standard methods, techniques and components.
3. Product reliability (C06)
This sub-criterion represents the robustness of the product, in terms of its number of failures and the likelihood of its durability in retaining the same performance and efficiency.
4. Quality certification (C07)
It involves obtaining quality certificate in any kind of quality that has been gained through satisfying certificate requirements, such as ISO 9000 or any other quality certification.
5. Continuous improvement program (CIP) (C09)
This includes presence of a program or initiative whereby the organization continuously tries to improve the quality of product or production process or adapts to new technology.
6. Defect rate (C14)
This is the rate at which products are rejected by customers because of defects. For example, 2 to 15 defects per 100,000 products.
7. Service quality (C04)
The service quality level is measured in terms of empathy, ease of communication, and user friendliness.
4.2.3.2Cost
Cost or price is also a significant factor in supplier selection. Customers are always looking for the minimum product cost so they can maximize their profit or the value of their purchase. The sub-criteria related to this criterion are:
43
1. Cost stability (C08)
Cost stability refers to how often the supplier changes its product cost. Put another way, this is a measure of whether the customer has a long-term agreement with the supplier.
2. Transportation cost (C15)
The assumption of transportation cost variations depends on the supplier’s location. It is different for local, international and global suppliers.
3. Product price (C17)
It is the purchase price of product expressed in dollars. 4. Custom cost/ Tariff (C18)
This sub-criterion applies to global suppliers for their customs charges.
4.2.3.3Performance
The performance of the supplier is its ability to react to and meet the customer’s needs within the agreement period or as quickly as possible. This criterion can be measured through the following attributes:
1. Responsiveness/ Flexibility (C03)
This is the ability of the supplier to respond to any change from the customer in terms of any increase in the product quantity or an urgent order.
2. Delivery on time (C02)
This is the ability of the supplier to deliver a shipment at the right time. 3. Delivery lead time (C16)
It is the time from ordering the item until it arrives at the point of sales. For example, this is assumed to be between 2 and 4 days for local suppliers, 3 and 7 days for national suppliers and between 12 and 20 days for global suppliers in our thesis.
44 4.2.3.4Risk
Risk is an important factor that buyers should consider and study carefully, especially when dealing with global suppliers. It can affect the ability to meet the customer’s expectations, such as receiving late shipment or low quality products. The following sub-criteria are related to risk: 1. Workforce stability (C10)
This represents the satisfaction of the employees with their job and the environment that they work in.
2. Political stability (C11)
This is an important factor, especially when the supplier is international. Political change in a given country can change business policies and practices, and therefore affect the long-term partnership between supplier and buyer.
3. Financial stability (C12)
The financial status of the supplier is important for a long-term partnership with buyers. It is the backbone that gives supplier the ability to improve, adapt to new technologies and survive among its competitors.
4. Geographical location (C13)
The geographical locations of suppliers are classified as local, national and global respectively.
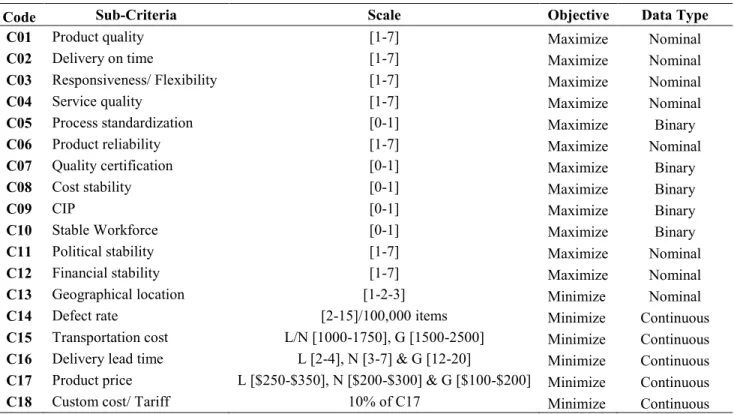
Table 4.1