TECHNICAL APPENDIX A8.3: PEAT LANDSLIDE AND HAZARD
RISK ASSESSMENT
Gorpley Wind Farm
Peat Landslide and Hazard Risk Assessment
SLR Ref : 403.01591.00011
September 2012
CONTENTS
1.0 INTRODUCTION ... 2
1.1 Background ... 2
1.2 Objectives of Report ... 2
1.3 Wind Farm Proposal ... 3
1.4 Site Location and Description... 3
2.0 DESK STUDY REVIEW ... 6
2.1 Site Background ... 6
2.2 Local Geology ... 6
2.3 Mining and Quarrying ... 6
2.4 Hydrology ... 7
2.5 Hydrogeology ... 8
3.0 PEAT INSTABILITY ... 9
3.1 Background Information Regarding Peat... 9
3.2 Peat Stability – Factors to be considered. ... 11
3.3 Peat Mass Stability ... 12
4.0 SITE RECONNAISSANCE AND GEOMORPHOLOGICAL MAPPING ... 14
4.1 Site Work ... 14
4.2 Methodology ... 14
5.0 GROUND CONDITIONS ... 16
5.1 Peat ... 16
5.2 Substrate ... 17
5.3 Description of Ground Conditions at Turbine Locations ... 18
6.0 RISK AND HAZARD ASSESSMENT ... 19
6.1 Risk Score Development ... 19
6.2 Hazard Score Development ... 24
6.3 Hazard Ranking ... 26
6.4 Results... 27
7.0 CONSTRUCTION ISSUES... 33
7.1 Turbine Locations and Crane Pads ... 33
7.2 Access Tracks ... 34
7.3 Cable Routes ... 34
7.4 Control room/Substation ... 35
7.5 Temporary Construction Compound and Laydown Area ... 35
7.6 Borrow pits ... 35
8.0 CONCLUSIONS AND RECOMMENDATIONS ... 36
8.1 Conclusions ... 36
8.2 Recommendations ... 36
TABLES
Table 5-1 von Post Classification for Peat Humification ... 17
Table 5-2 Water Content ... 17
Table 6-1 Risk and Hazard Nomenclature ... 19
Table 6-1 Coefficients for Slope Gradients ... 20
Table 6-2 Coefficients for Peat Thickness and ground conditions... 21
Table 6-3 Coefficients for Substrate ... 22
Table 6-4 Risk Rating ... 22
Table 6-5 Stability Risk Rating for each turbine location ... 23
Table 6-6 Coefficients for Impact Feature Ranking ... 24
Table 6-7 Coefficients for Impact Feature Distance ... 25
Table 6-8 Coefficients for Impact Feature Elevation ... 25
Table 6-9 Impact Rating ... 25
Table 6-10 Rating Normalisation ... 26
Table 6-11 Hazard Ranking ... 26
Table 6-12 Stability Hazard Ranking ... 29
Table 6-13 Summary Hazard Assessment ... 31
DRAWINGS Drawing No.1 Site Location Drawing No.2 Historic Mining Drawing No.3 Gradient Map Drawing No.4 Interpreted Peat Thickness Drawing No.5 Stability Risk Rating FIGURES Plate 1 - Typical Example of Peat present at Gorpley...5
Plate 2 - Peat overlying Glacial Till...15
EXECUTIVE SUMMARY
SLR Consulting Ltd (SLR) has been appointed by Arcus Renewable Energy Consulting Ltd (Arcus) to advise on the geological and geotechnical aspects of the proposed Gorpley Wind Farm (the Development). The scope of work includes a Peat Stability Assessment, Borrow Pit Assessment and advice on how the local geology could impact on the site development. It should be noted that the Peat Stability Assessment is a major aspect of the scope of work. The Peat Stability Assessment is the product of a number of phases of investigation to modify turbine locations and routing based on the various constraints, including, ecology, slope, hydrogeology and landscape. This peat assessment is the final assessment based on the wind farm layout defined in the Environmental Statement.
The design of the layout has been modified to avoid, where possible, any areas where peat stability was considered a risk. The risk assessment identified a limited number of locations where there was considered to be sufficient risk that a hazard assessment should be undertaken to identify appropriate mitigation measures. Areas where a risk of peat instability was identified relate mainly to access tracks; the turbine locations are generally low risk. As there is no specific guidance for peat slide risk assessment in the development of wind farms in England, the methodology adopted in this risk and hazard assessment closely
follows the guidance prepared by the Scottish Government1
The purpose of the assessment was to determine the risk of peat slope instability resulting from construction activities associated with the entire wind farm infrastructure. The Guidance requires the risk of instability to be determined and, subsequently, the possible impact of any instability to be assessed. The hazard is determined in terms of the impact on potential receptors such as infrastructure, communities and environment.
Guidance (“The Guidance”). The methods are aimed specifically at assessing the risk and consequences of peat instability and consider the impact of failure on a number of receptors including the general public, on and off-site infrastructure and the environment, including watercourses.
The investigation has shown that of the 5 turbine locations; all are located on peat (>0.50m depth organic soil horizon) with 4 No. having a risk rating for peat instability either ‘negligible’ or ‘low’ and 1 No. with a ‘medium’ risk rating.
A number of locations along the access track were assessed as having a ‘medium’ risk of instability; further consideration and identification of appropriate mitigation measures has reduced the hazard to an insignificant hazard rating.
Mitigation measures have been discussed and recommendations for further work made. It is important to note that this risk assessment is the first phase in the development of a fundamental understanding of the sub-strata relationships at the Gorpley site. This risk assessment should be further informed by more detailed site investigations and used to ensure the appropriate detailed design of access tracks, hard standings and turbine foundations.
.
1
1.0 INTRODUCTION
SLR Consulting Ltd (SLR) was commissioned by Arcus Renewable Energy Consulting Ltd (Arcus) to advise on the geological and geotechnical aspects of the proposed Gorpley wind farm (the Development) which includes a Peat Slide Risk Assessment. The Development Site is located near Todmorden, West Yorkshire (Drawing No.1).
The purpose of this report is to consider the potential risk of peat slides occurring at the site such that suitable controls and appropriate methodologies can be employed during construction and commissioning of the wind farm to mitigate these risks.
This report presents the findings of the peat depth probing and site reconnaissance surveys which were undertaken following a desk study review of existing literature and map information for the site area.
The methods adopted for the assessment follow the best practice guidance1 issued by the
Scottish Government for the investigation, assessment and reporting for wind farms in peat areas in Scotland. Although conformance with this document is not mandatory in England, it is considered to represent industry best practice and the general requirements have been adopted for this project. Where deviations from this guidance have occurred, this is highlighted in the text.
This report has been compiled to reflect our understanding of the potential effect the peat may have as a consequence of the development of the site. The information contained herein should be used in the civil engineering design associated with turbine construction, associated infrastructure and a recommended Construction Method Statement.
1.1 Background
The importance of assessing the stability of peat deposits in relation to wind farm development came to the fore as a result of peat failures during the construction of the
Derrybrien Wind farm2
Wind farms tend to be constructed in high moorland areas which are commonly associated with significant peat deposits (typically blanket bogs). Peat instability is a natural occurrence which is influenced by many factors including, but not limited to, peat thickness, slope, underlying geology and subsurface hydrology.
in Ireland in 2003. Although no fatalities were associated with these failures, there was a significant environmental impact.
1.2 Objectives of Report
This Peat Stability Assessment is primarily concerned with the influence of the peat as a consequence of the development of the wind farm.
The main objective was to assess the potential peat stability at the wind farm site, identify areas of concern and identify mitigation measures to ensure the maintenance of peat stability before, during and after construction. All aspects of construction should be based on ensuring minimum disruption to the peat areas, where possible.
The objectives have been achieved by completion of the following:
2
Lindsay, R.A. and Bragg, O., (2004), ‘Wind Farm and Blanket Peat, The Bog Slide of 16th October 2003 at Derrybrien, Co. Galway, Ireland’. University of East London
• A desk study of available reports which include geological, hydrological and topographical information;
• Geomorphological mapping of the site to identify the prevailing conditions
influencing the potential for, or any evidence of, active, incipient or relict peat instability,;
• Reporting on evidence of any active, incipient or relict peat instability, and the potential risk of future instability, describing the likely causes and contributory factors;
• Identify potential controls to be imposed on the Contractors for the Works to
minimise the risk of peat instability occurring at the Gorpley Wind Farm Site; and
• Provide recommendations for further work or specific construction methodologies
to suit the ground conditions at the Gorpley Wind Farm Site to mitigate any unacceptable risk of potential peat instability.
This report summarises the findings of the Desk Study and Site Reconnaissance surveys and provides an assessment of the prevailing ground conditions as they relate to peat stability issues.
1.3 Wind Farm Proposal
The Development comprises 5 wind turbines with approximately 2 km of new access track, excluding approximately 1.5km of access track which will be shared with the neighbouring Reaps Moss Wind Farm. The Development will include a control building in the permanent works. The temporary works will include two site establishment compounds and laydown areas, one adjacent to Bacup Road and one on Inchfield Moor, near to turbine 3.
1.4 Site Location and Description
The Development Site is located approximately 6 km south-west of Todmorden. The site location and proposed locations of the turbines is presented on Drawing 1. It is proposed that access to the Development will be via an access route shared with the adjacent Reaps Moss wind farm. Planning permission for this track has been granted although it has yet to be built. As of summer 2012 updated and revised plans for this track are awaiting determination by Calderdale Council. It is understood that the Council are mindful to consent subject to S106 legal agreement. However, given that consent for the previous track has already been granted, and the revised access track is an improvement on the previously approved access route, it is reasonable to assume that the access track will be granted planning permission. A further 2 km of new track will be required to access the turbine locations from the Reaps Moss track. It should be noted that this Peat Slide Risk assessment covers access routes excluding the shared Reaps Moss access route, as it is considered that any assessments required for the Reaps Moss access route will have been undertaken by the developer as part of that application.
The Development includes the following:
• Five (5 No.) wind turbines with a maximum height to blade tip of 125 metres;
• Permanent foundations supporting the wind turbines and associated crane hard
standings (used during construction, operational repair and decommissioning);
• New access bell mouth arrangement from the A681 (part of the Reaps Moss access track);
• Permanent tracks into the site from the public highway (partly including the
Reaps Moss access track) and between turbines, including both cut and floating track sections;
• Four watercourse crossings;
• Underground cabling within the Development and to a new substation on site;
• One hub height anemometry mast;
• An electrical metering and site control building; and
• A 33kV substation including external transformers, substation control building,
stores and offices and associated works.
In addition, the following activities are required during the construction phase of the project:
• Establishment of two temporary site establishment and laydown compounds; and
• Excavation and management of material during foundation and track
construction.
The ground elevation (excluding the Reaps Moss access track) is between 360m AOD at Turbine 1 to 400m AOD in the vicinity of Turbine 5 within the Development Site.
The higher ground drains initially by overland flow and small streams. Peat deposits may act as a sponge and release rainwater for a considerable time after significant rainfall. The small channels enter the main tributaries and flow generally northwards towards the Weather Hill Gulf which in turn flows into Gorpley reservoir.
Peaty soil and peat deposits cover a significant portion of the site and variously overlie glacially derived soils such as glacial till comprising, sand and gravels and in places bedrock.
1.4.1 Extent of Peat Coverage
The extent of peat coverage as recorded by the BGS is presented on Drawing No.4. The peat is a blanket bog which has been mapped covering a large area of the Development Site; the underlying substrate is generally rock and to a lesser extent, Glacial Till.
2.0 DESK STUDY REVIEW
A desk study was undertaken of the available information relating to ground conditions which was then used to make recommendations for a ground investigation required for detailed turbine and access road foundation design.
2.1 Site Background
The application site is located in a rural farm and moorland setting on a generally north and north-east facing slope including Maden Pasture, Counting Hill, Inchfield Moor and Three Nooks. The site boundary is irregular in shape and is approximately 2.5km by 2km at its largest extent and approximately 206 hectares in area.
2.2 Local Geology
The British Geological Survey 1:625,000 and 1:50,000 solid geology data shows the site to be underlain by rocks of the Langsettian age Pennine Lower Coal Measures (PLCM). This comprises a sequence of interbedded grey mudstone, siltstone and pale grey sandstone, with marine bands (mudstones containing marine fossils) and coal seams.
The more detailed 1:10,000 data indicates the site to generally be underlain by PLCM including the named units of the Woodhead Hill Rock (sandstone) and the Rossendale Formation (interbedded mudstone and siltstone).
The principal named coal units (oldest first) include the Bassy Coal, the Lower Mountain Coal and the Upper Mountain Coal.
The BGS data indicates that upon Oatley Hill, Three Nooks, Inchfield Moor and upon the high ground to the south of the Development Site, the solid geology is overlain by drift deposits and peat. The mapped extent of peat from the BGS data is presented on Drawing 4. In summary the peat deposits are recorded to be present across Spa Hill, Inchfield Moor and Three Nooks. A smaller extent of peat is marked, towards the southern boundary of the site, extending approximately 300m to the west from Trough Edge End. Drift deposits are not mapped across the remainder of the site. However, diamicton (till – poorly sorted sediment) is likely to be present to variable depths.
The BGS map records indicate a single inferred normal fault crosses the site to the north-east of the proposed turbine locations (striking north-west to south-north-east with down-throw towards the south-west). There is no information on the dip of the fault and the rock exposure in the area is poor, therefore it is not possible to confirm the location of the fault or extent below the site area as part of this review.
2.3 Mining and Quarrying
The desk study revealed that areas within the application site had previously been exploited for coal and fire clay.
Prior to the construction of the turbines and associated site infrastructure, the location and extent of historic mine workings (both recorded and unrecorded) needs to be determined to allow design of appropriate foundations, etc.
Coal Authority non-residential ground stability reports were commissioned to cover the position of all proposed turbine locations. Additionally, visits were made to the Coal Authority offices to inspect the abandonment plans and relevant geology plans were reviewed to
identify the location of any coal seam outcrops. The geology plans indicate that the seams are dipping at approximately 8o to the south west.
The information from the above sources were then combined using geo-referencing techniques to produce a best fit composite drawing showing the proposed positions of the turbines in relation to the known coal seams and recorded mine workings, this information is presented on Drawing 2.
The drawing shows the positions of the known coal seams as recorded on the BGS map. There are four seams present within the Development Site. However, the abandonment plan showing the worked seams only as two coal seams recorded, the Upper Mountain or 40 Yards Mine and the Gannister Coal Outcrop (believed to be the Lower Mountain Coal). The position of the Upper Mountain seam is fairly consistent when comparing the BGS mapped location of the coal and the outcrop position marked on the abandonment plan. Based on the proposed turbine locations, it doesn’t appear that the Upper Mountain seam underlies any of these positions. The access route does cross the recorded position of the seam and therefore this will need to be taken into consideration during the detailed design of the access tracks particularly if a cut and fill technique is to be used.
The position of the Gannister Coal Outcrop, as recorded on the abandonment plan, appears to be at a different position to that of the recorded coal seams marked on the BGS map. At the south eastern end of the seam within the development area, the two positions (from the abandonment plan and the BGS map) of the coal seam are recorded at a similar location. However, in the centre of the Development, the position of the outcrop recorded on the abandonment plan is closer aligned to the coal seam further down the geological sequence, (as recorded on the BGS map). To the north-west of the Development, close to Maden Pastures, the recorded Gannister Coal Outcrop (from the abandonment plan) is again approximately aligned with the BGS recorded position of the coal seam higher up the sequence. Based on the proposed turbine positions, it appears that Turbines T1 and T4 are likely to be influenced by the historic mining of this coal seam. Additionally, the access track potentially crosses the coal seam at a number of locations along the proposed route. This will need to be taken into consideration during the detailed design of the foundations and the access tracks.
A coal seam is recorded to the north east of the Development (in the area of Spa Hill, Inchfield Moor and Three Nooks). A review of the available records indicate that this coal seam hasn’t previously been recorded as being worked, possibly due to its depth below ground level. The positions of Turbines T2, T3 and T5 do not appear to be located above the recorded seam. However, it is possible that there are unrecorded working in this area. Notwithstanding the above, it is recommended that a site investigation is carried out pre-construction beneath all turbine locations, crane pads and along the access track as it is possible that un-recorded mine workings are present.
2.4 Hydrology
The majority of the Development Site lies within the headwaters of the Howroyd Clough catchment which in turn flows in to Gorpley reservoir. The principal watercourse within the catchment is Weather Hill Gulf, which generally flows in a north-easterly direction from Inchfield Moor towards Range Hoyle at the centre of the site. There are a number of other smaller unnamed watercourses within the development area which either flow directly into Howroyd Clough or are tributaries to Weather Hill Gulf.
The access tracks in the Development Site are shown to lie within the catchment of Weather Hill Gulf and the other smaller tributaries of the Howroyd Clough as described above. The shared access track within the Reaps Moss land ownership is considered to be located partially within the Howroyd Clough catchment and partially within the headwaters of Hoyle Hey Clough and Reaps Clough.
Intact peat deposits tend to have a ‘flashy’ water discharge regime characterised by ‘peaky’ storm responses, large differences between low and high flows and a rapid rise in the hydrograph during storm events.
2.5 Hydrogeology
The underlying Pennine Lower Coal Measures are recorded as being a Secondary A classification aquifer with permeable layers capable of supporting water supplies at a local rather than strategic scale, and in some cases forming an important source of base flow to rivers.
Aquifer characteristics of peat are that significant volumes of water are retained in this material. Groundwater may be present in sand and gravel horizons within the diamicton and also in fractures or fault zones of the bedrock deposits. It is also probable that there will be limited groundwater storage and movement at the weathered interface of the diamicton and bedrock.
Shallow groundwater will be present in the river valleys where deposits of sand and gravel will store and allow movement of groundwater. This groundwater is likely to be in hydraulic continuity with the rivers.
Groundwater flow in upland areas typical of much of the application site tends to follow specific flow paths from high ground to adjacent valleys. Springs and seepages occur wherever water-bearing conduits intersect the surface, but their exact location may be hidden by standing or flowing surface water or by peat or other drift deposits.
3.0 PEAT INSTABILITY
This section reviews the nature of peat and how current and past activities can influence stability.
The factors which are likely to influence the potential for peat instability are:
• Significant peat depths over impermeable bedrock or minimal soil;
• The presence of slope gradients greater than 40 (approximately) and general
topography;
• Natural drainage paths;
• Evidence of past failures, including soil creep;
• Drainage features at the base of slopes which could lead to undercutting;
• Forestry plantations and artificial drainage; and
• Recent climate patterns.
It should be noted that peat instability is not a recent phenomena and there is documentary
evidence of peat landslides dating back over 500 years3
3.1 Background Information Regarding Peat
. Many landslides that involve peat have no human interference that could be considered as a trigger and this should be borne in mind when considering the susceptibility of a site to potential instability.
Peat is found in extensive areas in the upland and lowland regions of the UK and is defined as the partly decomposed plant remains that have accumulated in-situ, rather than being deposited by sedimentation. When peat forming plants die, they do not decay completely as their remains become water logged due to regular rainfall. The effect of water logging is to exclude air and hence limit the degree of decomposition. Consequently, instead of decaying to carbon dioxide and water, the partially decomposed material is incorporated into the underlying material and the peat ‘grows’ in-situ.
Peat is characterised by low density, high moisture content, high compressibility and low shear strength, all of which are related to the degree of decomposition and hence residual plant fabric and structure. To some extent, it is this structure that affects the retention or expulsion of water in the system and differentiates one peat from another.
Lindsay4
There are two distinct layers within a peat bog, the upper acrotelm and the lower catotelm. The acrotelm is the fibrous surface to the peat bog
defined two main types of peat bog, raised bog and blanket bog, which are prevalent on the west coast of Europe along the Atlantic seaboard. In Britain the dominant peat land is blanket bog which occurs on the gentle slopes of upland plateaux, ridges and benches and is predominantly supplied with water and nutrients in the form of precipitation. Blanket peat is usually considered to be hydrologically disconnected from the underlying mineral layer.
5
3
Smith, L.T., (Ed) (1910), ‘The literary of John Leland in or about the years 1535-1543.’ Vol.5, Part IX. London: AF Bell and Sons.
, typically less than 0.5m thick; which exists between the growing bog surface and the lowest position of the water table in dry
4
Lindsay, R.A., (1995), ‘Bogs: The ecology, classification and conservation of Ombrotrophic Mires.’ Scottish Natural Heritage, Perth.
5
Ingram, H.A.P., (1978), ‘Soil layers in mires: function and terminology’. Journal of Soil Science, 29, 224-227.
summers. Below this are various stages of decomposition of the vegetation as it slowly becomes assimilated into the body of the peat.
For geotechnical purposes the degree of decomposition (humification) can be estimated in
the field by applying the ‘squeezing test’ proposed by von Post and Grunland6 (1926). The
humification value ranges from H1 (no decomposition) to H10 (highly decomposed). The
extended system set out by Hobbs7
The relative position of the water table within the peat controls the balance between accumulation and decomposition and therefore its stability, hence artificial adjustment of the water table by drainage requires careful consideration.
provides a means of correlating the types of peat with their physical, chemical and structural properties.
3.1.1 Peat Shear Strength
In geotechnical terms, the shear strength of a soil is the physical characteristic that provides stability and coherence to a body of soil. For mineral soils such as clays or sands, such strength is variously given by an inter-particle friction value and cohesion. Depending whether the mineral soil is predominantly cohesive (clay) or non-cohesive (sand) governs which of the components of strength control the behaviour of the soil.
For peat soils, where the major constituent is organic and there is likely to be little or no mineral component, the geotechnical definition of shear strength does not strictly apply. At present there is no real alternative method for defining the shear strength of peat, therefore the geotechnical definition is generally adopted, in the knowledge that it should be used with great caution.
As noted before, the acrotelm or near surface peat comprises a tangle of fresh and slightly rotted roots and vegetable fibres. These roots and fibres impart a significant tensile shear strength capacity to the material which provides it with a significant load carrying capacity. The acrotelm is, in effect, a fibre reinforced soil.
In the more decomposed catotelm, the tensile shear strength is reduced as the roots and fibres become more rotted. However, the loss in strength due to decomposition is off-set to a limited degree, by a gain in strength due to the overburden pressure. In geotechnical engineering there is an established relationship for recently deposited soils, between the shear strength of a sample and the thickness of overburden above it.
Consequently it is almost impossible to predict a shear strength profile in peat and attempts to measure the shear strength using normal geotechnical methods can be misleading. Typical values of shear strength from hand shear vanes would be in the range 20-60kPa although values over 100kPa have been recorded in peat elsewhere. The higher strengths are almost certainly due to the influence of roots or other non-decomposed material. It is believed that the strength of peat should be quoted as a cohesion value as there are few, if any, discrete particles to give the material a significant frictional resistance. It should be noted, however, that any quotation of shear strength for peat should be treated with extreme caution.
6
Von Post, L. and Grunland, E., (1926), ‘Sodra Sveriges torvillganger 1’ Sverges Geol. Unders. Avh., C335, 1-127.
7
Hobbs, N.B., (1986), ‘Mire morphology and the properties and behaviour of some British and foreign peats.’ Quarterly Journal of Engineering Geology, London, 19, 7-80.
3.2 Peat Stability – Factors to be Considered
There is considerable observational information relating to debris and peat flows although the actual mechanisms involved in peat instability are not fully understood. The main influences on slope stability are geological, geotechnical, geomorphic, hydrological, topographic, climatic, agricultural and human influences such as drainage and construction activity. Peat is affected to a degree by changes in any of the above list and it is vital to appreciate that changes to the exiting equilibrium will affect the level of slope stability during construction and operation of the scheme.
Some of the contributory factors to peat instability are summarised below:
1. The geographical limits which could be affected by potential instability are not confined to the artificial boundaries imposed by land ownership; landslip occurring above a site could affect the site and property down slope or downstream of the site for several kilometres.
2. Agriculture and grazing has a significant effect on peat areas and this can be
compounded in areas that have been managed to improve grazing. Grazing compacts the peat surface reducing the rainwater infiltration and the additional nutrients change the ecological balance of the original peat bog. Agricultural management can include surface drainage and periodic burning, both of which can leave the surface of the peat bare for a period of time resulting in temporary desiccation of the surface. Subsequent wetting of the peat and resumption of peat accumulation results in the former desiccated and possibly ash covered surface being incorporated into the body of the peat which introduces a weak discontinuity in the profile; this in turn becomes another unknown factor in the stability assessment.
3. Forestry has a significant effect on slope stability particularly in the early stages as the creation of a forest involves disruption of the natural equilibrium and drainage of the slopes and the installation of artificial drains by deep ploughing. The construction of access tracks further disrupts the drainage and concentrates groundwater flow into
narrow, fast flowing erosive streams. The work by Winter el al8
4. Natural Drainage – some of the precipitation falling onto a natural upland peat bog will be absorbed into the low permeability catotelm peat, however, most of the water will run-off as sheet flow through upper, high permeability acrotelm. Thus the water is transmitted to the lower slopes in a reasonably controlled manner through a range of interconnections that operate at different scales and speed2. Failure to understand this and to disrupt the transmission process for the groundwater could result in instability.
noted that forest tracks can act to retard or concentrate the down slope flow of water and thus aid its penetration into the slope below. Such a mechanism has been observed at a number of recent landslips that have affected the road network in Scotland.
5. Artificial Drainage - Where agricultural drainage has been used to improve the quality of
the grazing or to promote forestry, reduces the overall volume of water entering the bog and to transfer this water to the edges more rapidly. This can result in ditches and streams becoming enlarged, causing increased erosion and a greater silt burden in the stream water.
8
Winter, M.R., Macgregor, F. and Shackman, L. (2005a), ‘Scottish roads networks landslide study’ Trunk roads: network management division, published report series. The Scottish Executive.
3.3 Peat Mass Stability
The principal surface indicator of peat slide potential is cracking of the peat land surface and it is the identification of crack patterns in the field and the attendant causes of the cracking that is fundamental to a peat stability assessment.
Sites that have exhibited natural instability in the past are likely to be more susceptible to future instability during and following construction of a wind farm, therefore it is important to identify such instability as part of the Peat Stability Assessment.
3.3.1 Types of failure
The result of instability in peat is the down-slope mass movement of the material; there are a number of definitions of peat instability which are used to characterise the type of failure. A brief description is given below:
• Bog Bursts or Bog Flows – the emergence of a fluid form of well humified,
amorphous peat from the surface of a bog, followed by the settling of the residual peat, in-situ9
• Peat Slides – the failure of the peat at or below the peat/ substratum interface leading
to translational sliding of detached blocks of surface vegetation together with the whole underlying peat stratum
;
9; and
• Bog slide – an intermediate form of instability where failure occurs on a surface within
the peat mass with rafts of surface vegetation being carried by the movement of a mass of liquid peat.
3.3.2 Bog Bursts
Accounts of bog bursts are generally associated with very wet climates or areas which have received storm rainfall events. Bog bursts can be associated with particularly wet peat landscapes; therefore it is possible to identify broad regions of a higher susceptibility to these failures. The constraints used to identify the areas of higher susceptibility to bog burst failure are given below:
• Peat thickness in excess of 1.5 m with no upper limit;
• Shallow gradients from 20 to 100 (peat thicker than 1.5 m is generally not observed on
slopes steeper than 100, also moisture content is generally reduced on steeper
slopes due to drainage);
• Ground which is annually waterlogged to within the upper 1 m below ground level,
(the groundwater level may rise above this but rarely falls below)10
• Greater humification of the lower catotelm within the waterlogged ground; and
;
• Lower surface tensile strength of the fibrous peat and vegetation.
The humified mass can be considered as analogous to a heavy liquid and the stability of this mass is maintained by the strength of the surface or acrotelm peat. Should the surface become weakened through erosion or desiccation or the construction of a surface drainage ditch for agricultural or forestry reasons or through turbary (peat cutting), failure is made more likely.
9
Dykes, A.P and Kirk, K.J., (2001), ‘Initiation of a multiple peat slide on Cuilcagh Mountain, Northern Ireland.’ Earth Surface Processes and Landforms, 26, 395-408.
10
Crisp, D.T., Dawes, M. & Welch, D. (1964), ‘A Pennine Peat Slide’, The Geographical Journal, Vol 130, No4, pp519-524.
There is evidence to indicate that periods of relative drought can predispose the peat mass to a bog burst failure2 as desiccated peat appears less able to re-absorb moisture, resulting in failure due, in part, to buoyancy.
A heavy rainfall event can lead to a surge in the volume of water retained in the bog, resulting in high water pressures and an effective bursting of the peat surface. These types of failure have only been described in the literature in Ireland but have been observed in the United Kingdom.
3.3.3 Peat Slides
Peat slides tend to be translational failures with a defined shear surface at or close to the interface with the substrate.
The factors generally considered to influence susceptibility to peat slide failures are listed below:
• Peat depth up to 2 m;
• Slope gradients between 50 and 150;
• Natural or artificial drainage cut into the surrounding peat landscape;
• Greater humification of the lower catotelm within the waterlogged ground; and
• Lower surface tensile strength of the fibrous peat and vegetation.
It will be noted that some of the factors causing instability are common to both bog bursts and peat slides.
The peat – substrate interface is the primary zone of failure and risk of instability is enhanced by elevated water content at this boundary and softening or weathering of the lower mineral surface. For this reason, any investigation or probing should try to distinguish the nature of the lower mineral substrate.
3.3.4 Bog Slides
Bog slides are a variation on a peat slide where part of the peat mass is subject to movement, usually on an internal layer of material, which may be more prone to movement, such as an interface between the acrotelmic and catotelmic layer.
3.3.5 Natural Instability
The stability of a peat mass is maintained by a complex interrelationship of many factors, some of which may not be immediately obvious. Significant factors include sloping rock head and proximity to a water body. Rainfall often acts as the trigger after the slope has already been conditioned to fail by natural processes.
It should also be remembered that peat bogs are growing environments and that there will come a time, on sloping ground, where the forces causing instability, i.e. the weight of the bog, can no longer be resisted by the internal strength of the peat and its interface with the underlying mineral surface. At this point, failure will occur.
The weight of the peat bog or any soils mantling steep hill slopes will be increased during periods of very heavy rain and it is common to see landslips occurring following extreme rain events, for example the Shetlands in August 2012. This may be a concern for future developments where one of the predicted effects of global warming will be a greater frequency of extreme weather, intense storms being one element.
4.0 SITE RECONNAISSANCE AND GEOMORPHOLOGICAL MAPPING
A programme of site reconnaissance was undertaken to verify the conditions indicated by the desk study, and allow observation of the areas identified from the site walkover as being potentially susceptible to instability. The reconnaissance was undertaken to establish areas of potential concern from a number of constraints including ecological, landscape, hydrogeological and peat risk. The potential risk to these receptors is mainly from the construction of turbine locations, access tracks and associated infrastructure.
The reconnaissance also provided the opportunity to record any visible features of historic peat instability, drainage features, changes in vegetation, land management practices and general geomorphological features. Based on a combination of physical constraints, (such as mining, ecological and hydrogeological) potential areas were investigated to establish suitable locations for turbines and access routes. .
The reconnaissance and mapping were undertaken during March 2012 by experienced geotechnical engineers. This section provides a commentary on, and discussion of the site and the issues arising from observations made during the reconnaissance.
4.1 Site Work
All the identified peat areas were inspected and confirmation probing and sampling was undertaken. The inspection was not limited to the immediate boundaries of the mapped peat areas, but included observations of areas both up-slope and down-slope of the turbine sites, the proposed access tracks where applicable, the cabling track to the sub-station, the construction laydown area on Inchfield Moor, and control building and sub-station.
4.2 Methodology
The thickness of the peat was assessed using a graduated aluminium rod, approx 6mm diameter and 225 cm long (Avalanche Probe). This was pushed vertically into the peat to refusal and the depth recorded, together with a unique location number and the coordinates from a handheld Global Positioning System instrument (GPS). The accuracy of the GPS was quoted as ±4 metres, which was considered sufficiently accurate for this preliminary reconnoitre. All data was uploaded to a PC for incorporation into various drawings and analysis assessments.
Where the peat probing met refusal on a hard substrate, the ‘feel’ of the refusal can provide an insight into the nature of the substrate. The following criteria were used to assess likely material:
o Solid and abrupt refusal – rock;
o Solid but less abrupt refusal with grinding or crunching sound – sand or gravel;
o Rapid and firm refusal – clay; or
o Gradual refusal – dense peat or soft clay.
An assessment of the substrate was made and recorded at each probe hole.
The relative stiffness of the peat was also assessed from the resistance to penetration of the probe and in particular to the effort required to extract the probes (retrieval of the probe was often impossible for one person). Some areas, especially on slopes, were a little drier, resulting in the peat being stiffer and more difficult to fully penetrate. In all instances refusal was met on obstructions allowing identification of subsurface geology.
A peat auger is used to determine the thickness of the peat when it exceeded the 2.25m limit of the probe poles and to recover samples of the substrate when the material is cohesive. There was no cohesive substrate material on the site.
Approximately 250 peat probes have been carried out within the Development site. The location of the probes was chosen by consideration of the data from the desk study and site reconnaissance in combination with the turbine locations and access track. The positions were verified on site by the use of a GPS.
5.0 GROUND CONDITIONS
The ground conditions were assessed from the probing exercise, sample descriptions and descriptions of insitu peat observed in streams and drainage ditches.
5.1 Peat
The peat was found to vary across the site in terms of thickness, surface slopes and apparent characteristics. Peat thickness varies from zero to 3.5 m in the Development Site. Accumulations of peat less than 0.5 m thick are considered to be too thin to be classified as true peat deposits and are often classified as organic soils or peaty soils. The peat thickness was examined by review of the probe information from the investigation and is discussed below.
The peat thickness at each location was recorded and the data used to draw the interpreted peat thickness map, presented as Drawing No4. The colour scale was selected to aid the identification of areas of similar peat thickness.
Despite the concerns expressed in Section 3.1.1 regarding the determination and assessment of shear strength of peat, there is merit in having a standard strength descriptor that is recognisable by geotechnical engineers, providing that they understand the limitations attached to the implied strength. For the purposes of this investigation, the undrained shear strength descriptors from the Eurocode 711
The shear strength of the peat was assessed, from inspection of natural exposures and recovered samples, to be in the range very soft to firm (<10-45 kPa).
(EC7) have been adopted.
The strength of the peat in the upper acrotelm is significantly influenced by the root and fibres that are abundant in this layer. As noted previously, there are many influences on the stability of the peat and observing or measuring high shear strength should not be used to assume a high degree of stability.
The probing investigation identified the following profiles within the peat:
• Soft to firm from surface to base of peat;
• Relatively firmer, vegetative root system at surface to approximately 50 cm, underlain
by slightly softer, partially waterlogged peat to base, and
• Vegetation still present to base of peat and clearly identifiable.
Peat has been described using the von Post6 Classification throughout this document which
is briefly summarised in Table 5-1 below:
11
BS EN ISO 14688-1:2002 Eurocode 7 – Geotechnical Investigation and Testing – Identification and classification of soil.
Table 5-1
von Post Classification for Peat Humification Degree of
humification Decomposition Plant structure
Content of amorphous material Material extruded on squeezing Nature of residue H1 None Easily identified None
Clear, colourless water H2 Insignificant Easily identified None Yellowish water
H3 Very slight Still identifiable Slight
Brown, muddy
water; no peat Not pasty H4 Slight Not easily identifiable Some Dark brown, muddy water; no peat Somewhat pasty H5 Moderate Recognisable but vague Considerable
Muddy water and
some peat Strongly pasty H6 Moderately strong Indistinct (more distinct after squeezing) Considerable About ⅓ peat squeezed out; water dark brown
Fibres and roots more resistant to decomposition H7 Strong Faintly recognisable High About ½ peat squeezed out; any
water very dark brown H8 Very strong Very indistinct High
About ⅔ peat squeezed out; also
some pasty water H9 Nearly complete
Almost unrecognisable
Nearly all the peat squeezed out as a
uniform paste H10 Complete Not discernible
All the peat passes between the fingers; no free
water visible
The water content of the peat is estimated on a scale from 1 (dry) to 5 (very high), designated as B1 to B5 and is often used in combination with the van Post classification to
characterise peat.
As a general guide, the following limits have been applied:
Table 5-2 Water Content* B1 dry B2 <500% B3 500-1000% B4 1000-2000% B5 >2000%
* Water content in mineral soils (%) is routinely expressed as the mass of water lost on drying to the oven-dry mass of the soil.
Based on field descriptions most of the peat would be classified as between H3 and H4 in the
von Post classification, showing slight decomposition with some amorphous material.
5.2 Substrate
From the evidence of the probing and sampling where available, the substrate falls into one of two principal categories:
2. Rock, no rock samples were recovered from the probe locations. The bedding dip and discontinuity spacing could not be determined at this stage. This material should be subject to further investigation for the detail design of the turbine foundations. No clay horizons were encountered and evidence from the site walkovers did not encounter clay type soils on site.
5.3 Description of Ground Conditions at Turbine Locations
The following tables outline the ground conditions found at each turbine location, characterising the general site conditions slope and peat classification.
Turbine Coordinates
Eastings Northings
Turbine T 1 390000 422644
Typical peat depth: 1.20m peat over granular material Peat conditions: Thin peat, fibrous H3/4
Evidence of instability: None, location has a moderate slope (4-80)
Watercourses: Nearest main water course 100 metres from turbine location Notes: Positioned in area of medium risk due to inclination of the slope.
Considered to be peaty topsoil rather than a true peat deposit.
Turbine T 2 390381 422643
Typical peat depth: 1.30 m peat over rock Peat conditions: Thin peat, fibrous H3/4
Evidence of instability: None, turbine position on relatively flat ground (<20) Watercourses: Nearest main water course 75 metres from turbine location
Notes: Low risk due to relatively flat terrain. Gradient very steep to west and east of turbine location and should not affect the proposed turbine location.
Turbine T 3 390596 422442
Typical peat depth: 0.7 m peat over rock. Peat conditions: Thin peat, fibrous H3/4
Evidence of instability: None, turbine position on relatively flat ground (<20)
Watercourses: Nearest main water course 120 metres from turbine location
Notes: No risk due to relatively thin peat on a flatter gradient. Steep gradient to east of turbine location.
Turbine T 4 390677 422167
Typical peat depth: Up to 3.0 m peat over rock Peat conditions: Thick peat, fibrous H3/4
Evidence of instability: None, site on relatively flat ground (2-40)
Watercourses: Nearest main water course 75 metres from turbine location
Notes: Micro-siting should be considered to position the turbine on the thinner peat to the east.
Turbine T 5 391078 422255
Typical peat depth: 0.7 m over bedrock Peat conditions: Thin peat, fibrous H3/4
Evidence of instability: None, site moderate slope (4-80)
Watercourses: Nearest main water course 125 metres from turbine location
Notes: Position located in on moderate slope, consider moving (within the micro-siting allowance) to a slightly shallower slope to north west.
6.0 RISK AND HAZARD ASSESSMENT
The method of risk and hazard assessment has been developed with reference to the Guidance. Key factors which may have an effect on the stability of the peat deposits have been identified leading to an assessment of the RISK of instability. The potential impact of any instability, the Hazard, was then considered for identified potential receptors. Scores were attributed to the key factors that have the greatest influence on peat stability. Risk scores were determined, which, when combined with an assessment of vulnerability of potential targets, were developed into an assessment of the Hazard.
In order to differentiate between risk and hazard, the following nomenclature has been adopted, based on the Guidance.
Table 6-1
Risk and Hazard Nomenclature
Risk Hazard
Negligible Insignificant
Low Significant
Medium Substantial
High Serious
This section outlines the approach taken and the scores allocated for various factors relevant to peat stability.
At this stage in the development of the proposed wind farm, the objective is to determine those peat areas that will have an effect on the wind farm and to set out the mitigation that could be adopted and incorporated into the overall design to ensure that due cognizance is taken in this regard.
The level of stability of a slope is normally assessed by reference to the factor of safety which is expressed, numerically, as the degree of confidence that exists, for a given set of conditions, against a particular failure mechanism occurring. It is commonly expressed as the ratio of the load or action which would cause failure against the actual load or actions likely to be applied during service. This is readily determined for some types of analysis (e.g. limit equilibrium slope stability analyses). The following sections present a brief discussion on some of the issues relating to stability and risk assessment.
6.1 Risk Score Development
The stability of peat is a complex subject and there are numerous inter-relationships that affect the stability.
A quantitative assessment requires a numerical input and such an analysis cannot account for the unquantifiable input required for a comprehensive peat stability assessment. For this reason a purely quantitative assessment should only be considered as a guide and a qualitative assessment of stability should be used to inform the final recommendations.
The characteristics of the peat failure phenomena described in Section 3.3 have been incorporated in a stability risk assessment to evaluate the risk of instability occurring within the peat areas. The main factors controlling the stability of the peat mass are the surface gradients, the depth and condition of the peat at each location and the type of substrate. The natural moisture content and undrained shear strength of the peat are important; however, it is generally accepted that where present, the peat will be saturated and have a very low strength. It is believed to be unrealistic to rely on specific values of shear strength to maintain stability when back analysis of failed slopes indicates that there is often a significant discrepancy between measured strength in peat and stability. Therefore shear strength has been assumed to be constant and worst case, throughout this assessment. It has also been assumed, as a worst case, that the groundwater level is coincident with the ground surface.
The key factors identified as being critical to stability and the development of a risk rating system are:
• A – Slope gradient;
• B – Peat thickness;
• C – Substrate type or condition; and
• D – Historic instability.
The risk scores are multiplied together to generate a risk rating which is a measure of the likelihood of peat instability.
6.1.1 Slope Gradients
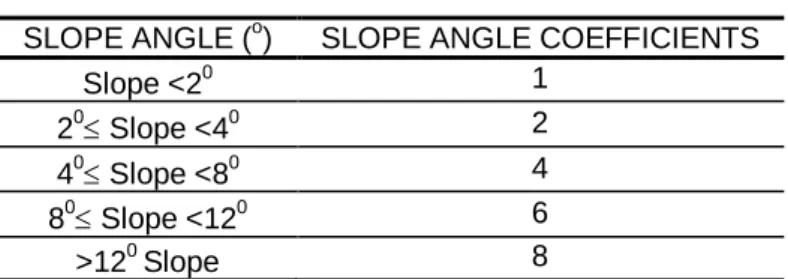
The slope gradients were assessed by reference to the mapping and particularly the Digital Terrain Model which was used to generate a gradient map (Drawing No.3), from which the gradient at each probe location could be determined. The gradient quoted at each location was based on the average gradient over a 5 m grid. Significant effort has gone into reducing slopes along routes and at turbine bases, it is evident from the Slope Plan that the majority of the tracks and turbines are on areas with flatter gradients (<80).
Table 6-2 presents the slope angle coefficients.
Table 6-2
Coefficients for Slope Gradients
SLOPE ANGLE (o) SLOPE ANGLE COEFFICIENTS
Slope <20 1
20≤ Slope <40 2
40≤ Slope <80 4
80≤ Slope <120 6
>120 Slope 8
Coefficients for slope gradient have been assigned to ensure the potential for both peat slides (gradients of 4-150) and bog slides (gradients of 2-100) are addressed.
By simple inspection it is clear that steeper slopes pose a greater risk of instability than shallow gradients. Therefore a graduated gradient scale from 00 to >120 (the practical maximum gradient on which peat is commonly observed) has been applied.
Note that the coefficients relate to the surface gradient of the peat; this should not be confused with the surface gradient of the substrate which could, and probably would, be different. At this stage we are not in a position to comment or address the issue of substrate gradient which will also have an effect on the potential peat stability.
6.1.2 Peat Thickness and Ground Conditions
The ground conditions were assessed by peat depths recorded during peat probing. Thin peat was classed as being 0.5 m to 1.5 m thick, with deposits in excess of this being classed as thick. The thickness ranges used are intended to reflect the risk of instability associated with both peat slides (in thin peat) and bog slides. Where the probing recorded peat less than 0.5m thick, this has been considered to be an organic soil rather than peat. Table 6-3 below, gives the coefficients applied to the various ground conditions.
In addition to peat thickness, the presence of existing landslip debris or indicators of meta-stable conditions such as tension cracks or slumping in the peat suggest the material is likely to become even less stable should the existing ground conditions change. Where evidence of historical slips, collapses, creep or flow is seen, a separate coefficient has been applied.
Table 6-3
Coefficients for Peat Thickness and ground conditions
GROUND CONDITIONS GROUND CONDITION COEFFICIENTS
Peaty or organic soil (<0.5 m) 1
Thin Peat (0.5 – 1.5 m) 2
Thick Peat (>1.5 m) 3*
Slips /collapses / creep / flows 8
* - Note that thicker peat generally occurs in areas of shallow gradient and records indicate that thick peat does not generally occur on the steeper gradients.
Based on the site reconnaissance, evidence of historic instability is sparse. The interpolated peat thickness is presented in Drawing No 4.
6.1.3 Substrate
As noted above, most failures in thin peat layers occur at the interface with the underlying substrate; the nature of the substrate could have a significant influence on the probable level of stability2.
Where sand and/or gravel (derived from glacial till or weathered rock) forms the substrate, the effective strength of the interface can be considered to be good with comparatively high friction values. Under these conditions, failure is likely to occur in a zone within the peat, just above the interface. Further factors are necessary to cause a failure of this nature (increased pore pressures within the peat) and occurrence of such events is rare.
Where clay forms the interface, there is likely to be a significant zone of softening in the clay (due to saturation at low normal stresses, poor or none existent vertical drainage and the effect of organic acids), resulting in either very low undrained shear strength or low effective shear strength parameters. The result is that potential shearing could occur either in the peat, on the interface or in the clay; all three possibilities have been documented in the past.
A rock substrate provides a high strength stratum, however, the rock surface can be smooth, and, depending on the dip orientation of the strata, it can provide a weak interface. For these reasons, at this stage, a rock interface has been given the same risk rating as clay.
Table 6-4
Coefficients for Substrate
SUBSTRATE CONDITIONS SUBSTRATE COEFFICIENTS
Sand/gravel 1 Clay 2 Rock 2 Not proven 3 Slip material (Existing materials) 5
If the overall thickness of the peat had not been proven, the risk associated with the significant thickness and the unknown substrate would have been given a higher rating to accommodate the unknown factors. However, in the case of the Development this is not relevant as the total thickness of peat was always proven.
6.1.4 Risk Rating
The risk rating coefficient was derived by multiplying the coefficients for slope angle / gradient, peat thickness, and the ground / substrate conditions together which highlights possible areas of concern.
For the stability risk assessment, the following Potential Stability Risk classes were applied:
Table 6-5 Risk Rating RISK RATING COEFFICIENT POTENTIAL STABILITY RISK (PRE-MITIGATION) ACTION
<5 NEGLIGIBLE No mitigation action required although slide management and monitoring shall be employed.
Slide management shall include the development of a site specific construction and management plan for peat areas which will detail the requirements for inspections and recording of instrumentation.
5 - <15 LOW As for negligible condition plus
Further investigation to refine the assessment combined with detailed quantitative risk assessment to determine appropriate mitigation to reduce the risk.
15 - <31 MEDIUM As for Low condition plus
Develop long term site monitoring regime.
>31 HIGH Unacceptable level of risk, the area should be avoided. If unavoidable, detailed investigation and quantitative assessment required to determine stability and sensitivity to minor changes in strength and groundwater regime combined with long term monitoring.
The rating system outlined above differs slightly from that proposed in the Guidance as the system adopted here incorporates three inputs compared to two in the guidance, with the potential impact of substrate added in this section.
Drawing No5 presents the interpreted risk of peat instability based on the multiplication of the coefficients discussed and using the limiting criteria in Table 6-5. Risk of peat instability is shown across all areas of the development. The Stability Risk Rating for each turbine is summarised below in Table 6-6, the interpretation is based on site specific data located closest to each turbine location.
Table 6-6
Stability Risk Rating for each turbine location
TURBINE NO
STABILITY RISK
RATING COMMENTS
1 Medium Turbine position acceptable, moderate slope, thin peat.
2 Low Turbine position acceptable
3 Negligible Turbine position acceptable
4 Low Turbine position acceptable
5 Low Turbine position acceptable
As can be seen from the table, four of the turbine positions fall within the ‘negligible’ or ‘low’ risk classification with only one turbine, influenced by steeper slopes, being classified within a medium risk area.
The majority of the proposed site access track also falls within the ‘negligible’ or ‘low’ classification; however, there are sections of the track, where the risk of instability has been classed as ‘medium’ and as such warrant further consideration.
6.2 Hazard Score Development
Following assessment of the risk of peat instability within a particular area, a further assessment of the likely impacts of a failure is necessary. It should be noted that the impact assessment is primarily concerned with impacts that affect the environmental, ecological, public or existing infrastructure not associated with the Development, both on site and potentially off-site. These assessments do not consider the detailed ecological impact of construction induced peat instability; however, the majority of the on-site receptors are the watercourses and thus the inferred ecological and environmental issues are addressed. The proposed mitigation measures will limit the potential for any slope failures into water courses and drainage features hence limit such impacts.
The effect of failure on the construction site and infrastructure can be easily identified and remediation is likely to be straight forward with quantifiable cost. However the effect of an instability event due to construction on features not associated with the Development is harder to predict.
In order to address this effect it is not considered appropriate to assess the effect at every potential vulnerable location close to a site; but rather to assess the effect a particular construction feature (track, turbine, control room, etc) will have on the structures or features surrounding it. By adopting such an approach the assessment of features where a risk ranking of ‘negligible’ or ‘low’ (assessed in the stability risk assessments described above) is discounted at an early stage.
6.2.1 Feature Ranking
Once features with a ‘medium’ or higher risk rating for instability have been identified it is then necessary to identify potential impact receptors. These are nearby structures or features that may be affected by peat movements caused during or following construction. Generally, only receptors down gradient of the construction feature would be affected by peat instability therefore the first phase of feature ranking requires topographic ridges and valleys to be identified across the site and surrounding area. From this, receptors at risk from particular features can be identified. However, should instability occur on a steep slope, there is the risk of the back scarp of the instability migrating up-slope, there-by affecting areas previously considered to be not at risk.
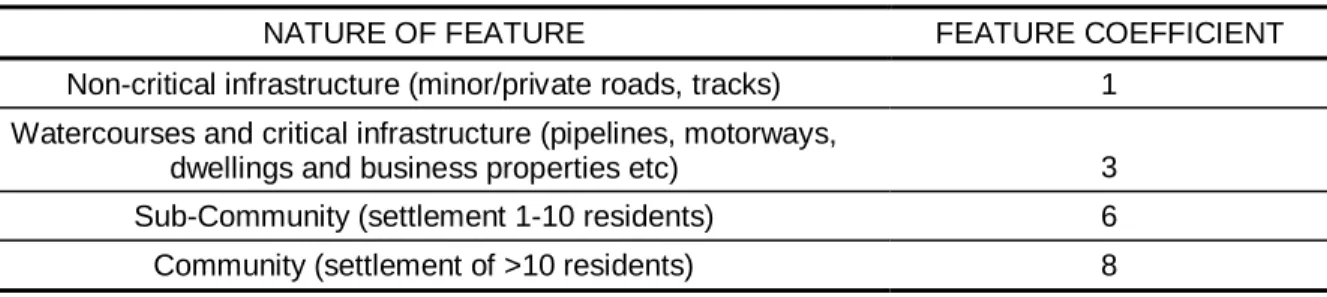
Following identification of receptors at risk, features are ranked according to their size and a relative assessment of likely cost of repair or reconstruction.
Table 6-7, below, presents the coefficients placed on particular receptor types.
Table 6-7
Coefficients for Impact Feature Ranking
NATURE OF FEATURE FEATURE COEFFICIENT
Non-critical infrastructure (minor/private roads, tracks) 1 Watercourses and critical infrastructure (pipelines, motorways,
dwellings and business properties etc) 3
Sub-Community (settlement 1-10 residents) 6
6.2.2 Feature Proximity
The proximity of an impact receptor is also critical in assessing the likely level of disruption it may suffer following an instability event. Based on this, two further coefficients – distance from construction feature and relative elevation - are applied in deriving an impact ranking. Table 6-8 and Table 6-9, below, present the coefficients derived for distance and elevation of impact features.
Table 6-8
Coefficients for Impact Feature Distance
DISTANCE FROM CONSTRUCTION FEATURE DISTANCE COEFFICIENT
>1 km 1
100 m-1 km 2
10-100 m 3
0-10 m 4
Table 6-9
Coefficients for Impact Feature Elevation
RELATIVE ELEVATION OF FEATURE ELEVATION COEFFICIENT
0-10 m 1
10-50 m 2
50-100 m 3
>100 m 4
6.2.3 Impact Rating
The impact rating coefficient is derived by multiplying the feature ranking coefficient by the distance coefficient and the elevation coefficient for each impact receptor associated with a particular construction feature. Based on the results of this assessment the following Potential Impact classes are applied and are based on the Guidance to determine the likelihood of an event occurring (high impact) or not (low impact).
Table 6-10 Impact Rating IMPACT RATING COEFFICIENT POTENTIAL IMPACT (PRE-MITIGATION)
EXPECTED IMPACT OF INSTABILITY EVENT
<10 VERY LOW
IMPACT
Little or no effect on surrounding features due to an instability event.
11 - 20 LOW
IMPACT Effect will be minimal – remediation costs low minimal disruption to on- and off-site activities.
21 - 50 HIGH
IMPACT
An instability event has the potential to cause damage or disruption resulting in remediation costs that are significant – 10-100% of total project budget.
>51 VERY HIGH
IMPACT
Major effect caused by an instability event. Extensive disruption to off-site activities with remediation costs in excess of the total budget of the project.
6.3 Hazard Ranking
The Guidance recommends that the hazard ranking is assessed using the following formula: Hazard Ranking = Hazard x Exposure
This philosophy can be applied to the assessment carried out so far in the following approach:
Hazard Ranking = Risk Rating x Impact Rating
In order to achieve a meaningful, and manageable result from the hazard ranking the results of the Stability Risk Assessment and Impact Assessment have been normalised to a standard numerical scale (Table 6-11, below).
Table 6-11 Rating Normalisation
RISK RATING IMPACT RATING
Current Scale Normalised
Scale Current Scale
Normalised Scale
Negligible <5 1 Very Low <10 1
Low 5 - <15 2 Low 11 - 20 2
Medium <15 - 30 3 High 21 - 30 3
High 31 - 50 4 Very High 31-50 4
Very High >51 5 Extremely High >51 5
The method of assessing risk, impact and hazard developed by SLR Consulting incorporates additional critical elements such as the substrate interface and coefficients for the receptor position, distance and elevation and as such is considered to be more rigorous than the assessment scheme proposed by the Guidance. Whilst the scales used in SLR method deviate from the Guidance (with risk and impact rating scales from 1-4 rather than 1-5), the ultimate Hazard Ranking scale does equate to the scale in the Guidance, with hazard rankings divided over four hazard ranking zones.
A simple multiplication of these coefficients would result in potentially large and unwieldy risk and impact rating numbers. We have therefore opted to normalise these values to bring them in line with the values used in the Guidance, as illustrated in Table 6-11 above.
Table 6-12 Hazard Ranking
HAZARD RANKING
HAZARD
RANKING ZONE ACTION
1-4 INSIGNIFICANT
No mitigation action required although slide management and monitoring shall be employed.
Slide management shall include the development of a site specific construction plan for peat areas.
5 - 10 SIGNIFICANT
As for Insignificant condition plus
Further investigation to refine the assessment combined with detailed quantitative risk assessment to determine appropriate mitigation through relocation or re-design.
11 - 16 SUBSTANTIAL Consideration of avoiding project development in these areas should be made unless hazard mitigation can be put in place
HAZARD RANKING
HAZARD
RANKING ZONE ACTION
without significant environmental effect.
17-25 SERIOUS Unacceptable level of hazard; development within the area should be avoided.
6.4 Results
The stability risk assessment has demonstrated that the majority of the Development Site lies within an area of negligible to low risk with regards to stability based on Drawing No.5. Those areas that have been identified as being at Medium risk of instability have been considered in a hazard impact assessment.
There are no communities of any description within the Development Site. There are a number of properties within 1km of the Development Site, to the north; however, these properties are on the opposite side of a valley and it is therefore unrealistic that these properties would be affected by any peat instability caused by the Development. The tributaries and Midgelden Brook are located close to the northern boundary of the Development Site.
A network of power lines and associated pylons run to the east and north of the Development Site. It should be noted that the power lines are located to the north of Midgelden Bank Hill which is not due to be developed and therefore it is not feasible for the power lines in this area to be affected by the Development. However, the power lines which are orientated approximately north-south, to the east of the development could potentially be affected by the Development, should a peat slide occur during or post-construction which migrated outside the site boundary in this area. The principal effects would be damage to the integrity of the foundations for the pylons. Additionally a number of public access rights of way (footpaths and bridleways) are present close to the boundary of the Development Site and are linked with the public access routes passing through the Development Site. An area of common land close to Counting Hill is located between the two areas of land which make up the Development site boundary.
Within the site with there is a maximum change of 40m between turbine elevations, although local height differences between the various items of infrastructure and possible on-site receptors are typically less than 25m. The proposed infrastructure within the site is limited to:
• The five wind turbines;
• Access tracks, heavy lift pads and cable routes;
• The electrical control building; and
• The two construction compounds (temporary) and the control room (not significantly
influenced by peat).
Local receptors include Weather Hill Gulf and its tributaries which all flow into Gorpley reservoir. The reservoir is not currently designated as a drinking water supply and it is unlikely to change its use in the future, although it cannot be ruled out that it may one day be used for public water supply. There are no other receptors in this part of the site.
The stability risk assessment results are presented in Table 6-12 in a tabulated format, and the probable risk potential. Tabl