Politecnico di Torino
Porto Institutional Repository
[Article] Operational performance of an Air Handling Unit: insights from a
data analysis
Original Citation:
Noussan, Michel; Carioni, Giovanni; Degiorgis, Luca; Jarre, Matteo; Tronville, Paolo Maria (2017).
Operational performance of an Air Handling Unit: insights from a data analysis.
In:
ENERGY
PROCEDIA
, vol. 134, pp. 386-393. - ISSN 1876-6102
Availability:
This version is available at :
http://porto.polito.it/2687175/
since: October 2017
Publisher:
Elsevier
Published version:
DOI:
10.1016/j.egypro.2017.09.579
Terms of use:
This article is made available under terms and conditions applicable to Open Access Policy Article
("Creative Commons: Attribution-Noncommercial-No Derivative Works 3.0") , as described at
http:
//porto.polito.it/terms_and_conditions.html
Porto, the institutional repository of the Politecnico di Torino, is provided by the University Library
and the IT-Services. The aim is to enable open access to all the world. Please
share with us
how
this access benefits you. Your story matters.
ScienceDirect
Available online at www.sciencedirect.com
Energy Procedia 134 (2017) 386–393
1876-6102 © 2017 The Authors. Published by Elsevier Ltd. Peer-review under responsibility of KES International. 10.1016/j.egypro.2017.09.579
10.1016/j.egypro.2017.09.579 1876-6102
Available online at www.sciencedirect.com
Energy Procedia 00 (2017) 000–000
www.elsevier.com/locate/procedia
9th International Conference on Sustainability in Energy and Buildings, SEB-17, 5-7 July 2017,
Chania, GREECE
Operational performance of an Air Handling Unit: insights from a
data analysis
Michel Noussan
a,∗, Giovanni Carioni
b, Luca Degiorgis
a, Matteo Jarre
a, Paolo Tronville
a aPolitecnico di Torino, Department of Energy, c.so Duca degli Abruzzi 24, 10129 Torino, ItalybPolitecnico di Torino, Living Lab, c.so Duca degli Abruzzi 24, 10129 Torino, Italy
Abstract
Space heating and cooling is one of the most relevant causes of energy consumption in both residential and tertiary sector buildings. In particular, service buildings and offices are mostly served by all-air HVAC systems in which control logics are fundamental to
guarantee reliability and performance. Building automation systems are therefore becoming more and more relevant as a support tool for reducing the energy consumption in these contexts. For this reason, the detailed analysis of operational data from real units can help in understanding the main variables that affect the performance and functioning of all-air systems. This paper presents
some results from operation data analysis of an Air Handling Unit (AHU) serving a large university classroom. The main drivers of the energy consumption are highlighted, and the classroom occupancy is found to have a significant importance in the energy balance of the system. The availability of historical operation data allows performing a comparison between the actual operation of the AHU and the expected performance from nominal parameters. An example of fault detection is proposed, considering the operation analysis of the heat recovery unit over different years.
©2017 The Authors. Published by Elsevier Ltd. Peer-review under responsibility of KES International.
Keywords: Air Handling Unit, Heating, Energy Performance, Operation Analysis
1. Introduction
This paper presents the operational analysis of the performance of an AHU heating and cooling a large classroom in a university. Another point to be considered is the variable internal heat gain generated by the students, which can provide in some cases the heat required by the classroom in winter and become a significant challenge in the cooling season. The variable occupancy of the space can be an issue in a number of other applications, such as theaters, restaurants, cinemas, etc.
In addition, the paper considers some possible improvements to the current operation of the AHU, in order to perform a preliminary evaluation of the potential energy savings.
∗Corresponding author. Tel.:+39-011-090-4529. E-mail address:[email protected]
1876-6102©2017 The Authors. Published by Elsevier Ltd. Peer-review under responsibility of KES International.
2 M. Noussan et al./Energy Procedia 00 (2017) 000–000
2. Energy monitoring of HVAC systems
Data analysis techniques can provide a significant support in the operational optimization of HVAC systems, both for fault detection and diagnosis and for reduction of energy consumption. In particular, Air Handling Units (AHU) represent a significant share of the HVAC systems of the service sector (offices, schools, commercial buildings). The operation of AHUs shows common problems and solutions, and therefore any methodology could be extended to similar applications.
The combination of knowledge and information from monitoring data is the base for an effective operational opti-mization [1]. Data driven methodologies described in the literature are mainly used for fault detection and diagnosis [2,3] and for optimization of the operation parameters, aiming at reducing energy consumption [4,5]. Along with the evolvement of energy-efficient HVAC in commercial buildings, the use of fault detection and diagnosis in HVAC fields has been increased continuously thanks to various computer-aided techniques with low-cost installation [6]. Some ap-plications have considered machine learning techniques [7] and neural networks [8], with the aim of developing a reliable, scalable, and affordable diagnostic solution for such systems.
3. Methodology
3.1. Description of the HVAC system
The Air Handling Unit considered in this study provides the air conditioning of a large classroom (volume of about 1,500 m3) with maximum occupancy of 400 students. The HVAC system has been working since 1991 and is used around 2,000 hours per year (8-19 Mon-Fri and 8-14 on Sat). The controlling system is based on the commercial building management system developed by Siemens for HVAC (DesigoTM). A general refurbishment of the classroom was carried out in the summer of 2015. The windows were replaced with new ones with higher insulation and an automated opening and closing system.
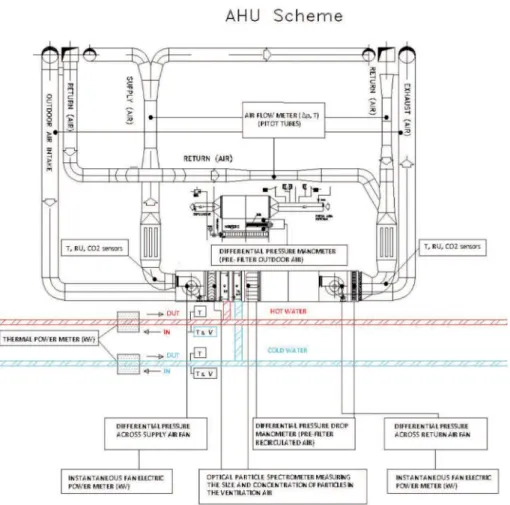
The HVAC system is an all air system supplying 10,000 m3/h and returning 8,000 m3/h, and 2,000 m3/h get lost for overpressure. The supply air fan has a nominal power of 5.5 kW and the return air fan has 2.2 kW of installed power. The fans are currently at fixed speed, with no inverter, and as a result the clogging of the air filters causes lower electricity consumption and air flow rate. The system can operate with 100% outdoor air, partial recirculation or total recirculation.
Some of the data available include: • Power draw for ventilation; • Fans pressure increase;
• Supply,return, outdoor and exhaust airflow rate;
• Indoor air quality (supply and return air):CO2, temperature, RH%; • Pressure drop across filters;
• Thermal power, separate for heating and cooling mode;
• Particle concentration upstream and downstream of the fine filter bank.
The particle concentration and pressure drops across filters have not been analyzed in this study.
A scheme of the HVAC system is shown in Figure 1, with its main components and the instrumentation available.
3.2. Data acquisition and processing
The data acquisition has been performed with a time interval of 15 minutes since the beginning of the monitoring project, mainly to provide data that is consistent with the measurement of power. The software for data acquisition in the first part of the project was a custom SCADA application written in Movicon (similar to VBasic) and the data was sent via MODBUS/TCP. In October 2015 this application has been substituted by a more simple and effective Perl script with a free command line tool to query Modbus devices (MODPOLL.EXE). Moreover, this script runs on a virtual machine in order to increase its reliability.
Michel Noussan et al. / Energy Procedia 134 (2017) 386–393 387 Available online at www.sciencedirect.com
Energy Procedia 00 (2017) 000–000
www.elsevier.com/locate/procedia
9th International Conference on Sustainability in Energy and Buildings, SEB-17, 5-7 July 2017,
Chania, GREECE
Operational performance of an Air Handling Unit: insights from a
data analysis
Michel Noussan
a,∗, Giovanni Carioni
b, Luca Degiorgis
a, Matteo Jarre
a, Paolo Tronville
a aPolitecnico di Torino, Department of Energy, c.so Duca degli Abruzzi 24, 10129 Torino, ItalybPolitecnico di Torino, Living Lab, c.so Duca degli Abruzzi 24, 10129 Torino, Italy
Abstract
Space heating and cooling is one of the most relevant causes of energy consumption in both residential and tertiary sector buildings. In particular, service buildings and offices are mostly served by all-air HVAC systems in which control logics are fundamental to
guarantee reliability and performance. Building automation systems are therefore becoming more and more relevant as a support tool for reducing the energy consumption in these contexts. For this reason, the detailed analysis of operational data from real units can help in understanding the main variables that affect the performance and functioning of all-air systems. This paper presents
some results from operation data analysis of an Air Handling Unit (AHU) serving a large university classroom. The main drivers of the energy consumption are highlighted, and the classroom occupancy is found to have a significant importance in the energy balance of the system. The availability of historical operation data allows performing a comparison between the actual operation of the AHU and the expected performance from nominal parameters. An example of fault detection is proposed, considering the operation analysis of the heat recovery unit over different years.
©2017 The Authors. Published by Elsevier Ltd. Peer-review under responsibility of KES International.
Keywords: Air Handling Unit, Heating, Energy Performance, Operation Analysis
1. Introduction
This paper presents the operational analysis of the performance of an AHU heating and cooling a large classroom in a university. Another point to be considered is the variable internal heat gain generated by the students, which can provide in some cases the heat required by the classroom in winter and become a significant challenge in the cooling season. The variable occupancy of the space can be an issue in a number of other applications, such as theaters, restaurants, cinemas, etc.
In addition, the paper considers some possible improvements to the current operation of the AHU, in order to perform a preliminary evaluation of the potential energy savings.
∗ Corresponding author. Tel.:+39-011-090-4529. E-mail address:[email protected]
1876-6102©2017 The Authors. Published by Elsevier Ltd. Peer-review under responsibility of KES International.
2 M. Noussan et al./Energy Procedia 00 (2017) 000–000
2. Energy monitoring of HVAC systems
Data analysis techniques can provide a significant support in the operational optimization of HVAC systems, both for fault detection and diagnosis and for reduction of energy consumption. In particular, Air Handling Units (AHU) represent a significant share of the HVAC systems of the service sector (offices, schools, commercial buildings). The operation of AHUs shows common problems and solutions, and therefore any methodology could be extended to similar applications.
The combination of knowledge and information from monitoring data is the base for an effective operational opti-mization [1]. Data driven methodologies described in the literature are mainly used for fault detection and diagnosis [2,3] and for optimization of the operation parameters, aiming at reducing energy consumption [4,5]. Along with the evolvement of energy-efficient HVAC in commercial buildings, the use of fault detection and diagnosis in HVAC fields has been increased continuously thanks to various computer-aided techniques with low-cost installation [6]. Some ap-plications have considered machine learning techniques [7] and neural networks [8], with the aim of developing a reliable, scalable, and affordable diagnostic solution for such systems.
3. Methodology
3.1. Description of the HVAC system
The Air Handling Unit considered in this study provides the air conditioning of a large classroom (volume of about 1,500 m3) with maximum occupancy of 400 students. The HVAC system has been working since 1991 and is used around 2,000 hours per year (8-19 Mon-Fri and 8-14 on Sat). The controlling system is based on the commercial building management system developed by Siemens for HVAC (DesigoTM). A general refurbishment of the classroom was carried out in the summer of 2015. The windows were replaced with new ones with higher insulation and an automated opening and closing system.
The HVAC system is an all air system supplying 10,000 m3/h and returning 8,000 m3/h, and 2,000 m3/h get lost for overpressure. The supply air fan has a nominal power of 5.5 kW and the return air fan has 2.2 kW of installed power. The fans are currently at fixed speed, with no inverter, and as a result the clogging of the air filters causes lower electricity consumption and air flow rate. The system can operate with 100% outdoor air, partial recirculation or total recirculation.
Some of the data available include: • Power draw for ventilation; • Fans pressure increase;
• Supply,return, outdoor and exhaust airflow rate;
• Indoor air quality (supply and return air):CO2, temperature, RH%; • Pressure drop across filters;
• Thermal power, separate for heating and cooling mode;
• Particle concentration upstream and downstream of the fine filter bank.
The particle concentration and pressure drops across filters have not been analyzed in this study.
A scheme of the HVAC system is shown in Figure 1, with its main components and the instrumentation available.
3.2. Data acquisition and processing
The data acquisition has been performed with a time interval of 15 minutes since the beginning of the monitoring project, mainly to provide data that is consistent with the measurement of power. The software for data acquisition in the first part of the project was a custom SCADA application written in Movicon (similar to VBasic) and the data was sent via MODBUS/TCP. In October 2015 this application has been substituted by a more simple and effective Perl script with a free command line tool to query Modbus devices (MODPOLL.EXE). Moreover, this script runs on a virtual machine in order to increase its reliability.
388 M. Noussan et al.Michel Noussan et al. / Energy Procedia 134 (2017) 386–393
/Energy Procedia 00 (2017) 000–000 3
Fig. 1. Scheme of the Air Handling Unit and available measurements.
In the first implementation of the project, the data storage was one data point every 15 minutes, resulting in a poor solution from a statistical point of view. From October 2015, each 15-minutes data point is the average of 90 measurements (one every 10 seconds). Each data point is stored in a text file, and then written into a MS SQL Server 2012 relational database. The use of the intermediate text file allows for an additional backup if for some reason the DB cannot be reached.
Unfortunately, the data acquisition faced several difficulties, especially during the first years of operation. The main reason was the unreliability of the data acquisition process, that run on a physical computer and was subject to multiple failures. As a consequence, it is not possible to perform accurate comparisons by aggregating monthly or annual data. Instead, a comparison of the available daily values can provide useful insights on the system behavior and its variations on a daily and seasonal basis.
3.3. Performance analyses
The main goal of the performance analysis is an assessment of the AHU operation over time. Multiple activities have been performed on the available data, and some of the results are presented in this paper. The main topics discussed here are the following:
• Evolution of the energy consumption of the HVAC system over time;
• Main drivers of the heat consumption: outdoor temperature and classroom occupancy; • Operational analysis of the heat recovery unit.
4 M. Noussan et al./Energy Procedia 00 (2017) 000–000
In particular, the heat recovery unit is currently not operating as expected. The data analysis was used to analyze its past operation, and eventually automated algorithms will be used in the future for fault analysis allowing prompt interventions.
4. Results
4.1. Energy Consumption for Heating
A first analysis on energy consumption of the HVAC system was performed on the most recent available data, related to the heating season 2016/2017. These data were chosen for their better reliability. Only working days were considered (Monday to Friday) and the Christmas Holidays were excluded (from 23rdDecember to 8thJanuary).
Heat 11.2016 12.2016 1.2017 2.2017 3.2017 0 100 200 300 400 500 600
Daily Heat Consumption (kWh)
Electricity 11.2016 12.2016 1.2017 2.2017 3.2017 0 10 20 30 40 50 Daily Electr icity Consumption (kWh)
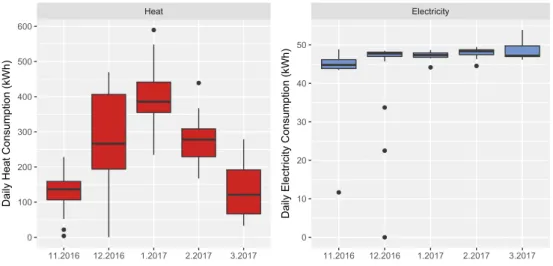
Fig. 2. Heat and Electricity daily consumption (Heating Season 2016-2017)
Figure 2 shows a boxplot of the daily Heat and Power consumption over the different months. The upper and lower ”hinges” correspond to the first and third quartiles (the 25thand 75thpercentiles), while the line in the middle represents the median. The upper whisker extends from the hinge to the highest value that is within 1.5 * IQR of the hinge, where IQR is the inter-quartile range, or distance between the first and third quartiles. The lower whisker extends from the hinge to the lowest value within 1.5 * IQR of the hinge. Data beyond the end of the whiskers are outliers and plotted as points. For more details see [9].
While energy usage remains in a very narrow range (from 45 kWh/day to 50 kWh/day), the heat consumption show considerable variations between and inside months. November and March show median values between 100 and 150 kWh/day, while during January the maximum values are higher than 500 kWh/day, but with a median consumption slightly under 400 kWh/day. The month of December shows a higher variability in heat consumption, probably related to particular weather conditions and utilization of the classroom.
Considering primary energy, the heat used by the university is supplied by a District Heating network, which operates with high efficiency CHP units. As a result, the primary energy factor of the heat is around 0.65, while the reference primary energy factor of the electricity from Italian power grid is 2.42. When converting final energy into primary energy, electricity becomes comparable to heat, and in some months even higher.
The main drivers of the heat consumption will be described in the following paragraphs.
4.2. Usage Profiles
In addition to daily energy usage, the availability of data with a narrow time step allows considering the daily energy profiles. Figure 3 shows the heat and electricity daily profiles in the last heating season. The system starts
Michel Noussan et al. / Energy Procedia 134 (2017) 386–393 389
M. Noussan et al./Energy Procedia 00 (2017) 000–000 3
Fig. 1. Scheme of the Air Handling Unit and available measurements.
In the first implementation of the project, the data storage was one data point every 15 minutes, resulting in a poor solution from a statistical point of view. From October 2015, each 15-minutes data point is the average of 90 measurements (one every 10 seconds). Each data point is stored in a text file, and then written into a MS SQL Server 2012 relational database. The use of the intermediate text file allows for an additional backup if for some reason the DB cannot be reached.
Unfortunately, the data acquisition faced several difficulties, especially during the first years of operation. The main reason was the unreliability of the data acquisition process, that run on a physical computer and was subject to multiple failures. As a consequence, it is not possible to perform accurate comparisons by aggregating monthly or annual data. Instead, a comparison of the available daily values can provide useful insights on the system behavior and its variations on a daily and seasonal basis.
3.3. Performance analyses
The main goal of the performance analysis is an assessment of the AHU operation over time. Multiple activities have been performed on the available data, and some of the results are presented in this paper. The main topics discussed here are the following:
• Evolution of the energy consumption of the HVAC system over time;
• Main drivers of the heat consumption: outdoor temperature and classroom occupancy; • Operational analysis of the heat recovery unit.
4 M. Noussan et al./Energy Procedia 00 (2017) 000–000
In particular, the heat recovery unit is currently not operating as expected. The data analysis was used to analyze its past operation, and eventually automated algorithms will be used in the future for fault analysis allowing prompt interventions.
4. Results
4.1. Energy Consumption for Heating
A first analysis on energy consumption of the HVAC system was performed on the most recent available data, related to the heating season 2016/2017. These data were chosen for their better reliability. Only working days were considered (Monday to Friday) and the Christmas Holidays were excluded (from 23rdDecember to 8thJanuary).
Heat 11.2016 12.2016 1.2017 2.2017 3.2017 0 100 200 300 400 500 600
Daily Heat Consumption (kWh)
Electricity 11.2016 12.2016 1.2017 2.2017 3.2017 0 10 20 30 40 50 Daily Electr icity Consumption (kWh)
Fig. 2. Heat and Electricity daily consumption (Heating Season 2016-2017)
Figure 2 shows a boxplot of the daily Heat and Power consumption over the different months. The upper and lower ”hinges” correspond to the first and third quartiles (the 25thand 75thpercentiles), while the line in the middle represents the median. The upper whisker extends from the hinge to the highest value that is within 1.5 * IQR of the hinge, where IQR is the inter-quartile range, or distance between the first and third quartiles. The lower whisker extends from the hinge to the lowest value within 1.5 * IQR of the hinge. Data beyond the end of the whiskers are outliers and plotted as points. For more details see [9].
While energy usage remains in a very narrow range (from 45 kWh/day to 50 kWh/day), the heat consumption show considerable variations between and inside months. November and March show median values between 100 and 150 kWh/day, while during January the maximum values are higher than 500 kWh/day, but with a median consumption slightly under 400 kWh/day. The month of December shows a higher variability in heat consumption, probably related to particular weather conditions and utilization of the classroom.
Considering primary energy, the heat used by the university is supplied by a District Heating network, which operates with high efficiency CHP units. As a result, the primary energy factor of the heat is around 0.65, while the reference primary energy factor of the electricity from Italian power grid is 2.42. When converting final energy into primary energy, electricity becomes comparable to heat, and in some months even higher.
The main drivers of the heat consumption will be described in the following paragraphs.
4.2. Usage Profiles
In addition to daily energy usage, the availability of data with a narrow time step allows considering the daily energy profiles. Figure 3 shows the heat and electricity daily profiles in the last heating season. The system starts
390 Michel Noussan et al. / Energy Procedia 134 (2017) 386–393
M. Noussan et al./Energy Procedia 00 (2017) 000–000 5
its operation at 7 AM in order to guarantee the required temperature at 8.30 AM, when the lectures begin. At 7 PM the heat consumption drops, while electricity consumption seems to drop slightly later. While the fans don’t show significant variations over the months, the heat consumption shows a noticeable increase from the mid-season months (November and March) to the winter months, being January the coldest (also due to significantly lower outdoor temperatures than in December or February). The peak power of the morning is mainly due to the need of heating up the classroom after the night (when the HVAC system is not operating), but the decrease of the heat consumption over the day is also related with generally higher outdoor temperatures in the central hours of the day. For the same reason in the evening a small increase of the heat consumption is noticeable. The classroom occupancy has a huge impact on the heat demand during the day, as the presence of internal heat gain produced by the students decreases the heating load. This effect will be highlighted in next paragraph discussing the energy signature.
Fig. 3. Average Heat and Electricity Consumption profiles of the HVAC System (Heating Season 2016-2017)
4.3. Energy Signatures
The main driver of the heat consumption in buildings is usually the outdoor temperature, which affects both the transmission and the ventilation thermal losses. For this reason, the energy signature methodology is usually applied to underline the linear relation between the outdoor-indoor temperature difference and the thermal energy usage [10]. The energy signature of the classroom is plotted in Figure 4, considering daily heat consumption during the heating season (November to March) from 2012.
The relation between heat demand and outdoor temperature is clear, but the scattering of the points suggests that other variables are involved. In particular, the internal heat gain provided by the students can have a significant impact. Each person is usually dissipating around 100 W to the environment when seated at rest [11,12]. As a consequence, when the classroom is full the internal heat released by the students is equal to the heat provided by the HVAC system. This aspect can have a strong influence on the energy signature, but there is no evidence at daily level, due to the high variations of classroom hours. However, Figure 5 shows a significant insight by considering 15-minutes data. The color scale represents theCO2concentration measured at the return air from the classroom, which is a good estimate of the number of students. It is clear from the plot that the higher the occupancy of the classroom, the lower the heat demand at a given temperature.
In Figure 5 it is more difficult to see linear correlations, due to the different operational settings during the day resulting in variable profiles (see Figure 3). For that reason usually energy signatures provide a better linearization on a daily, weekly or even monthly basis.
Other aspects that can have an impact on heat consumption are some operational settings of the HVAC system, such as the fraction of recirculated air or the use of the air heat recovery. The current data acquisition is not considering the position of the shutters, but the possibility of retrieving this information is currently under evaluation.
6 M. Noussan et al./Energy Procedia 00 (2017) 000–000
Fig. 4. Daily Energy Signature of the classroom
Fig. 5. Energy Signature of the classroom (15-minutes time step) and CO2 concentration levels (Years 2016 and 2017)
4.4. Operation analysis of the heat recovery unit
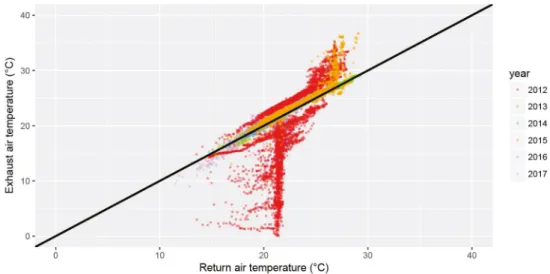
Another application of the operational data analysis is the possibility of detecting component failures. The AHU considered in this study is equipped with a heat recovery unit, which has been installed to recover part of the energy contained in the return air before being exhausted. The performance of this component can be analyzed by comparing the return air temperature and the exhaust air temperature. Figure 6 shows a plot of these two temperatures, by considering 15-minutes data from January 2012 to March 2017. The black line is the bisector, representing points with equals return and exhaust temperatures. The points aligned on the bisector represent therefore a failure of the heat recovery, as the exhaust air is at the same temperature of the return air from the classroom. Instead, the heat recovery unit should cause an increase of the exhaust temperature in summer (upper points of the right) and a decrease in winter (group of points lower than the bisector at around 21°C).
This Figure shows clearly that the heat recovery unit was out of order from 2013. While in 2012 a consistent number of points lays in the correct regions, in the following years the majority of the points seems to be aligned with the bisector, with some occasional exceptions. The cause of the recovery unit failure is still not clear, but its operation settings are currently being checked, in order to reset its operation and fix the problem. From some
Michel Noussan et al. / Energy Procedia 134 (2017) 386–393 391
M. Noussan et al./Energy Procedia 00 (2017) 000–000 5
its operation at 7 AM in order to guarantee the required temperature at 8.30 AM, when the lectures begin. At 7 PM the heat consumption drops, while electricity consumption seems to drop slightly later. While the fans don’t show significant variations over the months, the heat consumption shows a noticeable increase from the mid-season months (November and March) to the winter months, being January the coldest (also due to significantly lower outdoor temperatures than in December or February). The peak power of the morning is mainly due to the need of heating up the classroom after the night (when the HVAC system is not operating), but the decrease of the heat consumption over the day is also related with generally higher outdoor temperatures in the central hours of the day. For the same reason in the evening a small increase of the heat consumption is noticeable. The classroom occupancy has a huge impact on the heat demand during the day, as the presence of internal heat gain produced by the students decreases the heating load. This effect will be highlighted in next paragraph discussing the energy signature.
Fig. 3. Average Heat and Electricity Consumption profiles of the HVAC System (Heating Season 2016-2017)
4.3. Energy Signatures
The main driver of the heat consumption in buildings is usually the outdoor temperature, which affects both the transmission and the ventilation thermal losses. For this reason, the energy signature methodology is usually applied to underline the linear relation between the outdoor-indoor temperature difference and the thermal energy usage [10]. The energy signature of the classroom is plotted in Figure 4, considering daily heat consumption during the heating season (November to March) from 2012.
The relation between heat demand and outdoor temperature is clear, but the scattering of the points suggests that other variables are involved. In particular, the internal heat gain provided by the students can have a significant impact. Each person is usually dissipating around 100 W to the environment when seated at rest [11,12]. As a consequence, when the classroom is full the internal heat released by the students is equal to the heat provided by the HVAC system. This aspect can have a strong influence on the energy signature, but there is no evidence at daily level, due to the high variations of classroom hours. However, Figure 5 shows a significant insight by considering 15-minutes data. The color scale represents theCO2concentration measured at the return air from the classroom, which is a good estimate of the number of students. It is clear from the plot that the higher the occupancy of the classroom, the lower the heat demand at a given temperature.
In Figure 5 it is more difficult to see linear correlations, due to the different operational settings during the day resulting in variable profiles (see Figure 3). For that reason usually energy signatures provide a better linearization on a daily, weekly or even monthly basis.
Other aspects that can have an impact on heat consumption are some operational settings of the HVAC system, such as the fraction of recirculated air or the use of the air heat recovery. The current data acquisition is not considering the position of the shutters, but the possibility of retrieving this information is currently under evaluation.
6 M. Noussan et al./Energy Procedia 00 (2017) 000–000
Fig. 4. Daily Energy Signature of the classroom
Fig. 5. Energy Signature of the classroom (15-minutes time step) and CO2 concentration levels (Years 2016 and 2017)
4.4. Operation analysis of the heat recovery unit
Another application of the operational data analysis is the possibility of detecting component failures. The AHU considered in this study is equipped with a heat recovery unit, which has been installed to recover part of the energy contained in the return air before being exhausted. The performance of this component can be analyzed by comparing the return air temperature and the exhaust air temperature. Figure 6 shows a plot of these two temperatures, by considering 15-minutes data from January 2012 to March 2017. The black line is the bisector, representing points with equals return and exhaust temperatures. The points aligned on the bisector represent therefore a failure of the heat recovery, as the exhaust air is at the same temperature of the return air from the classroom. Instead, the heat recovery unit should cause an increase of the exhaust temperature in summer (upper points of the right) and a decrease in winter (group of points lower than the bisector at around 21°C).
This Figure shows clearly that the heat recovery unit was out of order from 2013. While in 2012 a consistent number of points lays in the correct regions, in the following years the majority of the points seems to be aligned with the bisector, with some occasional exceptions. The cause of the recovery unit failure is still not clear, but its operation settings are currently being checked, in order to reset its operation and fix the problem. From some
392 M. Noussan et al.Michel Noussan et al. / Energy Procedia 134 (2017) 386–393
/Energy Procedia 00 (2017) 000–000 7
Fig. 6. Operation analysis of the heat recovery unit (comparison between return and exhaust air temperature)
preliminary estimations the recoverable heat could lead to around 30% of heat savings in winter, but the effect on summer operation is expected to be much lower.
5. Discussion
The case study presented in this paper shows some results that confirm the importance of the energy monitoring in HVAC units. In particular, the comparison between the actual operation and the design settings can highlight some possible optimizations or discover eventual failures. The availability of operation data with a narrow time step over a significant range of time is crucial for the definition of a statistical base for the analysis.
The malfunction of the heat recovery unit has caused higher energy consumption for the heating of outdoor air. Heat recovery units have efficiencies that reach 70%-75%, and this would affect a share of the heat consumption. However, this component has an effect on ventilation losses, while transmission losses are not affected.
Another possible improvement is the substitution of the current fixed speed air fans, that are able to provide only the nominal air flow rate. The adoption of variable speed fans is a viable solution for the increase of the energy performance of the AHU. The use of variable air flow would also allow a better regulation of the system as a function of the effective occupancy of the classroom.
6. Conclusions
This paper presents some preliminary results of a data analysis performed on the operation of a AHU in a large university classroom. The main results are the following:
• The power consumption of the AHU is constant over the year, while the heating usage and the cooling usage show significant variations.
• The main driver of the heat variation appears to be the outdoor temperature, but the classroom occupancy has a critical impact in lowering the heat consumption when the classroom is full.
• The possibility of monitoring operational data allowed to find a failure in the heat recovery unit. The imple-mentation of an automated algorithm could lead to a prompter fault detection in the future.
This data analysis is at the base of the definition of some automated algorithms that can check on a live basis the performance of the unit and report operation problems or failures.
8 M. Noussan et al./Energy Procedia 00 (2017) 000–000
References
[1] Verbert, K., Babuˇska, R., Schutter, B.D.. Combining knowledge and historical data for system-level fault diagnosis of {HVAC} systems. Engineering Applications of Artificial Intelligence 2017;59:260 – 273. URL: http://www.sciencedirect.com/science/article/pii/S095219761630255X. doi:http://dx.doi.org/10.1016/j.engappai.2016.12.021.
[2] Yan, R., Ma, Z., Kokogiannakis, G., Zhao, Y.. A sensor fault detection strategy for air handling units using cluster analysis. Automation in Construction 2016;70:77 – 88. URL: http://www.sciencedirect.com/science/article/pii/S0926580516301261.
doi:http://dx.doi.org/10.1016/j.autcon.2016.06.005.
[3] Dey, D., Dong, B.. A probabilistic approach to diagnose faults of air handling units in buildings. Energy and Buildings 2016;130:177 – 187. URL: http://www.sciencedirect.com/science/article/pii/S0378778816306958. doi:http://dx.doi.org/10.1016/j.enbuild.2016.08.017.
[4] Kusiak, A., Zeng, Y., Xu, G.. Minimizing energy consumption of an air handling unit with a computational intelligence approach. Energy and Buildings 2013;60:355 – 363. URL: http://www.sciencedirect.com/science/article/pii/S0378778813000741.
doi:http://dx.doi.org/10.1016/j.enbuild.2013.02.006.
[5] Cetin, K.S., Kallus, C.. Data-driven methodology for energy and peak load reduction of residential {HVAC} sys-tems. Procedia Engineering 2016;145:852 – 859. URL: http://www.sciencedirect.com/science/article/pii/S1877705816302156.
doi:http://dx.doi.org/10.1016/j.proeng.2016.04.205;{ICSDEC}2016 – Integrating Data Science, Construction and Sustainability.
[6] Yu, Y., Woradechjumroen, D., Yu, D.. A review of fault detection and diagnosis methodologies on air-handling units. Energy and Buildings 2014;82:550 – 562. URL: http://www.sciencedirect.com/science/article/pii/S0378778814005246.
doi:https://doi.org/10.1016/j.enbuild.2014.06.042.
[7] Najafi, M., Auslander, D.M., Bartlett, P.L., Haves, P., Sohn, M.D.. Application of machine learning in the fault diagnostics of air handling units. Applied Energy 2012;96:347 – 358. URL: http://www.sciencedirect.com/science/article/pii/S0306261912001481.
doi:https://doi.org/10.1016/j.apenergy.2012.02.049; smart Grids.
[8] Du, Z., Fan, B., Chi, J., Jin, X.. Sensor fault detection and its efficiency analysis in air handling unit using the combined neu-ral networks. Energy and Buildings 2014;72:157 – 166. URL: http://www.sciencedirect.com/science/article/pii/S0378778813008554. doi:https://doi.org/10.1016/j.enbuild.2013.12.038.
[9] McGill, R., Tukey, J.W., Larsen, W.A.. Variations of box plots. The American Statistician 1978;32(1):12–16. URL: http://www.jstor.org/stable/2683468.
[10] Hammarsten, S.. A critical appraisal of energy-signature models. Applied Energy 1987;26(2):97–110. URL: https://ideas.repec.org/a/eee/appene/v26y1987i2p97-110.html.
[11] ANSI/ASHRAE standard 55-2013, thermal environmental conditions for human occupancy. 2013.
[12] ISO 7730:2005, ergonomics of the thermal environment – analytical determination and interpretation of thermal comfort using calculation of the pmv and ppd indices and local thermal comfort criteria. 2005.
Michel Noussan et al. / Energy Procedia 134 (2017) 386–393 393
M. Noussan et al./Energy Procedia 00 (2017) 000–000 7
Fig. 6. Operation analysis of the heat recovery unit (comparison between return and exhaust air temperature)
preliminary estimations the recoverable heat could lead to around 30% of heat savings in winter, but the effect on summer operation is expected to be much lower.
5. Discussion
The case study presented in this paper shows some results that confirm the importance of the energy monitoring in HVAC units. In particular, the comparison between the actual operation and the design settings can highlight some possible optimizations or discover eventual failures. The availability of operation data with a narrow time step over a significant range of time is crucial for the definition of a statistical base for the analysis.
The malfunction of the heat recovery unit has caused higher energy consumption for the heating of outdoor air. Heat recovery units have efficiencies that reach 70%-75%, and this would affect a share of the heat consumption. However, this component has an effect on ventilation losses, while transmission losses are not affected.
Another possible improvement is the substitution of the current fixed speed air fans, that are able to provide only the nominal air flow rate. The adoption of variable speed fans is a viable solution for the increase of the energy performance of the AHU. The use of variable air flow would also allow a better regulation of the system as a function of the effective occupancy of the classroom.
6. Conclusions
This paper presents some preliminary results of a data analysis performed on the operation of a AHU in a large university classroom. The main results are the following:
• The power consumption of the AHU is constant over the year, while the heating usage and the cooling usage show significant variations.
• The main driver of the heat variation appears to be the outdoor temperature, but the classroom occupancy has a critical impact in lowering the heat consumption when the classroom is full.
• The possibility of monitoring operational data allowed to find a failure in the heat recovery unit. The imple-mentation of an automated algorithm could lead to a prompter fault detection in the future.
This data analysis is at the base of the definition of some automated algorithms that can check on a live basis the performance of the unit and report operation problems or failures.
8 M. Noussan et al./Energy Procedia 00 (2017) 000–000
References
[1] Verbert, K., Babuˇska, R., Schutter, B.D.. Combining knowledge and historical data for system-level fault diagnosis of {HVAC} systems. Engineering Applications of Artificial Intelligence 2017;59:260 – 273. URL: http://www.sciencedirect.com/science/article/pii/S095219761630255X. doi:http://dx.doi.org/10.1016/j.engappai.2016.12.021.
[2] Yan, R., Ma, Z., Kokogiannakis, G., Zhao, Y.. A sensor fault detection strategy for air handling units using cluster analysis. Automation in Construction 2016;70:77 – 88. URL: http://www.sciencedirect.com/science/article/pii/S0926580516301261.
doi:http://dx.doi.org/10.1016/j.autcon.2016.06.005.
[3] Dey, D., Dong, B.. A probabilistic approach to diagnose faults of air handling units in buildings. Energy and Buildings 2016;130:177 – 187. URL: http://www.sciencedirect.com/science/article/pii/S0378778816306958. doi:http://dx.doi.org/10.1016/j.enbuild.2016.08.017.
[4] Kusiak, A., Zeng, Y., Xu, G.. Minimizing energy consumption of an air handling unit with a computational intelligence approach. Energy and Buildings 2013;60:355 – 363. URL: http://www.sciencedirect.com/science/article/pii/S0378778813000741.
doi:http://dx.doi.org/10.1016/j.enbuild.2013.02.006.
[5] Cetin, K.S., Kallus, C.. Data-driven methodology for energy and peak load reduction of residential {HVAC} sys-tems. Procedia Engineering 2016;145:852 – 859. URL: http://www.sciencedirect.com/science/article/pii/S1877705816302156.
doi:http://dx.doi.org/10.1016/j.proeng.2016.04.205;{ICSDEC}2016 – Integrating Data Science, Construction and Sustainability.
[6] Yu, Y., Woradechjumroen, D., Yu, D.. A review of fault detection and diagnosis methodologies on air-handling units. Energy and Buildings 2014;82:550 – 562. URL: http://www.sciencedirect.com/science/article/pii/S0378778814005246.
doi:https://doi.org/10.1016/j.enbuild.2014.06.042.
[7] Najafi, M., Auslander, D.M., Bartlett, P.L., Haves, P., Sohn, M.D.. Application of machine learning in the fault diagnostics of air handling units. Applied Energy 2012;96:347 – 358. URL: http://www.sciencedirect.com/science/article/pii/S0306261912001481.
doi:https://doi.org/10.1016/j.apenergy.2012.02.049; smart Grids.
[8] Du, Z., Fan, B., Chi, J., Jin, X.. Sensor fault detection and its efficiency analysis in air handling unit using the combined neu-ral networks. Energy and Buildings 2014;72:157 – 166. URL: http://www.sciencedirect.com/science/article/pii/S0378778813008554. doi:https://doi.org/10.1016/j.enbuild.2013.12.038.
[9] McGill, R., Tukey, J.W., Larsen, W.A.. Variations of box plots. The American Statistician 1978;32(1):12–16. URL: http://www.jstor.org/stable/2683468.
[10] Hammarsten, S.. A critical appraisal of energy-signature models. Applied Energy 1987;26(2):97–110. URL: https://ideas.repec.org/a/eee/appene/v26y1987i2p97-110.html.
[11] ANSI/ASHRAE standard 55-2013, thermal environmental conditions for human occupancy. 2013.
[12] ISO 7730:2005, ergonomics of the thermal environment – analytical determination and interpretation of thermal comfort using calculation of the pmv and ppd indices and local thermal comfort criteria. 2005.