ICT‐31‐2014: Human‐centric Digital Age
Project number: 645043
A typology, method and roadmap for HUman‐MAchine NEtworks
Analysis summary of HUMANE external
case study: eVACUATE #2
Editor(s) Vegard Engen and J. Brian Pickering Lead Partner University of Southampton, IT Innovation Centre Date 05/05/2017 Project Number H2020 – 645043 Project Title HUMANE
1
Overview
This case study was conducted in September to October 2016 with the purpose of providing an external validation of the HUMANE typology and method. This eVACUATE case‐study comprises four different engagements in order to ensure a comprehensive evaluation: a quantitative online survey on the HUMANE design patterns; a quantitative survey on the HUMANE typology used for characterising Human‐Machine Networks (HMNs); and two focus groups evaluating the HUMANE method (covering the profiling process, network diagramming, implication analysis, and design pattern approach). Four self‐selecting cohorts, identified on an opportunity sampling basis, took part in one or more of these exercises: 1. Project members from the eVACUATE project. Participants responded to both surveys; 2. Undergraduate students from the Faculty of Physical Science and Engineering at the University of Southampton. Participants responded to the survey on design patterns, and took part in a qualitative focus group to explore using the typology and methodology in connection with their own understanding of a human‐machine network of their choice;3. ICT professionals from the Research Software Engineering group in the UK (http://www.rse.ac.uk/). Participants responded to the same survey as cohort [2] above; and finally,
4. A group of professional software and ICT professionals at the IT Innovation Centre, University of Southampton with experience in a range of pan‐European collaborative projects working on HMNs. Participants took part in a similar focus group type qualitative study as cohort [2] above, which was based on a generalised eVACUATE HMN.
2
Methodological
approach
As noted above, this eVACUATE case‐study comprises four separate studies. There were a total of three instruments: two quantitative surveys, and a qualitative focus group. The latter was run twice with different cohorts as described above. Each instrument is covered in more detail in the sections below; all received ethical approval as detailed. The different studies sought to address the following research questions: RQ1: How useful would the typology be for software engineers working on HMNS? Quantitative Likert‐scale based online survey Professional softwareengineers and those in training
RQ2: How easy is the methodology for software engineers to characterise an HMN? Qualitative Focus group discussion based on known HMN Software engineering
undergraduates Qualitative Focus group discussion based on imposed HMN Professional software
RQ3: How acceptable are the design implications identified for the HUMANE case‐studies? Quantitative Likert‐scale based online survey Professional software
engineers and those in training
2.1
Study
1
and
2
–
quantitative
surveys
2.1.1
Research
protocols
For the quantitative (survey‐based) study, two questionnaires were developed based on the work carried out in WP2 and described in (Følstad et al., 2016). The surveys both used 4‐point Likert scales (Kostoulas, 2013; Matell & Jacoby, 1971) to establish participant agreement with the assertions made. As online surveys1, no personal data is collected automatically2, and as such they were anonymised at source. Participants were asked to agree to take part and confirm that they were not minors via a checkbox; failure to tick the box would prevent access to the survey questions. Descriptive statistics only are reported for the surveys (Dancey & Reidy, 2014). Survey 1 – human‐machine network characterisation As the approach to determining the values for the 8 dimensions of the HUMANE typology changed in version 2 of the typology and method, using a set of statements for each dimension as discussed in D2.2 (Følstad et al., 2016), this survey follows this approach. Each participant responds to each statement by stating a level of agreement using a 4‐point Likert scale, as noted above. In addition, for each layer, participants are invited to give feedback on the statements/dimensions. A final section seeks specific feedback on the perceived completeness of the typology and any general feedback. Survey 2 – design solutions for human‐machine networks On the basis of the implications identified in (Følstad et al., 2016), a set of 35 design solutions were proposed across five domains: Motivation and experience (9 solutions), Behaviour and collaboration (9 solutions), Innovation and improvement (7 solutions), Privacy and trust (8 solutions), and Underlying infrastructure (2 solutions). To a software engineering audience, these cannot be presented as design patterns as such, since the terms has specific connotations in the field (Gamma, Helm, Johnson, & Vlissides, 1994). For the purpose of this survey, each design solution was presented in the following way:
For this problem, this design solution is appropriate.
For example: To keep user‐generated content being submitted <the problem>, run regular campaigns to request it <the design solution>. Participants were asked to respond with: Strongly agree, Agree, Disagree or Strongly disagree (a 4‐point Likert scale) to indicate whether or not they agreed with the proposed design solution in response to the problem identified. In addition, they were given an
1 http://www.isurvey.soton.ac.uk
opportunity to provide additional information as free‐form text input. Since Likert response represent an ordinal scale, no parametric statistics were attempted on the results. However, below, we present descriptive statistics which tend to indicate that there is significantly greater agreement than disagreement amongst participants for the proposed design solutions.
2.1.2
Procedure
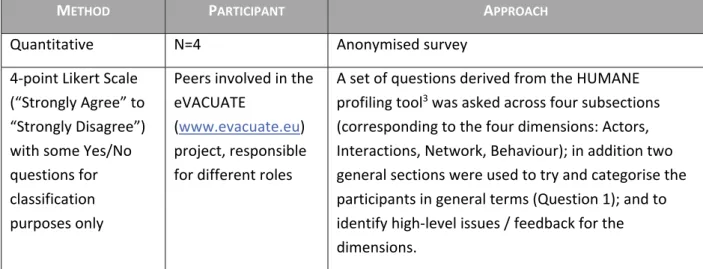
The procedure for the study 1 – survey on HMN characterisation, is detailed in the tables below. Table 1: Summary of the Quantitative Survey looking at HMN Characterisation
METHOD PARTICIPANT APPROACH
Quantitative N=4 Anonymised survey 4‐point Likert Scale (“Strongly Agree” to “Strongly Disagree”) with some Yes/No questions for classification purposes only Peers involved in the eVACUATE (www.evacuate.eu) project, responsible for different roles A set of questions derived from the HUMANE profiling tool3 was asked across four subsections (corresponding to the four dimensions: Actors, Interactions, Network, Behaviour); in addition two general sections were used to try and categorise the participants in general terms (Question 1); and to identify high‐level issues / feedback for the dimensions. Table 2: Summary of the Quantitative Survey looking at Design solutions for HMNs
METHOD PARTICIPANT APPROACH
Quantitative 10 ≤ N ≤ 18 Anonymised survey 4‐point Likert Scale (“Strongly Agree” to “Strongly Disagree”) with some Yes/No questions for classification purposes only Undergraduate students studying Computer Science; Professional software engineers working in research (http://rse.ac.uk) A set of assertions relating to the design solutions proposed in (Følstad et al., 2016) was formulated to establish how appropriate the solutions might be. SUMMARY RESULTS Agreement: Disagreement: TOTAL: 375 (82%) 84 (18%) 459 Responses 3 https://networkprofiler.humane2020.eu/
On average, respondents spent a little over 15m 23s to go through the survey; not all respondents answered all questions. Some ten to eighteen responses were received taken from the complete cohort of 18 participants. These included undergraduate computer science students as well as professional software engineers working in academia. As such, the cohort was felt to be reasonably representative of a population of computer scientists who might be assumed to understand as well as benefit from design solutions, i.e., they are perceived as domain experts.
Responses were simply summed, with the Strongly agree and Agree categories on the one hand, and the Disagree and Strongly disagree on the other being grouped into Agreement and Disagreement. For each category, the overall levels of agreement and disagreement were compared, along with any comments reviewed in order to establish whether or not the solutions were regarded as acceptable or not for the problems identified.
2.2
Study
3
and
4
–
qualitative
focus
groups
Two focus groups were conducted with different cohorts, but following the same research protocol.
2.2.1
Research
protocol
For the qualitative focus‐group‐based discussions, pseudonymised transcripts of the session recordings were made under a contractual obligation of confidentiality (European Commission, 2016). Participants were asked to sign consent forms after reviewing an overview of the study and an opportunity for ask any questions or request any clarification. They were made to understand that once transcripts had been pseudonymised, they would not be able to access, review, modify or withdraw any of their input. The transcripts were reviewed by participants, and once checked were used for qualitative analysis (Coolican, 2013). In the main, the aim was to establish any common ideas or discussion topics whilst going through the methodology with them; and, therefore, Thematic Analysis was used (Howitt, 2013). Although not the primary focus, it was felt useful to consider the reaction of participants to the domain as a whole: specifically, how do they feel about the problem of trying to understand, conceptualise and share information about networks. To this end, some individual comments have been summarised and presented in the final section of each study. For practical reasons, it was not possible to make use of completely independent coders to provide an initial encoding of the focus group transcript. Instead, and by way of compromise, two of the authors independently highlighted comments and observations which seemed to recur and therefore worth further investigation. To complement the quantitative surveys in the preceding sections, two focus groups were held to explore participants’ perceptions of HMNs that they were familiar with, and then take them through the HUMANE methodology to gauge the ease with which they could apply the methodology as well as understand how it may or may not benefit them in their work.
2.2.2
Procedure
Table 3 summarises the approach taken. Two cohorts were recruited: the first were students currently studying for a computer science degree in the Faculty of Physical Science and Engineering at Southampton; the second were colleagues from IT Innovation with varying length of experience engaged in the developed of HMNs across a number of different European funded projects.
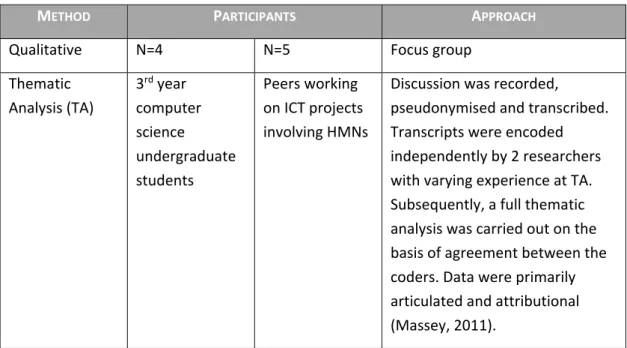
Table 3: Summary of the Qualitative Investigation into the HUMANE typology and method
METHOD PARTICIPANTS APPROACH
Qualitative N=4 N=5 Focus group Thematic Analysis (TA) 3rd year computer science undergraduate students Peers working on ICT projects involving HMNs Discussion was recorded, pseudonymised and transcribed. Transcripts were encoded independently by 2 researchers with varying experience at TA. Subsequently, a full thematic analysis was carried out on the basis of agreement between the coders. Data were primarily articulated and attributional (Massey, 2011). As outlined in the table, the participants were recorded during a two or two‐and‐a‐half semi‐ structured focus group. In both cases, material was used from our own analysis of the eVACUATE human‐machine network as a priming activity, though eVACUATE was not identified specifically. Participants were encouraged to ask questions at any time, and explore their concept of a human‐ machine network. The first cohort, the undergraduate students, decided to review a social network they used themselves, Facebook; by contrast, the IT professionals did not focus on any specific, named network. Outline [2 hours] Brief introduction [PowerPoint] What is a Human‐Machine Network (HMN) Aims of HUMANE Outline method, showing link to human‐centred design methodology Step 1: purpose and objectives [PowerPoint] Describe a HMN to be used in this study Ask the participants to try to define what the purpose of the HMN is Establish what the objectives may be Questions to explore: o Is it difficult or obvious to come up with or agree on the objectives? o A list of typical / common objectives useful? If so, how?
Step 2 a): create network profile [HMN profiler tool] Introduce HMN profiler tool; its scope and aims Facilitate HMN profiling, asking the participants to answer statements in the tool to score the dimensions of the HUMANE typology o Investigator/moderator to enter responses in the tool to create the HMN profile Discussion of each dimension and get feedback: o What does it mean for a dimension to have the value it does, starting to hint at implication analysis o General feedback on experiences with profiling the HMN Step 2 b): create network diagram [Pen & paper] Show a generic diagram to give an idea of what we’re aiming to create Get all participants to create independently, using pen & paper Compare and discuss o Is it easy to create? Any challenges? o If people are creating different networks, why is that? o Anybody learn something new about the network in doing this exercise, independently or by discussing differences? If so, what is the value in that? o Any immediate value or insights in this, compared with other approaches used typically? Step 3 b): implication analysis [PowerPoint] Using HMN network from step 2 b) Introduce approach to analysing implications o Network diagram: relationships between actors/agents o Typology dimensions: emphasize agency and human‐machine interaction with a brief example Take one or two specific trust relations in the network – discuss o How do the implications relate to the objectives? o Are these trust relationships important to the effectiveness: Of the individual interaction Of the entire network o What do you do to maintain the trust relationship? o What would you do to enhance the trust relationship? o What are the consequences if the trust relationship breaks down? Step 3 a) & 4: identify similar networks & extract design patterns [HMN profiler tool] Returning to the tool, emphasise the notion of learning from similar networks, potentially cross‐domains with different purposes and objectives Let the participants explore and provide feedback o Do they see anything that may help them in the design phase of a HMN? o Do they think the networks that are deemed to be similar are indeed similar? If so, on what basis? o Do they see value in the approach? o Do they see themselves using a tool like this for designing, re‐designing/evolving, or analysing HMNs?
3
Evaluation
results
Below, we provide a summary of the results from the four studies described. The self‐selected HMN in study 3 was Facebook.
3.1
The
HUMANE
typology
Study 1: survey on HMN characterisation Although a small number of participants responding to this survey (4 participants from the eVACUATE project), the responses highlight several interesting observations. Firstly, most of the responders did not feel all the dimensions applied to their network; however, only one felt there were dimensions lacking. No new dimensions were proposed; rather commenting the ability to apply the two agency dimensions to different actors (of different levels of agency), highlighting an issue with aggregating these dimensions to apply to the entire network. Study 3: focus group with self‐selecting HMN There were no particular comments from the participants on the typology itself. The feedback from this focus group on the typology was captured as part of the profiling process, which is discussed below in Section 3.2. Study 4: focus group with decision‐support HMN for crisis management The feedback on the typology itself primarily echoed the feedback we received during the first set of case‐studies, reported in (Pickering & Engen, 2017). There is a need for clarity and increase the level of detail. For example, the terminology is still unclear and the participants expressed a need for examples to be able to reliably assess the dimensions of the typology. The participants immediately picked up on an issue with conflating many aspects within a single dimension, especially the agency dimensions. They were expressing a need for the opposite, to have more granularity and rather add more dimensions.
3.2
The
profiling
process
Study 1: survey on HMN characterisation
While the participants largely agreed that the typology seemed complete too them (rather covered more than they felt applied to the network they based their responses on), and that there was only one comment on a single statement that would benefit from clarification, the responses for the eVACUATE HMN demonstrate a challenge in creating a consistent HMN profile. That is, in 50% of the statements, the participants profiling the eVACUATE HMN disagreed with one another. The reasons for this cannot be derived from the survey, but one clue is suggested above; participants may make different assumptions when profiling the network, especially where aggregations are needed across different actors in the network. Study 3: focus group with self‐selecting HMN For most of the profiling process, the participants were able to score the dimensions according to the dimensions without issue. However, we observed disagreements on the first four dimensions in particular, regarding the actors’ agency and interactions. In particular, there seemed to be a challenge in determining values for the machine actors, which the participants were the most unsure about.
There were statements such as “the ones with the machines were difficult” and “Because we then do the averages or we use the averages because we’re not sure what sort of machines you want or we’re talking about anyway”. Part of the challenge of the participants seemed to be due to the size and complexity of the chosen network, Facebook: “I think it’s probably quite hard on Facebook because it’s got so much”, and one participant stated explicitly that they believed the group ended up disagreeing and aggregating because they were thinking of different scopes of the network. Study 4: focus group with decision‐support HMN for crisis management There was much more disagreement between the participants when going through the profiling process in this focus group compared to study 3. The observations remain similar, however. Moreover, this group was more explicit in voicing concerns over the value of the profiling exercise as the aggregation of responses lead to a profile that doesn’t actually reflect the network. As noted above, the participants in this study sought more granularity and felt that the profile of the HMN was too high level to hold real value. However, one participant did ponder openly whether such a high level representation could indeed be useful as an initial step in a process to help steer architectural or technological decisions. However, the participants were focused on benefits to their software engineering processes, which ultimately requires more detailed methods in order to specify a technical architecture, for example. This study also highlighted the possibility that the profiling process may lead to different decisions depending on the perspective adopted by the profiler. For example, different stakeholders in the HMN may have different and perhaps conflicting objectives. Depending on which perspective you take in the beginning of the HUMANE method will thus trickle through the remaining steps, involving the creation of the HMN profile.
3.3
Network
diagramming
Study 3: focus group with self‐selecting HMN This was the only study in which the participants were asked to draw a network diagram (independently of each other) for the selected HMN (Facebook). Their feedback was that this was difficult to do, due to the complexity of the Facebook network; especially in terms of connecting the actors. However, in doing so, they saw a specific benefit in being able to pick up interaction patterns that they considered not being able to pick up otherwise.3.4
Implication
analysis
For the two focus groups, the implication analysis and identification of design solutions were combined into one exercise, with the aim to identify new implications and possible design patterns. Study 3: focus group with self‐selecting HMN
The focus group was steered towards assessing trust implications due to time constraints. All participants had drawn network diagrams, which we used as the approach to identify implications without a need for clarifying the exercise, implying that this was intuitive.
Some implications identified for Facebook were already covered by existing design patterns the HUMANE consortium identified in D2.2 (Følstad et al., 2016). Two additional implications were identified requiring new design solutions for the following: Managing physical access to personal data Preventing criminal exploitation and bullying Study 4: focus group with decision‐support HMN for crisis management The experience in this focus group was similar to that in study 3. However, this group was able to expose more implications, pertaining to the following: Trust: transparent reporting of history and state might engender trust Reliability: continuous service and fault tolerance Report state: the current state should be made available to support the perception of reliability as well as trust User support: o Schema patterns: lighting used in support of information presented on signage. “Exploit attention‐grabbing design” not necessarily suitable. o Informative displays: adding too much detail could potentially delay the processing of information and therefore an evacuation
3.5
Design
patterns
Study 2: survey on design solutions The high‐levels of agreement with the proposed solutions across multiple areas with some 82%4 of 459 responses in all agreeing with those solutions put forward, it is fair to suggest that the methodology outlined in (Følstad et al., 2016) has some benefit in helping to identify what the implications might be for a given type of HMN, and thereby how these may be addressed. These are exploratory results for now, but are nevertheless encouraging. What the free‐form comments highlight in addition though is that some design solutions may well be appropriate, but that there are other implications which may not relate directly to the HMN, but broader economic or user‐experience type considerations. Looking more specifically the procedure here, an increased focus on the rationale behind participant ratings of the appropriateness of the solutions would hopefully uncover more considerations of the type seen in the free‐form comments. For Privacy and trust as well as Underlying infrastructure, for instance, there seems to be a more subtle issue beyond the suitability of any given design solutions. To make the solution appropriate, there needs to be a consideration of what users really expect as 4 Range: 72% – 92%
well as the economic cost to the network supplier. Alternatives may be desirable, such as second channel alerts, and could benefit the effective and acceptable running of the HMN. Study 4: focus group with decision‐support HMN for crisis management The participants explored the tool briefly, and we discussed design patterns as part of the implication analysis reported on above. One particular feedback was giving in this context, as the participants, being software engineers, struggled to see how they could apply the existing design patterns to architectural design due to their high level nature. Instead, one participant suggested that a “lessons learned” from HMNs with similar properties may be more useful.