The Dysfunctional Brain Dynamic of Lewy Body
Dementia and its Behavioural and Clinical Correlates:
An fMRI and EEG Analysis
Julia Schumacher
Institute of Neuroscience
Newcastle University
October 2018
i
Abstract
Background:
Lewy body dementia (LBD), which comprises dementia with Lewy bodies (DLB) and Parkinson’s disease dementia (PDD), is characterised by transient clinical symptoms such as cognitive fluctuations which may be caused by alterations of intrinsic brain dynamics. The aim of this thesis is to investigate how dysfunctional brain connectivity and dynamics relate to the cognitive LBD phenotype, especially to attentional impairment and cognitive fluctuations.
Methods:
In order to investigate behavioural aspects of cognitive fluctuations in LBD, reaction time (RT) data from an attention task were analysed to study how attentional impairment in LBD differs from Alzheimer’s disease (AD) and healthy controls. Additionally, brain structural correlates of attentional dysfunction were assessed using voxel-based morphometry. Subsequently, resting-state fMRI data were analysed using static and dynamic functional connectivity and dynamic network analyses. Faster brain dynamics were assessed by EEG microstate analysis.
Results:
AD and LBD patients exhibited slower and more variable RTs than controls, with greater impairment in LBD than AD. Extremely slow responses occurred with comparable frequency in both dementia groups. There were widespread correlations between RT abnormalities and structural changes in AD patients, but not LBD.
Functional connectivity was decreased in DLB patients compared to controls, mainly in motor, temporal, and frontal networks with sparing of the DMN. Differences between AD and DLB were subtle. Considering time-varying connectivity, AD and DLB patients spent more time in sparse connectivity configurations than controls and switched less often into more highly connected states. Compared to controls, variability of global network efficiency was reduced in patients with DLB.
Microstate analysis revealed a marked and generalised increase in microstate duration in LBD patients compared to controls, which was not seen in AD and was related to a loss of dynamic connectivity between basal ganglia/thalamic and large-scale cortical networks. Microstate slowing was correlated with fluctuation severity in the DLB group and with RT slowing and variability across all participants.
Conclusions:
ii
difference in structural neural correlates. The dynamic connectivity and microstate results indicate a loss of brain dynamics in LBD which might lead to a breakdown of the intricate dynamic properties of the brain, thereby causing loss of flexibility that is crucial for healthy brain function. This might lead to a network configuration which gives rise to the cognitive LBD phenotype characterised by attentional impairment and cognitive fluctuations.
iii
Acknowledgements
First and foremost, I would like to thank my supervisors Dr John-Paul Taylor and Dr Luis Peraza for their constant support, guidance, advice, and encouragement throughout my PhD. I also wish to thank my co-supervisors Dr Peter Gallagher, Prof Marcus Kaiser, and Prof Andrew Blamire for their support and advice.
I was fortunate to work with several pre-existing datasets and I am therefore extremely grateful to everyone who was involved in collecting these data and all the research participants who took part in the different studies.
I wish to thank the Alzheimer’s Society for funding this project. Thanks are also due to everyone who was involved in the Doctoral Training Centre and, in particular, the Research Network monitors for their enthusiasm and valuable feedback.
I would like to thank all the members of the Lewy body lab, especially Dr Sean Colloby and Dr Michael Firbank for advice on statistics and imaging methods, and my progression advisors Dr Peter Taylor and Dr Fiona LeBeau for their advice at different stages of the project. I am very grateful to Dr Ruth Cromarty for all her help with the behavioural analyses, statistics, and general PhD advice. Additionally, I would like to thank Paul Zhutovsky for all the very helpful discussions about preprocessing and neuroimaging statistics.
I also wish to thank my friends and family and everyone (in Newcastle and elsewhere) who has made the last three years (inside and outside of the lab) so enjoyable. Finally, a very special thank you to my sister for her support throughout my PhD and always!
v
Declaration
I have not been involved in any data collection for this thesis. Data for the different studies analysed here were collected by Dr Ruth Cromarty, Alison Killen, Dr Michael Firbank, Dr John-Paul Taylor, and the ICICLE team led by Prof David Burn. The analyses of behavioural data described in Chapter 2 were performed in collaboration with Dr Ruth Cromarty. The cleaning of the EEG data presented in Chapter 6 was completed by Dr Luis Peraza. All of the other analyses as well as the interpretation and the writing of this thesis are entirely my own work.
The following publications have been submitted/published based on work contained in this thesis.
Chapter 2:
Cromarty, R.A.*, Schumacher, J.*, Graziadio, S., Gallagher, P., Killen, A., Firbank, M.J., Blamire, A., Kaiser, M., Thomas, A.J., O’Brien, J.T., Peraza, L.R., and Taylor, J.-P., 2018. Structural Brain Correlates of Attention Dysfunction in Lewy Body Dementias and
Alzheimer’s Disease. Frontiers in Aging Neuroscience, 10, 347. *joint first authors Chapter 3:
Schumacher, J., Cromarty, R.A., Gallagher, P., Firbank, M.J., Thomas, A.J., Kaiser, M., Blamire, A.M., O'Brien, J.T., Peraza, L.R., and Taylor, J.-P., 2018. Structural correlates of attention dysfunction in Lewy body dementia and Alzheimer's disease: An ex-Gaussian analysis. Under review Journal of Neurology
Chapter 4:
Schumacher, J., Peraza L.R., Firbank, M., Thomas, A.J., Kaiser, M., Gallagher, P., O'Brien J.T., Blamire, A.M., and Taylor, J.-P., 2018. Functional connectivity in dementia with Lewy bodies: A within- and between-network analysis. Human Brain Mapping, 39 (3), 1118-1129
Chapter 5:
Schumacher, J., Peraza, L.R., Firbank, M., Thomas, A.J., Kaiser, M., Gallagher, P., O'Brien, J.T., Blamire, A.M., and Taylor, J.-P., 2018. Dynamic functional connectivity changes in dementia with Lewy bodies and Alzheimer's disease. Under review NeuroImage: Clinical
Chapter 6:
Schumacher, J., Peraza, L.R., Firbank, M., Thomas, A.J., Kaiser, M., Gallagher, P., O'Brien J.T., Blamire, A.M., and Taylor, J.-P., 2018. Dysfunctional brain dynamics and their origin in Lewy body dementia. 2018. Provisionally accepted Brain
vii
Table of Contents
List of Figures ... xii
List of Tables ... xiv
Abbreviations ... xvii
Chapter 1. Introduction ... 1
1.1 Lewy Body Dementia ... 1
1.1.1 Clinical features... 1
1.1.2 Neuropathology ... 2
1.1.3 DLB vs PDD ... 4
1.1.4 LBD vs AD... 6
1.2 Cognitive Fluctuations ... 7
1.2.1 Clinical and behavioural manifestation of cognitive fluctuations ... 8
1.2.2 Clinical assessment tools ... 10
1.2.3 Symptomatic treatment of cognitive fluctuations ... 11
1.2.4 Neural correlates of cognitive fluctuations in LBD ... 12
1.2.5 Summary ... 22
1.3 Resting-State Brain Dynamics ... 22
1.3.1 The resting state of the brain ... 23
1.3.2 The importance of resting-state brain dynamics ... 24
1.3.3 Resting-state brain dynamics in LBD ... 25
1.4 Description of Study Cohort ... 26
1.4.1 Study data ... 26
1.4.2 Clinical measures ... 27
1.5 Aims and Hypotheses ... 28
1.5.1 Aims ... 28
1.5.2 Hypotheses: RT data ... 28
1.5.3 Hypotheses: fMRI data ... 29
1.5.4 Hypotheses: EEG data ... 29
Chapter 2. Analysis of Attention Components and Brain Structural Correlates ... 30
2.1 Introduction ... 30
2.2 Methods ... 32
2.2.1 Participants ... 32
2.2.2 Modified Attention Network Test ... 32
2.2.3 Analysis of ANT effects ... 33
2.2.4 MR imaging and analysis ... 34
viii
2.3 Results... 36
2.3.1 Demographics ... 36
2.3.2 Reaction time analysis ... 36
2.3.3 Effect of dopaminergic medication in the LBD group ... 46
2.3.4 VBM analysis ... 46
2.4 Discussion ... 50
2.4.1 Mean RT ... 50
2.4.2 Alerting effect ... 51
2.4.3 Orienting effect ... 52
2.4.4 Executive conflict effect ... 53
2.4.5 Clinical correlations ... 53
2.4.6 Limitations ... 53
2.4.7 Conclusion ... 54
Chapter 3. Ex-Gaussian Analysis of Reaction Time Data and Brain Structural Correlates ... 55 3.1 Introduction ... 55 3.2 Methods ... 56 3.2.1 Participants ... 56 3.2.2 Ex-Gaussian analysis ... 56 3.2.3 VBM analysis ... 56 3.2.4 Statistics ... 57 3.3 Results... 58 3.3.1 Demographics ... 58
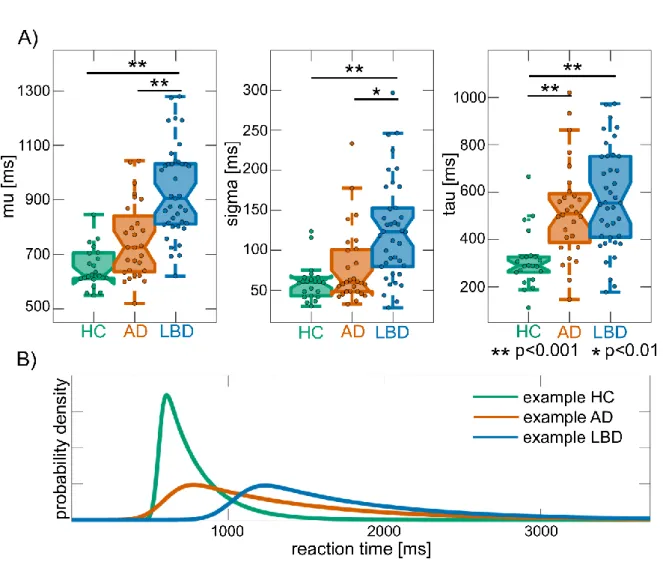
3.3.2 Comparison of ex-Gaussian parameters ... 60
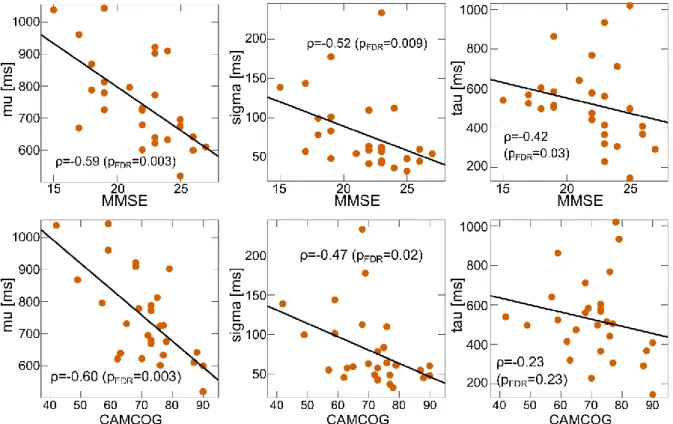
3.3.3 Clinical correlations ... 63
3.3.4 Effect of dopaminergic medication in the LBD group ... 63
3.3.5 VBM analysis ... 64
3.4 Discussion ... 71
3.4.1 More extremely slow responses in AD compared to controls ... 71
3.4.2 Overall RT slowing in LBD compared to AD and controls ... 72
3.4.3 Structural correlates of RT deficits in LBD and AD ... 73
3.4.4 Limitations ... 74
3.4.5 Conclusion ... 74
Chapter 4. Within- and between-network analysis of fMRI functional connectivity ... 76
4.1 Introduction ... 76
ix
4.2.1 Participants ... 77
4.2.2 Data acquisition ... 77
4.2.3 Preprocessing ... 78
4.2.4 Analysis of resting-state data ... 78
4.2.5 Statistical analysis ... 82 4.3 Results ... 82 4.3.1 Demographics... 83 4.3.2 Within-network connectivity... 84 4.3.3 Between-network connectivity ... 89 4.3.4 Clinical correlations ... 89
4.3.5 Effect of dopaminergic medication in the DLB group ... 91
4.4 Discussion ... 92
4.4.1 Decreased connectivity in motor networks in DLB ... 92
4.4.2 DLB-related changes in non-motor networks ... 93
4.4.3 Comparison between the dementia groups... 94
4.4.4 Limitations ... 95
4.4.5 Conclusion ... 95
Chapter 5. Dynamic fMRI functional connectivity analysis ... 96
5.1 Introduction ... 96
5.2 Methods ... 97
5.2.1 Participants ... 97
5.2.2 Data acquisition and preprocessing ... 97
5.2.3 Postprocessing ... 98
5.2.4 Sliding window analysis ... 98
5.2.5 K-means clustering ... 100
5.2.6 Dynamic network analysis ... 100
5.2.7 Statistical analysis ... 101
5.3 Results ... 101
5.3.1 Group differences in dynamic connectivity ... 102
5.3.2 K-means clustering ... 104
5.3.3 Dynamic network measures ... 109
5.3.4 Clinical correlations ... 109
5.3.5 Effect of dopaminergic medication in the DLB group ... 112
5.3.6 Effect of motion ... 112
5.4 Discussion ... 113
x
5.4.2 DLB-related changes in dynamic network topology ... 115
5.4.3 Relation to clinical symptoms in DLB ... 116
5.4.4 Reliability of dynamic connectivity results ... 116
5.4.5 Limitations ... 117
5.4.6 Conclusion ... 118
Chapter 6. EEG Microstate Analysis ... 119
6.1 Introduction ... 119
6.2 Methods ... 120
6.2.1 Participants ... 120
6.2.2 EEG acquisition and preprocessing ... 120
6.2.3 Microstate analysis ... 121
6.2.4 Microstate statistics ... 123
6.2.5 Clinical and behavioural correlations ... 123
6.2.6 Effect of dopaminergic medication in the LBD group ... 124
6.2.7 FMRI dynamic connectivity ... 124
6.2.8 Combining EEG microstates and dynamic fMRI connectivity ... 124
6.3 Results... 125
6.3.1 Demographics ... 125
6.3.2 Cluster evaluation ... 128
6.3.3 Microstate topographies ... 128
6.3.4 Microstate temporal characteristics ... 130
6.3.5 Analysis of transition probabilities ... 135
6.3.6 Clinical and behavioural correlations ... 136
6.3.7 Effect of dopaminergic medication in the LBD group ... 137
6.3.8 Relation between dynamic connectivity and microstate duration ... 138
6.4 Discussion ... 142
6.4.1 Microstate dynamics ... 142
6.4.2 Clinical and behavioural relevance of microstate dynamics in LBD ... 144
6.4.3 Microstate dynamics in AD ... 144
6.4.4 Relation to previous EEG findings in LBD ... 145
6.4.5 Origins of microstate disturbances in LBD ... 145
6.4.6 Limitations ... 146
6.4.7 Conclusion ... 147
Chapter 7. Conclusions and Future Directions ... 148
7.1 Summary of Main Findings ... 148
xi
7.1.2 Static and dynamic functional connectivity analysis ... 149
7.1.3 Dynamic EEG microstate analysis ... 151
7.2 Strengths ... 151
7.3 Limitations ... 153
7.4 Conclusions ... 154
7.5 Future directions ... 155
xii
List of Figures
Figure 1.1. Overview of alpha-synucleinopathies. ... 3
Figure 1.2. Cognitive fluctuations in LBD... 9
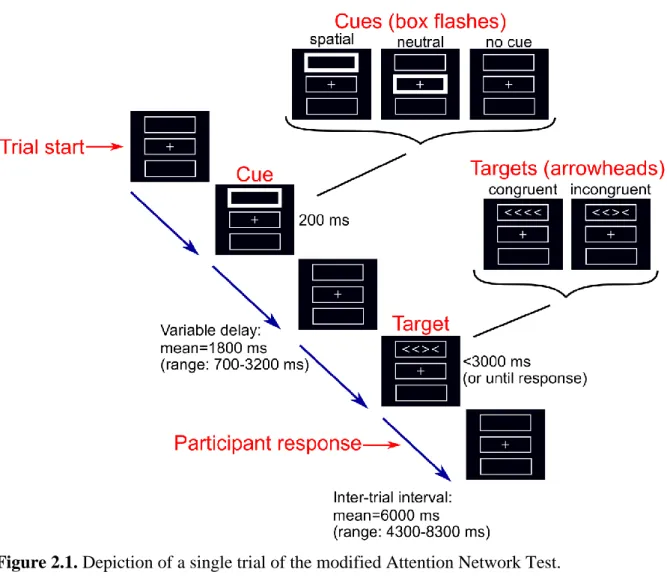
Figure 2.1. Depiction of a single trial of the modified Attention Network Test. ... 33
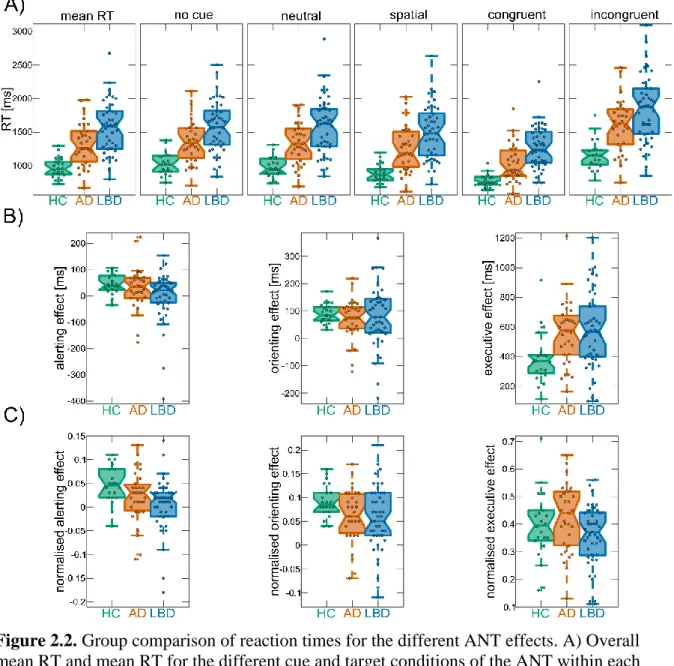
Figure 2.2. Group comparison of reaction times for the different ANT effects ... 39
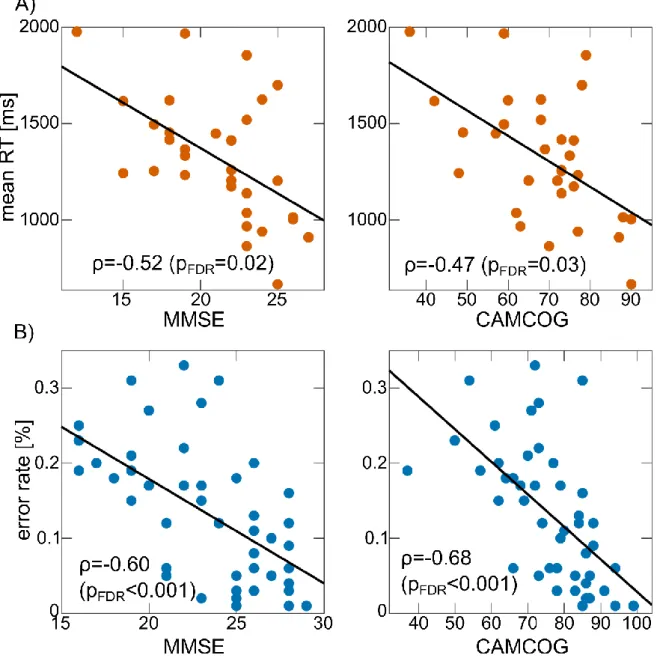
Figure 2.3. Correlations between mean RT and error rates and clinical scores ... 45
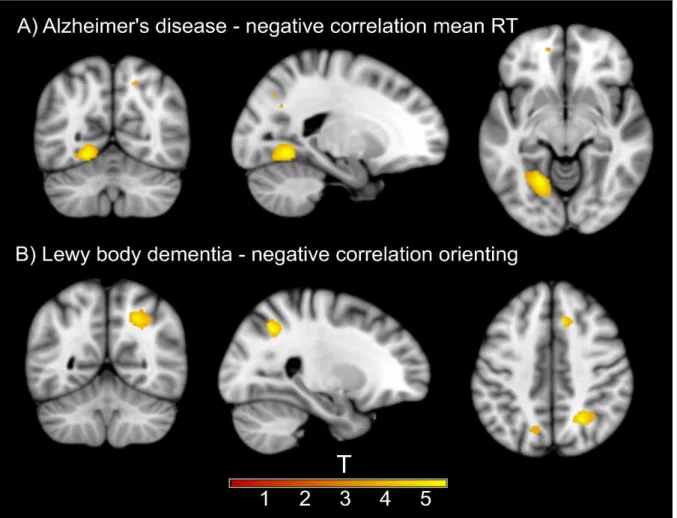
Figure 2.4. Results from VBM analysis for ANT effects ... 50
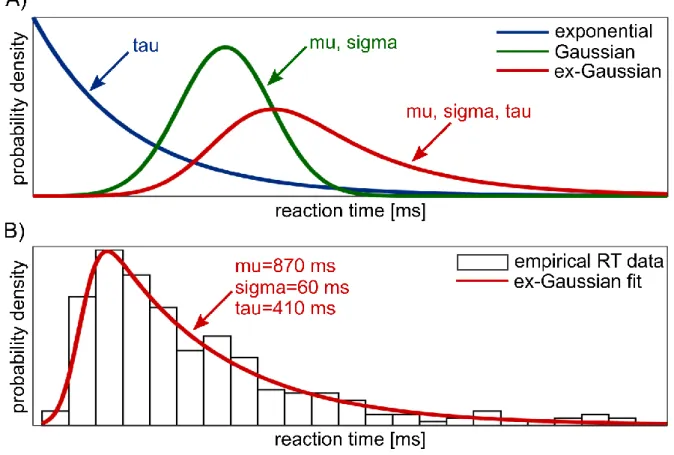
Figure 3.1. Explanation of ex-Gaussian analysis. ... 57
Figure 3.2. Group comparison of ex-Gaussian parameters. ... 61
Figure 3.3. Correlation between global cognition and ex-Gaussian parameters in AD ... 65
Figure 3.4. Results from VBM analysis for ex-Gaussian parameters ... 70
Figure 4.1. Spatial maps of resting state networks ... 81
Figure 4.2. Dual regression results comparing AD and HC ... 85
Figure 4.3. Dual regression results comparing DLB and HC ... 87
Figure 4.4. Mean z-scores for all clusters that showed significant group differences ... 88
Figure 4.5. Results from FSLNets analysis ... 90
Figure 5.1. Explanation of sliding window and k-means analysis ... 99
Figure 5.2. Results from dynamic functional connectivity analysis ... 103
Figure 5.3. Standard deviation matrices for different window sizes ... 104
Figure 5.4. Elbow plot for evaluation of optimal cluster number ... 105
Figure 5.5. Results from k-means analysis ... 107
Figure 5.6. Network representation of cluster centroids ... 108
Figure 5.7. Group comparison of frequency and occurrence of k-means states ... 108
Figure 5.8. Results from k-means analysis for different values of k ... 110
Figure 5.9. Results from k-means analysis for different window sizes ... 111
Figure 5.10. Results from k-means analysis on bootstrap and split-half resamples ... 111
Figure 5.11. Results from dynamic network analysis. ... 113
Figure 6.1. Explanation of EEG microstate analysis. ... 122
Figure 6.2. Group comparison of microstate topographies ... 130
Figure 6.3. Group comparison of microstate duration and occurrence per second ... 133
Figure 6.4. Correlation between mean microstate duration and Mayo fluctuation scores .... 137
Figure 6.5. Correlations between mean microstate duration and the three ex-Gaussian parameters across all participants. ... 137
Figure 6.6. Relation between mean microstate duration and basal ganglia and thalamic dynamic connectivity in LBD. ... 139
xiii
Figure 6.7. Relation between mean microstate duration and basal ganglia and thalamic
xiv
List of Tables
Table 1.1. Comparison of clinical and pathological characteristics between DLB and PDD. .. 4
Table 1.2. Structural MRI studies of cognitive fluctuations. ... 13
Table 1.3. Functional MRI and MRS studies of cognitive fluctuations. ... 15
Table 1.4. PET and SPECT studies of cognitive fluctuations. ... 18
Table 1.5. EEG studies of cognitive fluctuations. ... 20
Table 2.1. Demographics and clinical information, ANT analysis ... 37
Table 2.2. Mean reaction times, error rates, and ANT effects for DLB and PDD subgroups 38 Table 2.3. Mean reaction times for each task condition for controls, AD and LBD patients . 38 Table 2.4. Mean error rates for each task condition for controls, AD and LBD patients ... 41
Table 2.5. Results from statistical tests for raw and normalised reaction times ... 42
Table 2.6. Results from statistical tests for raw and normalised reaction times analysing matched dementia subgroups. ... 43
Table 2.7. Results from statistical tests for error rates ... 44
Table 2.8. Correlations between clinical scores and ANT effects ... 44
Table 2.9. Results from VBM analysis of correlations between grey matter volume and mean RT and ANT effects in AD ... 47
Table 2.10. Results from VBM analysis of correlations between white matter volume and mean RT and ANT effects in AD. ... 48
Table 2.11. Results from VBM analysis of correlations between grey matter volume and mean RT and ANT effects in LBD ... 48
Table 2.12. Results from VBM analysis of correlations between white matter volume and mean RT and ANT effects in LBD ... 49
Table 3.1. Demographics and clinical information, ex-Gaussian analysis. ... 59
Table 3.2. Group comparison of ex-Gaussian parameters ... 60
Table 3.3. Group comparison of ex-Gaussian parameters for matched dementia subgroups . 61 Table 3.4. Group comparison of ex-Gaussian parameters treating DLB and PDD as separate groups ... 62
Table 3.5. Correlations between ex-Gaussian parameters and clinical scores ... 63
Table 3.6. Results from VBM analysis of correlations between grey matter volume and ex-Gaussian parameters in AD ... 66
Table 3.7. Results from VBM analysis of correlations between white matter volume and ex-Gaussian parameters in AD ... 67
xv
Table 3.8. Results from VBM analysis of correlations between grey matter volume and
ex-Gaussian parameters in LBD. ... 68
Table 3.9. Results from VBM analysis of correlations between white matter volume and ex-Gaussian parameters in LBD ... 69
Table 4.1. List of all resting state networks ... 80
Table 4.2. Demographic and clinical variables, fMRI connectivity analysis. ... 83
Table 4.3. Demographics of the independent healthy control group whose data were used for the estimation of RSNs ... 84
Table 4.4. Dual regression results comparing AD and HC... 85
Table 4.5. Dual regression results comparing DLB and HC. ... 86
Table 4.6. Dual regression results comparing AD and DLB ... 89
Table 4.7. Correlations between mean functional connectivity from dual regression and clinical scores ... 91
Table 4.8. Results from voxel-wise correlations with clinical scores... 91
Table 5.1. Group comparison of k-means characteristics and static and dynamic efficiency measures ... 106
Table 5.2. Correlations between time and the occurrence of k-means states. ... 108
Table 5.3. Comparison of dynamic connectivity measures between DLB patients on and off dopaminergic medication ... 112
Table 5.4. Correlations between dynamic connectivity measures and motion parameters ... 112
Table 6.1. Demographic and clinical variables, EEG microstate analysis ... 126
Table 6.2. Demographic and clinical variables for participants included in the combined EEG-fMRI analysis ... 127
Table 6.3. Comparison of microstate characteristics between DLB and PDD ... 127
Table 6.4. Group comparison of microstate topographies ... 129
Table 6.5. Group comparison of microstate topographies for matched dementia subgroups 129 Table 6.6. Group comparison of microstate duration ... 132
Table 6.7. Group comparison of microstate occurrence per second ... 134
Table 6.8. Group comparison of microstate duration for matched dementia subgroups ... 134
Table 6.9. Group comparison of microstate occurrence per second for matched dementia subgroups ... 135
Table 6.10. Group comparison of microstate coverage ... 135
Table 6.11. Correlation between mean microstate duration and Mayo fluctuation scores .... 136
Table 6.12. Comparison of microstate characteristics between DLB patients on and off dopaminergic medication ... 138
xvi
Table 6.13. Relation between mean microstate duration and basal ganglia dynamic
connectivity. ... 141
Table 6.14. Relation between mean microstate duration and thalamic dynamic connectivity ... 142
xvii
Abbreviations
ACC – Anterior cingulate cortex
AD – Alzheimer’s disease
ANOVA – Analysis of variance
ANT – Attention Network Test
CAF – Clinician Assessment of Fluctuation
CAMCOG – Cambridge Cognitive Examination
CI – Confidence interval
CRT– Choice reaction time
CSF – Cerebrospinal fluid
DLB – Dementia with Lewy bodies
DMN – Default mode network
DTI – Diffusion tensor imaging
EEG – Electroencephalogram
FDR – False discovery rate
FEAT – FMRI Expert Analysis Tool
fMRI – Functional magnetic resonance imaging
FSL – FMRIB’s software library
FWE – Family-wise error
GEV – Global explained variance
GFP – Global field potential
GIFT – Group ICA of fMRI toolbox
GLM – General linear model
GM – Grey matter
HC – Healthy control
ICA – Independent component analysis
LBD – Lewy body dementia
LEDD – Levodopa equivalent daily dose
MANOVA – Multivariate analysis of variance
MCFLIRT – Motion Correction FMRIB’s Linear Image Registration Tool
MCI – Mild cognitive impairment
MELODIC – Multivariate Exploratory Linear Optimised Decomposition into Independent Components
MMSE – Mini Mental State Examination
xviii
MPRAGE – Magnetisation prepared rapid gradient echo
MRS – Magnetic resonance spectroscopy
NAA/Cr – N-acetylaspartate/creatine
NBM – Nucleus basalis of Meynert
NPI – Neuropsychiatric Inventory
PD – Parkinson’s disease
PDD – Parkinson’s disease dementia
PET – Positron emission tomography
RBD – REM sleep behaviour disorder
REM – Rapid eye movement
RSN – Resting-state network
RT – Reaction time
SD – Standard deviation
SPECT – Single photon emission computed tomography
SPM – Statistical Parametric Mapping
TAAHC – Topographic atomize and agglomerate hierarchical clustering
TANOVA – Topographic analysis of variance
TFCE – Threshold-free cluster enhancement
TR – Repetition time
UPDRS – Unified Parkinson’s Disease Rating Scale
VBM – Voxel-based morphometry
1
Chapter 1.
Introduction
1.1Lewy Body Dementia
Lewy body dementia (LBD) is an umbrella term describing two common forms of
neurodegenerative dementia in older age that present with a similar clinical phenotype and which share the same underlying neuropathology: dementia with Lewy bodies (DLB) and Parkinson’s disease dementia (PDD) (McKeith et al., 2017, 2005). Accounting for
approximately 10-15% of all neuropathologically defined dementia cases, LBD is the second most common form of neurodegenerative dementia after Alzheimer’s disease (AD) (McKeith et al., 1996; Vann Jones and O’Brien, 2014).
1.1.1Clinical features
The central requirement for a diagnosis of DLB or PDD is dementia which is defined as a progressive decline in cognition of sufficient severity to interfere with normal social or occupational functions (McKeith et al., 2017). In addition, there are a number of clinical symptoms associated with LBD including (1) complex and recurrent visual hallucinations, (2) rapid eye movement (REM) sleep behaviour disorder (RBD), (3) spontaneous Parkinsonism, and (4) cognitive fluctuations (McKeith et al., 2017, 2005). These are core diagnostic features of DLB, but frequently occur in PDD as well (Emre et al., 2007).
Visual hallucinations occur in up to 80% of LBD patients and typically present in the form of well-formed and detailed images of people, animals, and objects (Aarsland et al., 2001; Mosimann et al., 2006). RBD is characterised by an absence of normal REM sleep atonia leading to dream enactment behaviour, and can precede the onset of other symptoms by many years (Ferman et al., 2011). Parkinsonism in DLB and PDD is often associated with postural instability, gait, and speech disturbances. Rest tremor is not as common as in Parkinson’s disease (PD) patients without dementia (Burn et al., 2003). Apart from motor disturbances, Parkinsonism in LBD is also commonly associated with a slowness of thinking referred to as bradyphrenia (Firbank et al., 2018). Cognitive fluctuations are characterised by pronounced variations in attention and alertness over time. They will be discussed in more detail in Section 1.2.
Other features that are associated with LBD and that can help inform a clinical diagnosis include autonomic dysfunction, syncope, repeated falls, neuroleptic sensitivity, delusions, apathy, anxiety, and depression (McKeith et al., 2017). From a neuropsychological perspective, both DLB and PDD are characterised by marked deficits in executive,
2 Walker et al., 2015).
Currently, there are no disease-modifying treatments for LBD. However, acetylcholinesterase inhibitors have been used in LBD patients with positive effects on overall cognition, visual hallucinations and other neuropsychiatric symptoms, as well as attentional impairment (Aarsland et al., 2004; McKeith et al., 2000b; Stinton et al., 2015; Wang et al., 2015; Wesnes et al., 2002). Similarly, memantine has been shown to improve overall cognition, attention, and episodic memory in DLB and PDD (Aarsland et al., 2009a; Emre et al., 2010; Wesnes et al., 2015). Furthermore, dopaminergic medication is used to treat motor symptoms in LBD (Bonelli et al., 2004; Molloy et al., 2005).
1.1.2Neuropathology
A definitive diagnosis of LBD is dependent on the presence of Lewy body pathology at autopsy which is characterised by abnormal aggregations of the presynaptic protein alpha-synuclein in the form of Lewy bodies (found in the neuronal cytoplasm) or Lewy neurites (found inside dystrophic neurons) (Dickson, 2002; McKeith et al., 2005). These can be widely distributed throughout the peripheral and central nervous system and are found in the
brainstem, basal forebrain, limbic regions, and the neocortex (Beach et al., 2009; Braak et al., 2003). Lewy body pathology is also characteristic of other neurodegenerative disorders including PD and multiple system atrophy which together with LBD are collectively referred to as alpha-synucleinopathies (Jellinger, 2003) (see Figure 1.1). In the context of PD, it has been suggested that accumulation of Lewy bodies follows an ascending pathway, starting in the lower brainstem and progressing to limbic and subsequently to neocortical regions in a caudo-rostral distribution (Braak et al., 2003). This is also thought to reflect the clinical phenotype with brainstem-predominant pathology being associated with PD without dementia and the accumulation of pathology in higher-order regions being related to a clinical
presentation with more severe cognitive impairment (Braak et al., 2004; Halliday and
McCann, 2010). However, many DLB cases do not necessarily follow this staging system, i.e. Lewy body pathology may be found in neocortical areas with sparing of lower brain regions (Frigerio et al., 2011; Parkkinen et al., 2005; Zaccai et al., 2008) and significant Lewy body pathology may be present without the development of cognitive or motor impairment
(Colosimo, 2003; Parkkinen et al., 2008). A further pathological finding that is characteristic of both DLB and PDD is the loss of midbrain dopaminergic neurons and cholinergic neurons in the ventral forebrain nuclei (Kövari et al., 2009), leading to marked dopaminergic and cholinergic deficits (Lippa et al., 1999).
3
Figure 1.1. Overview of diseases that are characterised by Lewy body pathology.
present in the form of neuritic plaques (extracellular amyloid-beta aggregations) and
neurofibrillary tangles (intraneuronal accumulation of hyperphosphorylated tau) (Dugger et al., 2014; Howlett et al., 2015). Conversely, Lewy body pathology can also be present in cases with clinical AD and is typically found in the amygdala (Lippa et al., 2005; Popescu et al., 2004).
While it is still unclear how Lewy body and other pathologies lead to the clinical
manifestation of the disease, several studies have identified possible clinicopathological correlations. In PD, the development of dementia has been associated with the presence of cortical and limbic Lewy bodies (Hurtig et al., 2000; Kövari et al., 2003) as well as
cholinergic deficits (Klein et al., 2010), and the level of cognitive impairment in DLB has been related to the severity of Lewy body pathology (Beach et al., 2009). Furthermore, Lewy bodies in the hippocampus have been shown to be associated with memory impairment in DLB (Adamowicz et al., 2017). Neuronal loss in the substantia nigra is the strongest correlate of Parkinsonism in LBD (McKeith et al., 2017). The presence of visual hallucinations has been related to Lewy body pathology in limbic regions (Ferman et al., 2013a) and the
4
temporal lobe (Harding et al., 2002) (with relative sparing of early visual areas (Erskine et al., 2015)) and to disturbances in cholinergic neurotransmission (Ballard et al., 2000). The
relation between pathological changes and cognitive fluctuations is less clear (Harding et al., 2002). There is, however, evidence that higher binding of nicotinic receptors in the temporal cortex and thalamus may be associated with fluctuating cognition (Ballard et al., 2002b; Pimlott et al., 2006). Additionally, it has been suggested that cognitive fluctuations are more prevalent in patients with neocortical Lewy bodies as opposed to patients with predominantly striatal or limbic pathology (Schneider et al., 2012). The effect of concomitant AD pathology on the clinical presentation of LBD will be discussed in more detail in Section 1.1.4.
1.1.3DLB vs PDD
DLB and PDD are differentiated clinically based on the time-course of symptom development: DLB is diagnosed if dementia occurs before or simultaneously with Parkinsonism whereas PDD is diagnosed if dementia develops in the context of
well-established PD. For practical purposes the one-year rule is applied where DLB is diagnosed in patients who develop cognitive symptoms before or within one year of the onset of
Parkinsonism and where PDD is diagnosed if the onset of motor symptoms precedes the development of cognitive symptoms by more than a year (Aarsland et al., 2009b; McKeith et al., 2017, 2005). Numerous studies have investigated similarities and differences between DLB and PDD in terms of behavioural, clinical, morphological, and neurochemical
characteristics. However, it is still debated whether they represent distinct disease entities or merely different points on the same disease spectrum (e.g. Friedman, 2018; Jellinger and Korczyn, 2018) (see Table 1.1 for a comparison of clinical and pathological characteristics between DLB and PDD).
Table 1.1. Comparison of clinical and pathological characteristics between DLB and PDD.
DLB PDD
Attention +++ +++
Executive dysfunction +++ +++
Cognitive fluctuations +++ ++
Parkinsonism variable present
Visual hallucinations +++ ++
Delusions +++ ++
Responsiveness to levodopa +/- +
Nigrostriatal loss + +++
Cortical/striatal pathology +++ ++
Amyloid deposition moderate – high low
5
From a neuropathological and neurochemical perspective, DLB and PDD are difficult to discriminate, with no hallmark pathological feature that distinguishes the two (Harding and Halliday, 2001; Klein et al., 2010; Tsuboi and Dickson, 2005). Neuronal loss in the substantia nigra might be more severe in PDD relative to DLB (Tsuboi and Dickson, 2005), whereas pathological burden in the striatum has been found to be higher in DLB than in PDD
(Jellinger and Attems, 2006). Additionally, more severe Lewy body pathology in the temporal lobe has been reported in DLB than in PDD (Harding et al., 2002). Nevertheless, similar striatal dopaminergic deficits have been observed in both conditions (Klein et al., 2010). Some studies report a higher prevalence of AD pathology in DLB than in PDD (Edison et al., 2008; Gomperts et al., 2008; Harding and Halliday, 2001; van Steenoven et al., 2016)
whereas others have failed to find such differences (Tsuboi and Dickson, 2005).
Studies of grey and white matter differences between DLB and PDD have found conflicting results. While one study did not find any differences in white matter hyperintensities (Burton et al., 2006), others have found more severe white matter abnormalities in DLB than in PDD which has been hypothesised to be due to concurrent AD pathology in DLB patients (Joki et al., 2018; Lee et al., 2010). Similarly, for grey matter atrophy some studies described more pronounced loss in DLB compared to PDD (Beyer et al., 2007; Joki et al., 2018; Lee et al., 2010) whereas other studies could not identify differences between the groups (Burton et al., 2004; Hattori et al., 2012; Janzen et al., 2012; Kenny et al., 2008; Tam et al., 2005). DLB and PDD show similar deficits in blood perfusion across the brain with slightly more pronounced hypoperfusion in DLB than in PDD (Hattori et al., 2012; Mito et al., 2005). Additionally, functional connectivity has been shown to be comparable between the two conditions, with only subtle differences in motor- and attention-related networks (Peraza et al., 2015a). Overall, cognitive and neuropsychological profiles have been shown to be similar (Aarsland et al., 2003; Aldridge et al., 2018; Noe et al., 2004), with slight differences in verbal learning and memory which may be more impaired in DLB than in PDD (Brønnick, 2015; Filoteo et al., 2009; Mondon et al., 2007; Park et al., 2011). Sleep and motor abnormalities are
comparable in DLB and PDD (Boddy et al., 2007; McKeith et al., 2005) as are
visuoperceptual impairment and neuropsychiatric symptoms (Fields, 2017; Mosimann et al., 2004). The phenomenology of visual hallucinations and delusions is similar in the LBD subgroups (Aarsland et al., 2001; Mosimann et al., 2006). However, both delusions and hallucinations have been shown to be more prevalent in DLB than in PDD (Aarsland et al., 2001; Savica et al., 2013). While cognitive fluctuations are clinically indistinguishable between DLB and PDD (Ballard et al., 2002a; Varanese et al., 2010) they occur with a higher prevalence in DLB (Savica et al., 2013). Furthermore, attentional and executive impairment
6
has been reported to be comparable in both conditions (Ballard et al., 2002a; Firbank et al., 2016; Mondon et al., 2007), with one study reporting slightly worse deficits in DLB than in PDD (Park et al., 2011). In particular, a functional neuroimaging study of attentional dysfunction in LBD did not find any behavioural and only subtle neuroimaging differences between DLB and PDD, indicating that similar processes underlie attentional-executive impairment in both groups (Firbank et al., 2016). From an electrophysiological perspective, there are no differences between DLB patients and PDD patients with cognitive fluctuations (Bonanni et al., 2008). Further support comes from a meta-analysis of attention and executive dysfunction in DLB and PDD in which the authors did not find statistical evidence for a difference between the two groups (Brønnick, 2015).
In summary, while some clinical and neuropsychological studies have found subtle
differences between DLB and PDD, the overall presentation of the two patient groups seems to be similar, especially with respect to attentional impairment and cognitive fluctuations. DLB and PDD patients were therefore combined into one Lewy body dementia group for most analyses in this thesis. Nevertheless, since the exact relationship between DLB and PDD is still unclear and previous studies have reported conflicting results, additional analyses were performed to investigate potential differences between the two groups in terms of the clinical, behavioural, and neuroimaging measures presented in this thesis.
1.1.4LBD vs AD
While the specificity of the clinical diagnostic criteria for LBD is high, i.e. most patients with a clinical diagnosis of LBD will show significant Lewy body pathology at autopsy (McKeith et al., 2000a), their sensitivity can be low which is mainly due to patients being misdiagnosed with AD (Litvan et al., 2003, 1998; Lopez et al., 2002; Rizzo et al., 2017). This prevents misdiagnosed patients from receiving appropriate treatment, can have potentially adverse effects due to neuroleptic sensitivity in LBD (McKeith et al., 1992a), and constitutes a problem when stratifying patients for research studies or clinical trials. While LBD and AD are in theory characterised by different phenotypes, there is often considerable clinical overlap (Thomas et al., 2018). While AD is characterised by more pronounced impairment in episodic memory relative to LBD in the early stages (Calderon, 2001; Economou et al., 2016; Kraybill et al., 2005; Noe et al., 2004), memory impairment usually develops with disease progression in LBD (McKeith et al., 2017). In contrast, LBD patients show more severe attentional and executive impairment than AD patients (Kraybill et al., 2005; Noe et al., 2004), and cognitive fluctuations (Ferman et al., 2004) as well as visual hallucinations (Thomas et al., 2018) seem to be the most distinguishing features.
7
Many LBD cases, especially those with DLB, exhibit significant concurrent AD pathology (Dugger et al., 2014; Howlett et al., 2015) which can be assessed at autopsy or in vivo using positron emission tomography (PET) imaging or analysis of cerebrospinal fluid (CSF)
markers (Donaghy et al., 2015). This additional pathological burden has been related to higher global atrophy rates in LBD (Nedelska et al., 2015; Sarro et al., 2016; Shimada et al., 2013) and to medial temporal lobe atrophy which is typically seen in clinical AD (Elder et al., 2017; van der Zande et al., 2018). Amyloid-beta deposition has also been associated with lower medial temporal lobe perfusion in DLB (Donaghy et al., 2018). From a clinical point of view, the severity of AD pathology is inversely related to the LBD clinical phenotype (Ballard et al., 2004; Fujishiro et al., 2008; McKeith et al., 2005), and LBD patients with mixed pathology show more severe memory impairment than pure Lewy body cases (Kraybill et al., 2005). Furthermore, coexisting AD pathology in LBD is associated with a more severe manifestation of the disease (van Steenoven et al., 2016), a higher risk of institutionalisation and mortality (Graff-Radford et al., 2016; Lemstra et al., 2017), lower cognitive performance (Foster et al., 2010), and a more rapid cognitive decline (Blanc et al., 2017; Howlett et al., 2015; Kraybill et al., 2005; Sarro et al., 2016).
Based on these considerations, the reasons for including an AD group in the analyses of this thesis are two-fold. Firstly, AD patients were included so as to get a better understanding of commonalities and differences between these two common forms of dementia which may be important in the context of a differential diagnosis. Secondly, AD patients were included as a disease-comparator group to disentangle which of the differences that were observed in the comparison between patients with LBD and healthy controls might be a general dementia phenomenon and which might be specific LBD-related changes.
1.2Cognitive Fluctuations
Even though the recognition of DLB as a distinct diagnostic entity is relatively recent
(McKeith et al., 1992b), cognitive fluctuations have long been recognised as a salient feature of the phenotype, as described in early clinicopathological series (Forno et al., 1978; Gibb et al., 1987; Woodard, 1962). This culminated in the identification of cognitive fluctuations as a key feature of the disease in the first consensus criteria (McKeith et al., 1996). They are now regarded as one of the most characteristic features of the condition and form an important element in differential diagnosis (McKeith, 2002; McKeith et al., 1992b). However, accurate identification of cognitive fluctuations can pose a clinical challenge (Cummings, 2004; Litvan et al., 1998; Mega et al., 1996).
8
rates of 45-90% reported (Bradshaw et al., 2004; Byrne et al., 1989; Lee et al., 2012; Varanese et al., 2010; Verghese et al., 1999). They are also common in PDD, albeit being slightly less prevalent than in DLB (Ballard et al., 2002a; Savica et al., 2013).
While some data suggest that cognitive fluctuations are a late manifestation of the disease, occurring on average 4.5 years after onset of cognitive symptoms (Molano et al., 2010), others have identified cognitive fluctuations in the prodromal phase in 30% (Jicha et al., 2010) to 60% (Cagnin et al., 2015) of patients. Furthermore, the presence of cognitive fluctuations in non-amnestic mild cognitive impairment (MCI) cohorts has been shown to be predictive of conversion to DLB (Ferman et al., 2013b; Sadiq et al., 2017), and it has been described as one of the most characteristic features of prodromal DLB (Donaghy et al., 2017). Cognitive fluctuations are associated with impaired quality of life and inability to perform activities of daily living (Brønnick et al., 2006; Sun et al., 2018). They contribute to greater disability and caregiver burden (Ballard et al., 2001b; Lee et al., 2013), and can present the clinician with significant challenges in the assessment of decision-making capacity (Shulman et al., 2015; Trachsel et al., 2015). Cognitive fluctuations therefore constitute an important therapeutic target. However, their aetiology is still poorly understood.
1.2.1Clinical and behavioural manifestation of cognitive fluctuations
Qualitatively, the clinical manifestation of cognitive fluctuations in LBD is primarily that of an altered level of alertness and attention with a marked amplitude between best and worst performances ranging from episodes of switching off or going blank, to spontaneous remission to normal or near-normal performance (Ballard et al., 2002a; McKeith, 2002; McKeith et al., 1996) (see Figure 1.2). This is described as having a spontaneous, periodic, and transient quality, as opposed to the fluctuations in cognitive performance seen in AD in response to inter-current environmental demands; informants in the latter circumstance more frequently cite episodes of memory failure rather than significant alterations in alertness (Bradshaw et al., 2004). As such, cognitive fluctuations in LBD are largely an internally-mediated process, whilst fluctuations in AD are more frequently a consequence of an altered external environment. While fluctuations in LBD are classically transient, clinical experience has long suggested that there may be a spectrum of severity, from periods of altered attention or drowsiness – lasting seconds or minutes – to days of obtundation (McKeith et al., 1996, 1992b). However, there does not seem to be a clear diurnal pattern, and mild diurnal/nocturnal variations that occur in other dementia subtypes should not be considered to support a clinical diagnosis of cognitive fluctuations (McKeith et al., 1996).
9
Figure 1.2. Cognitive fluctuations in LBD.
Behaviourally, cognitive fluctuations have been associated with impairments in reaction time (RT) performance on tests of sustained attention. LBD patients with a higher severity of cognitive fluctuations show slower RTs, impaired vigilance, and higher variability in RT performance than those with less severe fluctuations (Ballard et al., 2002a, 2001b; Onofrj et al., 2003; Walker et al., 2000a). Furthermore, the severity of cognitive fluctuations as assessed by clinical fluctuation scores has been shown to correlate with variability in attentional
performance across 90 seconds (Walker et al., 2000a, 2000b, 2000c). These results highlight the relationship between cognitive fluctuations and fluctuations in attention and alertness, and indicate that cognitive fluctuations might be associated with perturbations in attentional circuitry. Furthermore, it has been suggested that measures of attentional variability might represent an objective and accurate tool to characterise and quantify cognitive fluctuations in LBD (Walker et al., 2000a).
In addition to attentional impairment, there seems to be a sleep/arousal dimension
contributing to cognitive fluctuations. Patients with advanced LBD have extremely poor sleep efficiency and may demonstrate profound distortions in sleep-wake architecture (Pao et al., 2013). Hypersomnolence has been incorporated as a supportive feature in the most recent
10
DLB diagnostic criteria (McKeith et al., 2017), and one of the clinical tools to investigate cognitive fluctuations specifically enquires as to the presence of excessive daytime
somnolence (Ferman et al., 2004). The presence of RBD appears to correlate with cognitive fluctuations in DLB (Escandon et al., 2010), and some studies suggest that sleep disturbances and cognitive fluctuations may reciprocally potentiate each other (Cagnin et al., 2016). However, this may also represent concomitant pathological involvement of anatomically related structures in brainstem-thalamo-cortical networks (Antelmi et al., 2016; Terzaghi et al., 2013). Additionally, other studies do not find any correlations between polysomnography parameters as well as multiple sleep latency tests and cognitive fluctuations in DLB (Bliwise et al., 2014; Ferman et al., 2014). Nevertheless, certain findings suggest that there may be two distinct dimensions to fluctuations, one related to attention and one related to
arousal/alertness.
1.2.2Clinical assessment tools
A number of clinical assessment tools have been devised in an effort to better identify cognitive fluctuations and distinguish fluctuations in LBD from those seen in other dementia subtypes (Ferman et al., 2004; Lee et al., 2014; Walker et al., 2000b).
The Clinician Assessment of Fluctuation (CAF), a series of questions administered to an informant by an experienced clinician, assesses the severity and duration of fluctuations in cognition and levels of confusion during the month prior to the assessment (Walker et al., 2000b). Cognitive fluctuations are considered to be present, if the informant is able to provide a clear example. If present, severity and duration of the cognitive fluctuations are rated on a scale from 0-4; both scores are then multiplied to obtain a total score ranging from 0-12 with a score of 0 representing no fluctuations and a score of 12 representing severe fluctuations (a score of 16 would indicate a continuously confused state and hence no fluctuations). This scale showed fair inter-rater reliability with excellent reliability in scoring severe fluctuations (Van Dyk et al., 2016) as well as good sensitivity and specificity at distinguishing DLB from AD and vascular dementia (Walker et al., 2000b); however, it needs to be administered by an experienced clinician which makes its application in clinical trials challenging.
Similarly, the Mayo fluctuations scale is a 19-item questionnaire delivered to the patient’s caregiver to evaluate fluctuating cognition during the month prior to the assessment (Ferman et al., 2004). A total score is calculated; additionally, a cognitive and an arousal subscore can be derived by focussing on questions related to cognitive and arousal aspects of fluctuations, respectively (Bliwise et al., 2014). It can reliably differentiate DLB from AD (Ferman et al., 2004), however, its utility in distinguishing DLB from other dementia subtypes remains
11 unclear (Lee et al., 2012).
The One Day Fluctuation Assessment Scale is a brief clinician-rated scale to evaluate
cognitive fluctuations over a period of 24 hours prior to the assessment (Walker et al., 2000b). While Walker et al. (2000b) have reported good sensitivity at differentiating DLB from AD and healthy controls, Bradshaw et al. (2004) have only found low sensitivity for detecting cognitive fluctuations in DLB patients.
Building on these fluctuation scales, the Dementia Cognitive Fluctuation Scale is a more recently developed scale aiming to address some of the difficulties associated with previous fluctuation measures (Lee et al., 2014). It demonstrates good test-retest and inter-rater reliability and accurately distinguishes between LBD, AD, and vascular dementia, especially in patients with mild to moderate dementia (Lee et al., 2014). While the full version can be applied in research studies, a shorter four-item clinician version is envisaged to facilitate its use in clinical practice (Lee et al., 2014).
However, many challenges regarding the accurate clinical assessment of fluctuations still remain, and several studies have underscored the importance of developing more objective measures of cognitive fluctuations (Bonanni et al., 2015; Lee et al., 2012; Walker et al., 2000a).
1.2.3Symptomatic treatment of cognitive fluctuations
The prevalence of cognitive fluctuations in LBD patients and their negative impact on patient and carer quality of life highlights the need for targeted therapies; however, in the therapeutic armoury for LBD, they are something of a neglected symptom.
Acetylcholinesterase inhibitors have shown some efficacy in treating cognitive fluctuations. There is evidence for a role of donepezil (Onofrj et al., 2003) and galantamine (Edwards et al., 2007) in ameliorating clinical features of cognitive fluctuations and associated
electroencephalogram (EEG) abnormalities, while the benefit of rivastigmine and memantine in this regard is less certain (Stinton et al., 2015). Similarly, the finding that deep brain stimulation of the nucleus basalis of Meynert (NBM) stabilises alertness and other cognitive features in a PDD patient with cognitive fluctuations (Freund et al., 2009) suggests that this may be a potential therapeutic option. However, a more recent randomised clinical trial of NBM stimulation in patients with PDD did not find the same effects on cognition (Gratwicke et al., 2018). Following the conjecture that fluctuating cognition might be related to a disorder of sleep or arousal, there is encouraging preliminary evidence for the efficacy of modafinil and armodafinil even though numbers are limited (Varanese et al., 2013).
12
1.2.4Neural correlates of cognitive fluctuations in LBD
Cognitive fluctuations in LBD are likely to be attributable to a separate pathophysiological process from that driving the progressive cognitive decline, as these fluctuations, by nature, are transient and reversible. This hypothesis has been investigated using structural and
functional neuroimaging, as well as electrophysiological techniques. Tables 1.2 - 1.5 show an overview of studies that examined possible neural correlates of cognitive fluctuations in LBD using different neuroimaging methods.
Structural neuroimaging (Table 1.2)
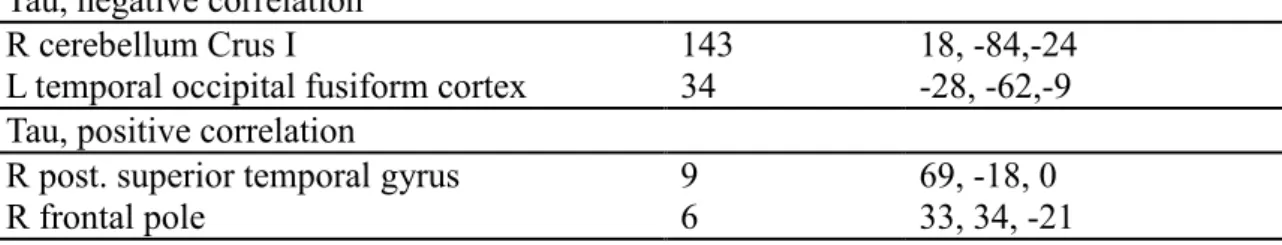
DLB and PDD are generally characterised by less severe structural abnormalities than AD with a relative preservation of the medial temporal lobe (Barber et al., 2000; Beyer et al., 2007; Burton et al., 2009, 2004, 2002; Mak et al., 2014; Takahashi et al., 2010; Tam et al., 2005; Watson et al., 2012). Nevertheless, a recent meta-analysis of voxel-based morphometry (VBM) studies identified consistent grey matter atrophy in the basal ganglia (putamen and globus pallidus), insular cortex, and lateral temporal areas in patients with DLB compared to controls (Zhong et al., 2014). There does not, however, appear to be a clear-cut structural correlate for cognitive fluctuations. No association was found between hippocampal (Elder et al., 2017; Kantarci et al., 2012), cerebellar (Colloby et al., 2014), anterior cingulate or insular (Blanc et al., 2016) grey matter volume and the severity of cognitive fluctuations. A possible contribution of thalamic structural abnormalities has been suggested based on the finding that thalamic atrophy is associated with the severity of attentional deficits in DLB (Watson et al., 2017). Suggesting an involvement of cholinergic structures in cognitive fluctuations, several studies have identified structural abnormalities within the substantia innominata of patients with DLB, which are more pronounced than in patients with AD (Colloby et al., 2017; Hanyu et al., 2007, 2005; Whitwell et al., 2007) and which are related to the severity of cognitive fluctuations (Colloby et al., 2017).
Subcortical and cortical white matter lesions are common in DLB patients (Bozzali et al., 2005; Kantarci et al., 2010; Sarro et al., 2017); however, there appears to be no correlation between the burden of white matter lesions and cognitive fluctuations (Kantarci et al., 2010; Sarro et al., 2017). White matter degeneration in the anterior thalamic radiation which has been observed in DLB is not correlated with fluctuation severity (Delli Pizzi et al., 2015a). Similarly, disturbances in the projections from thalamus to prefrontal and parieto-occipital cortices present in DLB do not correlate with cognitive fluctuation severity (Delli Pizzi et al., 2015b).
13
Table 1.2. Structural MRI studies of cognitive fluctuations.
Methods Participants Fluctuation
measure
Results
Kantarci et al. (2010) DTI 30 DLB, 30
AD, 60 HC
Mayo Elevated MD in amygdala and decreased FA in inferior longitudinal fasciculus in DLB compared to HC, but no difference between fluctuating and non-fluctuating DLB patients for these measures
Kantarci et al. (2012) VBM 21 DLB, 21
AD, 42 HC
Mayo No difference in hippocampal volume between DLB patients with and without cognitive fluctuations
Colloby et al. (2014) VBM 41 DLB, 48
AD, 39 HC
CAF Cerebellar grey matter loss in DLB compared to HC, but no significant correlations with CAF
Delli Pizzi et al. (2015a) DTI 14 DLB, 14
AD, 15 HC
CAF Degeneration of anterior thalamic radiation in DLB compared to HC, but no correlation with CAF
Delli Pizzi et al. (2015b) DTI 16 DLB, 16
AD, 13 HC
CAF Increased MD in thalamic regions projecting to prefrontal and parieto-occipital cortices in DLB compared to HC, but not correlated with CAF in DLB
Blanc et al. (2016) VBM 28 pDLB,
27 pAD, 33 HC
CAF Grey matter atrophy in insulae and anterior cingulate cortex in
prodromal DLB compared to HC, but not correlated with CAF in DLB
Colloby et al. (2017) VBM 41 DLB, 47
AD, 39 HC
CAF Bilateral grey matter atrophy in substantia innominata (SI) in DLB and AD compared to HC; negative correlation between right SI volume and CAF in DLB
Elder et al. (2017) cortical thickness
65 DLB, 76 AD, 63 HC
CAF Hippocampal atrophy less severe in DLB than in AD and not correlated with CAF in DLB
Sarro et al., (2017) cerebrovascular lesions
81 DLB, 240 AD
Mayo No difference in white matter hyperintensities between DLB patients with and without cognitive fluctuations
Watson et al. (2017) thalamic atrophy 35 DLB, 35 HC
attention task
Atrophy of left pulvinar and ventral lateral nucleus of the thalamus associated with impaired attentional function in DLB
AD, Alzheimer’s disease; CAF, Clinician Assessment of Fluctuation; DLB, dementia with Lewy bodies; DTI, diffusion tensor imaging; FA, fractional anisotropy; HC, healthy controls; Mayo, Mayo Fluctuation scale; MD, mean diffusivity; MRI, magnetic resonance imaging; pAD, prodromal AD; pDLB, prodromal DLB; SI, substantia innominata; VBM, voxel-based morphometry.
14
The lack of a clear structural correlate of cognitive fluctuations is not surprising given their transient and reversible nature, and the fact that Lewy body pathology has been shown to have little direct involvement in cerebral atrophy (Burton et al., 2009; Mak et al., 2015a, 2015b). It has therefore been suggested that cognitive fluctuations might arise from large-scale
functional network perturbations within the brain. These can be assessed by functional neuroimaging and electrophysiological methods as discussed in the following paragraphs.
Functional neuroimaging (Table 1.3)
A potential involvement of attentional networks in cognitive fluctuations has been
investigated through functional connectivity analyses at rest and during task performance using functional magnetic resonance imaging (fMRI). In patients with DLB, Peraza et al. (2014) have identified a desynchronisation of several cortical and subcortical areas related to the left fronto-parietal attention network which was associated with the severity and
frequency of cognitive fluctuations. Similarly, Franciotti et al. (2013) have found that
functional connectivity between right middle frontal gyrus and right lateral parietal cortex was negatively correlated with fluctuation severity in DLB. Furthermore, attention network
connectivity has been found to be decreased in LBD compared to control participants during the execution of an attention task; however, this was not related to the severity of cognitive fluctuations in the patient groups (Kobeleva et al., 2017). A possible relation between
cognitive fluctuations and aberrant connectivity in basal ganglia and limbic networks has also been reported (Lowther et al., 2014).
Another neural network potentially involved in cognitive fluctuations is the default mode network (DMN) which is active in resting conditions, but deactivated during task performance (Binder et al., 1999; Buckner, 2005; Gusnard and Raichle, 2001). However, data to support this concept are conflicting. One resting-state fMRI study reported reductions in DMN functional connectivity in patients with DLB compared to AD patients and controls (Lowther et al., 2014) whereas others showed increased DMN connectivity (Kenny et al., 2012) or did not find any evidence for connectivity alterations within the DMN (Galvin et al., 2011; Peraza et al., 2014). In particular, Franciotti et al. (2013) have found no evidence for a correlation between DMN abnormalities and cognitive fluctuations in DLB; even in patients with severe fluctuations, the DMN appeared to be intact, indicating that changes within the DMN alone cannot account for cognitive fluctuations in DLB.
A more intricate explanation may lie in the interplay between attentional and default mode networks which is important for attentional performance (Sonuga-Barke and Castellanos, 2007; Weissman et al., 2006). In support of this, several studies have found
15
Table 1.3. Functional MRI and MRS studies of cognitive fluctuations.
Methods Participants Fluctuation
measure
Results Sauer et al. (2006) Attention
task-fMRI
9 DLB, 10 AD, 13 HC
attention task
Reduced attention task-related deactivation of the DMN in both AD and DLB
Franciotti et al. (2013) Rest-fMRI, seed analysis
18 DLB, 18 AD, 15 HC
CAF No evidence of resting-state DMN disruption in presence of cognitive fluctuations
Lowther et al. (2014) Rest-fMRI, dual regression
15 DLB, 13 AD, 40 HC
CAF Positive correlation between basal ganglia and limbic network connectivity and CAF in DLB
Peraza et al. (2014) Rest-fMRI, dual regression
16 DLB, 17 HC
CAF Positive correlation of connectivity within left fronto-parietal network clusters in pallidum, lingual gyrus, and putamen with CAF in DLB
Peraza et al. (2015b) Rest-fMRI, graph theory
18 DLB, 19 AD, 17 HC
CAF Positive correlation between normative path length and CAF in DLB
Peraza et al. (2016) Rest fMRI, ReHo
19 DLB, 18 AD, 16 HC
CAF No significant correlations between ReHo abnormalities and CAF in DLB
Kobeleva et al. (2017) Attention task-fMRI
30 LBD, 20 AD, 21 HC
CAF, Mayo
Attention network connectivity reduced in LBD compared to HC, but no significant correlations with CAF or Mayo scores in LBD Chabran et al. (2018) Visuoperceptual
task-fMRI
26 DLB, 29 AD, 22 HC
CAF Positive correlation between DMN synchronisation with task paradigm and CAF in DLB
Graff-Radford et al. (2014) MRS 34 DLB, 35
AD, 148 HC
Mayo No difference in metabolites in frontal, posterior cingulate, and occipital regions between DLB with and without fluctuations
Delli Pizzi et al. (2015b) MRS 16 DLB, 16
AD, 13 HC
CAF Increase in tCho/tCr in right thalamus in DLB compared to AD, this increase positively correlates with CAF
Su et al. (2016) MRS 35 DLB, 36
AD, 35 HC
CAF Negative correlation between hippocampal NAA/Cr levels and CAF in DLB
AD, Alzheimer’s disease; CAF, Clinician Assessment of Fluctuation; CRT, choice reaction time; DLB, dementia with Lewy bodies; DMN, default mode network; fMRI, functional magnetic resonance imaging; HC, healthy controls; LBD, Lewy body dementia; Mayo, Mayo Fluctuation scale; MRS, magnetic resonance spectroscopy; NAA/Cr, N-acetyl-aspartate/total creatine ratio; ODFAS, One Day Fluctuation Assessment Scale; ReHo, regional homogeneity; rest-fMRI, resting-state fMRI; RT, reaction time; tCho/tCr, total choline/total creatine ratio.
16
abnormalities in the dynamic synchronisation between default mode and attention networks during the execution of an attention task in patients with LBD (Chabran et al., 2018; Firbank et al., 2018, 2016; Kobeleva et al., 2017; Sauer et al., 2006). In particular, Chabran et al. (2018) have shown that disturbances in the task-related modulation of DMN activity are associated with the severity of cognitive fluctuations, suggesting that a disturbance of the dynamic switching between task-positive and default mode networks might be related to cognitive fluctuations in DLB.
Global network measures, analysing the brain’s functional connectivity by means of graph theory, have identified a correlation between the severity of cognitive fluctuations and an increase in path length (i.e. less efficient network topography) in DLB (Peraza et al., 2015b). However, this might be a more general marker of disease severity given the relationship between these graph measures and more general markers of cognitive impairment (Peraza et al., 2015b). A study of regional homogeneity measuring local functional connectivity identified DLB-related changes in sensory-motor and temporal regions (Peraza et al., 2016); however, no correlation was found between these regional abnormalities and cognitive
fluctuation severity, supporting, indirectly, the hypothesis that cognitive fluctuations might be related to perturbations in large-scale functional networks rather than local changes in
connectivity.
Magnetic resonance spectroscopy (Table 1.3)
Magnetic resonance spectroscopy (MRS) can be used to characterise biochemical changes in the brain quantitatively assessing in-vivo levels of several metabolites such as
N-acetylaspartate/creatine (NAA/Cr) which is considered to be a marker of neuronal integrity and is commonly reduced in AD patients (Kantarci and Graff-Radford, 2013). While NAA/Cr levels have been found to be reduced in occipital regions in patients with DLB, there does not appear to be a difference in NAA/Cr levels between DLB patients with fluctuations compared to DLB patients without fluctuations in frontal, posterior cingulate, and occipital regions (Graff-Radford et al., 2014a). However, using a whole-brain approach instead of restricting their analysis to a priori defined regions, Su et al. (2016)identified a negative correlation between hippocampal NAA/Cr levels and cognitive fluctuation severity in DLB, indicating that neuronal changes within the hippocampus might play a role in cognitive fluctuations in DLB. Furthermore, higher choline/creatine levels as measured by MRS have been observed in the thalamus of DLB patients compared to controls. This increase correlated with fluctuation frequency and severity, suggesting that neurochemical imbalances within the thalamus might be involved in the aetiology of cognitive fluctuations in DLB (Delli Pizzi et al., 2015b).
17
Radionuclide imaging (Table 1.4)
Occipital hypoperfusion/hypometabolism has been consistently shown in patients with DLB compared to patients with AD and healthy controls (Colloby et al., 2002; Imamura et al., 1999; Ishii et al., 1998; Kantarci et al., 2012; Lobotesis et al., 2001; Minoshima et al., 2001; Perneczky et al., 2008; Sato et al., 2007; Shimizu et al., 2005; Yoshida et al., 2015). This deficit in blood perfusion and energy metabolism affects primary visual as well as visual association areas and the precuneus (Kemp et al., 2005; Mito et al., 2005), and can already be identified at the prodromal stage of DLB (Fujishiro et al., 2013). Several studies suggest that metabolic and perfusion changes might be related to the severity of cognitive fluctuations in LBD: Osaki et al. (2005) have found hypoperfusion in bilateral parietal association areas, medial parietal, and dorsal occipital lobes in PDD patients with cognitive fluctuations compared with non-fluctuators. Similarly, a reduction in occipital metabolism was reported for fluctuating compared to non-fluctuating DLB patients (Kantarci et al., 2012). In a longitudinal study, O’Brien et al. (2005) have found a decrease in occipital perfusion and an increase in thalamic perfusion to be associated with an increase in fluctuation severity over the course of one year.
Metabolism within the posterior cingulate cortex which is markedly affected in AD is
normally preserved in DLB (the so-called cingulate island sign) (Graff-Radford et al., 2014b; Iizuka and Kameyama, 2016; Lim et al., 2009; O’Brien et al., 2014), suggesting that this does not affect cognitive fluctuations (Iizuka and Kameyama, 2016). In addition to the fMRI studies discussed above, more evidence for an involvement of complex functional network perturbations in cognitive fluctuations is provided by a perfusion single photon emission computed tomography (SPECT) study observing aberrant perfusion in an interconnected series of structures mainly in parietal and motor areas (including basal ganglia) which was found to be correlated with the severity of cognitive fluctuations (Taylor et al., 2013). Even though PET and SPECT studies have consistently identified a relative loss of
dopaminergic neurons within the substantia nigra in LBD (Colloby et al., 2004; Marquie et al., 2014; McKeith et al., 2007; O’Brien et al., 2004; Walker et al., 2002), results regarding an association between dopamine abnormalities and fluctuation severity in LBD are conflicting. While two studies did not see a difference in striatal dopamine transporter density between DLB patients with cognitive fluctuations compared to those without fluctuations (Shimizu et al., 2017; Ziebell et al., 2013), a third study identified a significant negative correlation between striatal dopamine transporter density and cognitive fluctuation severity in DLB
18
Table 1.4. PET and SPECT studies of cognitive fluctuations.
Methods Participants Fluctuation
measure
Results O’Brien et al. (2005) Perfusion SPECT 14 DLB, 15
PDD
CAF Increase in CAF over one year associated with increased thalamic and decreased inferior occipital perfusion
Osaki et al. (2005) Perfusion SPECT 10 PDD, 20 PD
absent/ present
Hypoperfusion in bilateral parietal association areas, medial parietal, and dorsal occipital lobes in fluctuators compared to non-fluctuators
Foster et al. (2010) Amyloid PET 6 DLB, 15
PDD, 9 PD-MCI, 9 HC
Mayo No difference in Mayo fluctuation score between amyloid-positive compared to amyloid-negative LBD patients
Kantarci et al. (2012) Amyloid PET, FDG-PET
21 DLB, 21 AD, 42 HC
Mayo No difference in amyloid burden between fluctuating and non-fluctuating DLB patients; occipital FDG uptake lower in non-fluctuating than in non-fluctuating DLB patients
Taylor et al. (2013) Perfusion SPECT 19 DLB, 23 AD
CAF, CRT task
Positive correlation between DLB-cognitive motor pattern
(characterised by increased perfusion in cerebellum, basal ganglia, and supplementary motor area and decreased perfusion in parietal regions) and CAF and CRT task variability
Ziebell et al. (2013) DAT-SPECT 51 DLB, 28
HC
absent/ present
No difference between fluctuating and non-fluctuating DLB patients in DAT density in striatum, caudate, and putamen Iizuka and Kameyama
(2016)
FDG-PET, DAT-SPECT
24 DLB, 24 AD
CAF Negative correlation between striatal DAT density and CAF in DLB; no correlation between cingulate island sign ratio and CAF in DLB
Shimizu et al. (2017) DAT-SPECT 133 DLB, 95
AD
absent/ present
No difference in striatal DAT binding between fluctuating and non-fluctuating DLB patients
Donaghy et al. (2018) Amyloid PET 37 DLB, 20 AD, 20 HC
CAF No difference in CAF between positive and amyloid-negative DLB patients and no correlation between amyloid burden and CAF in DLB
AD, Alzheimer’s disease; CAF, Clinician Assessment of Fluctuation; CRT, choice reaction time; DAT, dopamine transporter; DLB, dementia with Lewy bodies; FDG-PET; fluorodeoxyglucose PET; HC, healthy controls; LBD, Lewy body dementia; Mayo, Mayo Fluctuation scale; MCI, mild cognitive impairment; PDD, Parkinson’s disease dementia; PET, positron emission tomography; SPECT, single photon emission computed tomography.