Toward Interpretable Machine Learning Models for
Materials Discovery
Paulius Mikulskis, Morgan R. Alexander, and David Alan Winkler*
Machine learning (ML) and artificial intelligence (AI) methods for modeling useful materials properties are now important technologies for rational design and optimization of bespoke functional materials. Although these methods make good predictions of the properties of new materials, current modeling methods use efficient but rather arcane (difficult-to-interpret) mathematical features (descriptors) to characterize materials. Data-driven ML models are considerably more useful if more chemically interpretable descriptors are used to train them, as long as these models also accurately recapitulate the properties of materials in training and test sets used to generate and validate the models. Herein, how a particular type of molecular fragment descriptor, the signature descriptor, achieves these joint aims of accuracy and
interpretability is described. Seven different types of materials properties are modeled, and the performance of models generated from signature descriptors is compared with those generated by widely used Dragon descriptors. The key descriptors in the model represent functionalities that make chemical sense. Mapping these fragments back on to exemplar materials provides a useful guide to chemists wishing to modify promising lead materials to improve their properties. This is one of thefirst applications of signature descriptors to the modeling of complex materials properties.
1. Introduction
Quantitative structure–property relationship (QSPR) methods have been highly successful in predicting useful properties of small molecules and, increasingly, more complex materials.[1] Originally developed for drug and agrochemical discovery, these methods (also known as quantitative structure–activity
relationships [QSARs]) were initially used to understand the underlying molecular interactions of drugs, particularly where the exact mechanisms of action were unclear or very complex. As the field evolved, QSPR modeling expanded to embrace essentially two broad aims: gen-erating models with high property predic-tion power, usually at the expense of chemical interpretability, and explaining structure–property relationships where the interpretability of the model is the most important goal and generating accu-rate predictions for a diverse range of molecules which is secondary. After almost 60 years, these complementary goals are still not fully appreciated by practitioners. A recent article provides a detailed discussion on this topic.[2] Until recently, the mathematical descrip-tors that were used to generate models meant that model predictive power and model interpretability remained essen-tially orthogonal.
QSPR models are generated using machine learning (ML) or other statistical methods, with neural networks and deep learning methods being particularly prominent currently. These very effective, data-driven methods have been enthusiastically adopted by many
fields, including, recently, materials science.[1,3]Rapid develop-ments in technologies for automated synthesis and characteriza-tion of complex materials are providing rich data sets that are well matched to ML modeling. A recent comprehensive review
Dr. P. Mikulskis, Prof. M. R. Alexander, Prof. D. A. Winkler School of Pharmacy
University of Nottingham Nottingham NG7 2RD, UK E-mail: [email protected] Prof. D. A. Winkler
Monash Institute of Pharmaceutical Sciences Monash University
Parkville 3052, Australia
The ORCID identification number(s) for the author(s) of this article can be found under https://doi.org/10.1002/aisy.201900045. © 2019 The Authors. Published by WILEY-VCH Verlag GmbH & Co. KGaA, Weinheim. This is an open access article under the terms of the Creative Commons Attribution License, which permits use, distribution and reproduction in any medium, provided the original work is properly cited.
DOI: 10.1002/aisy.201900045
Prof. D. A. Winkler
La Trobe Institute for Molecular Science La Trobe University
Kingsbury Drive, Bundoora 3086, Australia Prof. D. A. Winkler
CSIRO Manufacturing Clayton 3168, Australia
describes how thisfield is evolving[1]and how new deep learning methods have provided additional impetus to thefield.[4]
In a very similar way to modeling of small molecule drugs, QSPR can generate mathematical relationships between materi-als in a training data set (where their relevant molecular or phys-icochemical properties are represented by mathematical entities called descriptors) and some useful property of interest, such as the hydrogen uptake of a porous material,[5]bacterial attachment to a polymer,[6] or performance as a “green” corrosion inhibi-tor.[7] The most important element in finding useful property models is how the microscopic/molecular and physicochemical properties of complex materials in a data set are described using mathematical descriptors. It has been shown that the quality and relevance of descriptors is the single most important factor in the success of modeling structure–property relationships in materi-als (and in small, organic, and bioactive molecules).[8]The types of descriptors used to generate models are almost always more important than the type of the ML method used tofind structure– property relationship models.
There are many kinds of descriptors: e.g., constitutional, topo-logical, electronic, quantum chemical, and fingerprint. These have been developed over several decades for modeling the prop-erties of pharmaceutical and agrochemical bioactive molecules and have been adopted by the materials science community more recently as the simplest way of describing complex materials. For example, the Dragon program[9]can calculate5000 molecular descriptors, some of which are easy to interpret, but the majority are quite arcane and almost impossible to understand in terms of chemical structure. It is becoming clear that more appropriate, specialized descriptors for diverse types of materials are urgently needed because materials are always more complex than individ-ual small molecules, and models need to be interpretable if they are to provide guidance to chemists synthesizing new mate-rials with improved properties. Having an easy-to-understand predictive model helps communicatefindings to synthetic chem-ists and materials scientchem-ists and may provide insight into possi-ble mechanisms underlying the properties of materials. Clearly, new types of descriptors must also allow models derived from them to make accurate quantitative predictions of useful materials properties, thus accelerating materials discovery and optimization.
A significant volume of research is now directed to this prob-lem, with most effort being focused on the pharmaceutical arena. Recent reviews have described new types of descriptors for small molecules that have a higher degree of interpretability than tra-ditional descriptors.[10]In this article, we have used some of these promising descriptors to model a range of diverse materials property data sets. Our aim was to assess whether they have
suf-ficient predictive power and interpretability to make significant impact on ML-based modeling of complex materials property data sets now appearing in increasing numbers in the literature. Topological descriptors, generated from the chemical graph of a molecule or material, have attracted renewed attention as effec-tive and informaeffec-tive descriptors. In their simplest form, they describe the number of atoms, atom types and hybridizations, bond types, paths, connectivities, etc. A recent and more refined class of topological descriptors, signature descriptors[11] (now updated to handle stereochemistry[12]), have been shown to be effective at building robust models and are more chemically
interpretable than many other types of descriptors. They have been used successfully in a range of drug discovery applications due to their inherent ability to be mapped back to chemical struc-tures to provide clear guidance to chemists as to which function-alities in molecules contribute to, or detract from, desired biological responses.[13]
Here, we applied signature descriptors to modeling a range of properties of more complex functional materials. We demon-strate their ability to generate predictive and interpretable QSPR models using seven diverse materials data sets. We com-pare the prediction efficiency of these models to QSPR models generated by conventional descriptors reported in the literature or generated in our study. We also describe how signature descriptors can be mapped back into lead materials to guide future improvements of their properties. To our knowledge, this is one of thefirst signature descriptor applications in thefield of complex materials property modeling.[14]
2. Results
Seven data sets having diverse structures and properties were used to analyze the ability of signature descriptors to generate highly predic-tive models. These data sets were aqueous solubility (AQSOL)[15]of low-molecular-weight organic molecules (an important pharma-cological property), polymer water contact angle (WCA, a useful experimental measure of surface wettability), glass transition temperature (Tg) of polymers (a measure of polymerflexibility and processability), polymerfibrinogen adsorption (Fib) (ability of surfaces to attach proteins, measured by immunofl uores-cence),[16]and attachment of three common hospital pathogens
(Staphylococcus aureus [SA], Pseudomonas aeruginosa [PA], and
uropathogenicEscherichia coli [UPEC]) to the surfaces of poly-mers (highly desirable for implantable and indwelling medical device coatings).[17] Section 5 summarizes the seven data sets and the diverse chemical structures and properties that were used to analyze the ability of signature descriptors to generate robust, predictive models of these properties. Signature descrip-tors, also described in detail in Section 5, are generated from “signatures” of atoms in materials (polymers in this instance) or other molecules. They are representations of the connected environment of the atom up to a predefined depth d. That is, signature descriptors are generated from all possible fragments in a molecule, enumerated at each atomic position, that contain atoms attached to it along paths up to lengthd(denoted as topo-logical lengthd). This study represented polymer structures by their monomers, an approximation that has been shown to gen-erate very good models of polymer structure–property relation-ships in published studies.[1,6,18]
The statistics for linear and nonlinear models of the seven mate-rials properties, generated from traditional molecular descriptors (the widely used Dragon package) and signature descriptors, are summarized inTable 1and2. The linear models used multiple linear regression (MLR) with an expectation maximization (EM) algorithm using a sparsity-inducing Laplacian prior to select-ing optimal subsets of descriptors. This is referred to here as MLREM models. Details of the algorithm are listed in Section 5. The results show that the models trained on signature descrip-tors are at least as accurate at predicting materials properties than
models trained on conventional, efficient, but arcane Dragon molecular descriptors. Differences between the standard errors of prediction (SEP) for properties of test set materials, calculated by signature and Dragon descriptors, were negligible for all data sets.
A major advantage of the signature descriptors is the ability to map them back onto molecules or materials in the data set to understand what molecular features increase or decrease the property under study. The identity and contributions of the most relevant signature descriptors depend on the property being modeled, whether linear regression or nonlinear models are used, and at what point an ML nonlinear response surface is con-sidered. In the seven properties modeled in the following, we illustrate the most important descriptors by mapping back onto exemplar materials those that are most responsible for an increase or decrease in the modeled property.
2.1. Aqueous Solubility
AQSOL is a very important property for small organic drug can-didates and is a very common property for benchmarking model and descriptor performance. There is a relationship between AQSOL and polar properties of molecules (usually described by the log of the octanol–water partition coefficient, logP), given by the General Solubility Equation.[19]Contact angle is also often
an important surface property for materials, such as polymers, used in biology and medicine.[20]Contact angle is also dependent on polar properties of surfaces and is a relatively simple way to measure hydrophobicity and hydrophilicity.
Numerous models that predict AQSOL have been reported in the literature (see a previous study[21]). Although small organic molecules are not normally thought of as complex materials, we use these data as a baseline test of the ability of signature descriptors to model this very important property for a very diverse data set with a high dynamic range of property values. The interpretability of the model is not as relevant for this property as for the others, as the chemical diversity of the training data set is high and AQSOL is not modulated by specific biological/ protein target interactions, like most of the other data sets. Clearly, the AQSOL model derived from signature descriptors could predict the properties of the training and test set with good
fidelity with r2 values of 0.91 and 0.88 and standard errors of 0.62 and 0.72 logS for the training and test sets, respectively (seeFigure 1). This is comparable with one of the most compre-hensive and accurate AQSOL models in the recent literature,[21] trained on Dragon descriptors, where test set predictions had
r2values of 0.90 and SEP values of 0.67 for almost 5000 organic molecules. More recently, Raevsky et al. reported an AQSOL model for a smaller data set of 387 small organic compounds that predicted solubilities of compounds in the test set with
r2values between 0.71 and 0.74 and SEP values of 0.72–0.77 logS. The predictions of the model trained on Dragon descrip-tors for this smaller data set are very similar to those of the signature descriptors models and the larger published solubility models. The small number of neurons in the hidden layer, and the relatively good performance of the MLR model (Table 1 and 2), suggests that the relationship between AQSOL and signature descriptors is relatively linear. Given the experimental uncertainties in AQSOL measurements, primarily the existence of polymorphs, and differences between kinetic and thermodynamic solubilities,[21]the predictive power of these models is excellent.
Given the very high diversity of the small molecules in the data set, the fact that the signature descriptors chosen for the models was uniformly small, and there being nonspecific interactions involved in solubility, it was not appropriate to map the most relevant descriptors back to the constituent molecules in the
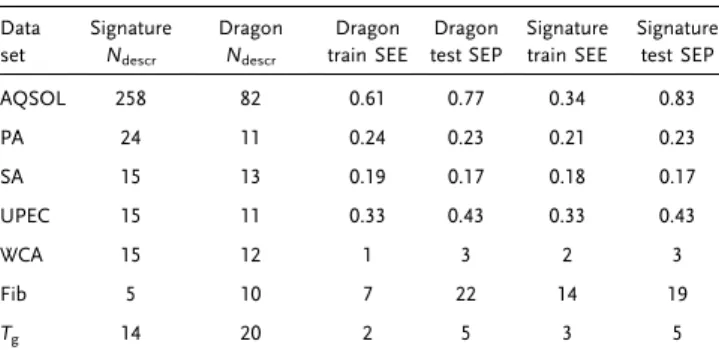
Table 1.Summary of MLREM model performance trained with signature descriptors in predicting training and test set properties. SEE for training set and SEP for the test set.
Data set Signature Ndescr Dragon Ndescr Dragon train SEE Dragon test SEP Signature train SEE Signature test SEP AQSOL 258 82 0.61 0.77 0.34 0.83 PA 24 11 0.24 0.23 0.21 0.23 SA 15 13 0.19 0.17 0.18 0.17 UPEC 15 11 0.33 0.43 0.33 0.43 WCA 15 12 1 3 2 3 Fib 5 10 7 22 14 19 Tg 14 20 2 5 3 5
Table 2.Performance of BRANNGP models trained using signature descriptors on ability to recapitulate the properties of materials in the training and test sets. Pearson’s correlation coefficients for training and test setsr2
trainandr2test. Standard errors for training set SEE and test set SEP.Nhiddenis the
number of hidden layer neurons in the neural network, andNeffis the number of effective parameters in neural network after regularization. Dragon
descriptor model statistics for PA, SA, UPEC from Epa et al.[18a]
Data set Nhidden Neff r2
train r2test SEE SEP
Dragon Signature Dragon Signature Dragon Signature Dragon Signature Dragon Signature Dragon Signature
AQSOL 4 2 196 251 0.95 0.97 0.88 0.91 0.48 0.39 0.73 0.65 PA 2 2 22 40 0.84 0.88 0.87 0.84 0.17 0.17 0.16 0.20 SA 3 3 18 45 0.85 0.85 0.85 0.80 0.12 0.12 0.12 0.15 UPEC 4 4 11 29 0.58 0.89 0.73 0.70 0.43 0.21 0.48 0.39 WCA 5 4 15 41 0.99 0.99 0.95 0.95 1 1 2 2 Fib 2 2 5 25 0.99 0.98 0.97 0.96 3.8 4.5 5.8 6.5 Tg 2 2 14 7 0.90 0.98 0.84 0.96 6 3 9 4
training set in this case.Table 3lists the contributions various molecular fragments make to the MLR solubility model. Clearly, the more hydrophobic fragments reduce solubility and hydrophilic fragments increase solubility, consistent with the General Solubility Equation.
2.2. Pathogen Attachment
Materials that resist pathogen attachment are very useful for implantable and indwelling medical devices. We modeled patho-gen attachment for three important hospital-acquired infection agents, SA, PA, and UPEC. Sparse feature selection methods[22] reduced the number of descriptors from around 837 (signature) and 1645 (Dragon) to between 11 and 24, depending on the path-ogen and descriptor set (Table 1 and 2). The abilities of the models derived from signature descriptors to predict pathogen attachment in training and test sets are summarized inFigure 2. Robust, pre-dictive models with small SEP were obtained for attachment of all three pathogens to a large polymer library. As Table 2 shows, the accuracies of attachment predictions for the three pathogens are similar for models generated using signature descriptors and tra-ditional Dragon descriptors.
The same data set was previously modeled by Epa et al.[18a] using Dragon descriptors, and the statistics are reported in Table 1 and 2. Pathogen attachment models derived from signa-ture descriptors required fewer neurons in the hidden layer (2–4) compared with (7–8) with the Dragon descriptors, although
fewer Dragon descriptors (15–25) than signature descriptors (29–40) were required by models of PA, SA, and UPEC attach-ment to polymers.
Ther2values for the prediction of the training set data for the PA, SA, and UPEC pathogen attachment models derived from sig-nature descriptors were 0.88, 0.85, and 0.89 logF, similar to or bet-ter than the standard errors of estimation (SEE) values of 0.88, 0.87, and 0.58 logF for the models reported by Epa et al. The SEE for the training set predictions for the signature descriptor-derived models are 0.17, 0.12, and 0.43 logF, compared with 0.17, 0.12, and 0.30 logF from the literature models using Dragon descriptors for PA, SA, and UPEC, respectively.
Crucially, ther2values for prediction of pathogen attachment to polymers in the test sets by the signature descriptor-based models were 0.84, 0.80, and 0.70, similar to values of 0.87, 0.85, and 0.73 logF reported by Epa et al. for PA, SA, and UPEC, respectively. SEP values were 0.20, 0.15, and 0.39 logF for models trained on signature descriptors; again, similar SEP values for the literature models derived from Dragon descriptors were 0.16, 0.12, and 0.48 logF. As the UPEC attach-ment model is generated from the smallest data set with higher experimental error, it is more sensitive to how the test and train-ing sets are selected.
AsTable 4shows, the specific chemical fragments with great-est influence on attachment are similar for all three pathogens. The magnitude of the contribution to attachment varies for each species, but similar types of chemistries show up consistently as favoring or disfavoring attachment and biofilm formation. This is particularly evident with PA and SA, which have more similar signature profiles than UPEC. Previous studies on these bacteria that generated a single multipathogen model showed that PA and SA behave similarly, whereas UPEC has significantly weaker attachment to polymer libraries. Mapping back these fragments onto exemplar polymers illustrates the higher chemical interpret-ability of the fragments.
2.3. Water Contact Angle (WCA)
WCA measured in air is an important parameter for determining the wettability of surfaces and can be used to predict a selection of performance attributes, such as protein adhesion to synthetic
Figure 1. Prediction of logS for training set compounds (left) and test set compound (right) by the neural network model using signature descriptors.
Table 3. Signature descriptors with the greatest impact on AQSOL, negative MLR coefficients reduce solubility, and positive MLR coefficients increase solubility.
Signature descriptor MLR weights Signature descriptor MLR weights
C═C 0.52 O═P þ0.07 C(CC) 0.44 C(C═CS) þ0.07 Cl 0.39 C═O þ0.08 S 0.21 O(C) þ0.22 C(C═C)C(C═C) 0.15 C(C) 0.14
and biological substrates. As Table 1 and 2 show, this property can be predicted with high fidelity by models trained with Dragon and signature descriptors. WCAs for materials in the test set can be predicted with errors (SEP) of 1–2 by the nonlinear Bayesian regularized artificial neural networks with a Gaussian prior (BRANNGP) models and within 2–3by linear models trained on either descriptor class. For comparison, Smith et al. published an ML model of WCA using the same data but different types of descriptors.[23]Their model predicted the WCA of polymers in the training set with anr2value of 0.95 and of
polymers in the test set with anr2value of 0.91 (no standard errors were provided in this article). This compares with values of 0.99 and 0.95 for models calculated using signature descrip-tors in this work. The quality of the prediction of WCAs of poly-mers in the training and tests sets is shown inFigure 3.
The contributions of the most important signature descriptors to the contact angle models are shown inTable 5. Again, and broadly, molecular fragments containing more polar fragments (e.g., ester, polyethylene glycol (PEG), and carboxylic acid) reduce the contact angle, and those that are more hydrophobic
Figure 2.Measured vs predicted pathogen attachment (logF) training (left panels) and test set (right panels) polymers by the neural network model using signature descriptors. Pathogen attachment predictions for a) PA, b) SA, and c) UPEC.
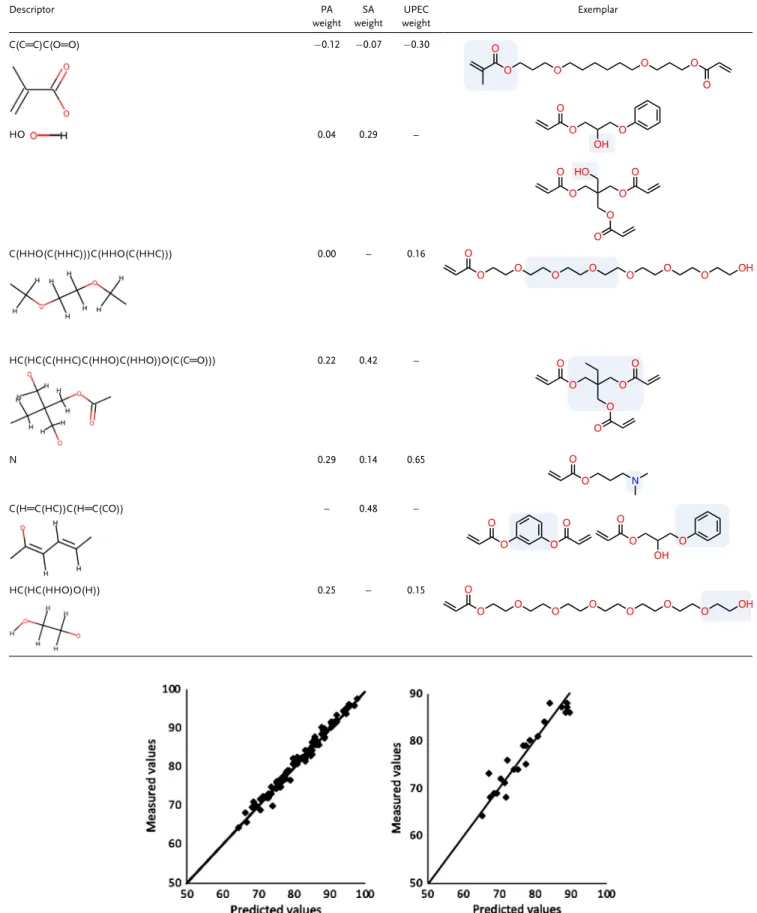
Table 4. Signature descriptors with the greatest impact on pathogen attachment to polymer surfaces, negative MLR coefficients reduce attachment, and positive MLR coefficients increase attachment. The blue boxes show where the significant fragment is located in an example monomer.
Descriptor PA weight SA weight UPEC weight Exemplar C(HHCC) – – 0.26 HC(HC(C(HHH)C(HHH)C(HHO))O(C(C═O))) 0.37 0.14 0.20 C═O – – 0.18 O(HC(HHC(CCC))) 0.31 0.18 – C(HHC)C(HHC) 0.30 0.19 0.10 HC(COO) 0.24 0.10 0.14 C(HHHO) 0.22 0.14 – O(C(C═C)C(C═O)) 0.16 0.30 0.12 C(H═C(HC))C(H═C(CC)) 0.15 0.35 –
Table 4. Continued. Descriptor PA weight SA weight UPEC weight Exemplar C(C═C)C(O═O) 0.12 0.07 0.30 HO 0.04 0.29 – C(HHO(C(HHC)))C(HHO(C(HHC))) 0.00 – 0.16 HC(HC(C(HHC)C(HHO)C(HHO))O(C(C═O))) 0.22 0.42 – N 0.29 0.14 0.65 C(H═C(HC))C(H═C(CO)) – 0.48 – HC(HC(HHO)O(H)) 0.25 – 0.15
Table 5. Signature descriptors with the greatest impact on WCA, negative MLR coefficients reduce WCA, and positive MLR coefficients increase WCA. The blue boxes show where the significant fragment is located in an example monomer.
Descriptor Weights Exemplar/Description
C(CC)C(O) 0.18
C(O)C(O) 0.13
C(C(C(C)))C(C(C(O═O))) 0.13
C(CCC) 0.11
C(C(C))C(C(C(O))) 0.26
(long-chain alkyl or alkyl ether) increase it, in accordance with chemical intuition. The very significant contribution of the C signature (the number of aliphatic carbon atoms) also correlates with the role hydrophobicity plays in WCA.
2.4. Fibrinogen Attachment
Surface chemistry, topography, and wettability are important materials properties controlling attachment of proteins to syn-thetic surfaces, such as nanoparticles or synsyn-thetic polymers, thereby modulating their interactions with biology. Fibrinogen is a prototype protein used to indicate the degree of affinity of synthetic materials for proteins. As Table 1 and 2 show, the sig-nature descriptors generated robust models with very high pre-diction accuracy for materials in the training and test sets, comparable in prediction accuracy for the test set to models trained using traditional Dragon descriptors. Like WCA,fi brino-gen attachment appears to be relatively easy to predict, as the neural network model was quite sparse, using onlyfive signature descriptors and two nodes in the hidden layer. The statistics for the prediction of the training and test sets were very good with
r2values of 0.98 and 0.96, respectively, and SEE values of 4.5% for the training set and 6.5% for the test set. This is very similar to test set SEP values of 3.8% (training set) and 5.8% (test set) SEP values for models trained using Dragon descriptors. For comparison, Smith et al. reported a QSAR model offibrinogen attachment using the same data and different descriptors that predicted the % attachment to polymers in the training set with anr2value of 0.86 and to polymers in the test set with anr2of 0.76.[23] No SEP were reported. The performance of the BRANNGP model, trained using signature descriptors, in pre-dicting the properties of polymers in the training and test set, is shown inFigure 4.
The signature descriptors that contribute most to thefi brino-gen attachment model reveal a more subtle structure–activity story than the WCA and AQSOL models (Table 6). Long-chain fatty-acid moieties (signature C(C(C))C(O═O)) have the greatest impact on reducing the attachment (after the relatively uninfor-mative signature counting the number of aliphatic carbon atoms, again a surrogate for lipophilicity). There are only two key
signatures that make the largest contribution to the increase in protein attachment, short ether or ester fragments, and their slightly longer branched versions.
2.5. Glass Transition Temperature (Tg)
The glass transition temperature is a fundamental property of polymers that relates to their processability. Previous studies have shown that molecularflexibility is an important factor con-trolling theTg. While signature descriptors do not encode molec-ular flexibility explicitly, the bonding in some fragments may implicitly code for a degree of flexibility (e.g., as the number of single bonds in the fragment). It might be expected, in this specific case, that including a more direct measure of molecular
flexibility (e.g., number of rotatable bonds,Nrot) in the descrip-tors used in the model may improve the performance on the test set. Using signature descriptors alone generates models that pre-dict the training set with anr2value of 0.81 and SEE of 8for the training set predictions andr2value of 0.68 and SEP value of 11
for the test set predictions. When a descriptor encoding molecu-larflexibility,Nrot, is added to the models, their prediction accu-racy improves markedly. The training and test set r2 values increase to 0.98 and 0.96, and standard errors fall to 3 and 4, respectively. As with fibrinogen attachment and WCA, Smith et al. published an ML model ofTgusing the same data but different types of descriptors.[23]Their model predicted the
Tgof polymers in the training set with anr2value of 0.96 and of polymers in the test set with anr2value of 0.95 (no standard errors were provided). The measured versus predicted values ofTgfor both sets from the BRANNGP model are summarized inFigure 5.
The signature descriptors making the largest positive or negative contributions toTgare listed inTable 7. It is clear that fragments with larger numbers of rotatable bonds (PEGs and longer-chain alkyl ethers) reduce theTgvalue, whereas branched fragments and those able to undergo inter- or intramolecular interactions by hydrogen bonding, ionic interactions, etc. (short dicarboxylic acids and short branched ethers or esters) will tend to increase theTg.
Figure 4.Prediction offibrinogen attachment of polymers (% attachment relative to polypropylene control) in training set (left) and test set (right) by the neural network model using signature descriptors.
Table 6. Signature descriptors with the greatest impact onfibrinogen attachment, negative MLR coefficients reduce attachment, and positive MLR coefficients increase attachment. The blue boxes show where the significant fragment is located in an example monomer.
Descriptor Weights Exemplar
C 0.81 –
C(C(C))C(O═O) 0.25
C(CO) 0.12
3. Discussion
We wished to determine how effective signature descriptors were in modeling the important properties of biomaterials. Improved descriptors for this task should not only be effective in making robust quantitative predictions of important biomaterials proper-ties, but also be more chemically intuitive and interpretable than those commonly used to build ML models. We evaluated the potential of signature descriptors to solve this important issue in materials science using seven data sets with different measured properties. Six data sets were taken from biomaterials studies, and the seventh, the AQSOL data set, was used as a well-studied benchmark.
The AQSOL data set is composed of small molecules with a wide range of chemotypes. Even a small neural network, having just two hidden layer neurons, trained using signature descriptors had betterr2and slightly smaller standard errors than those previously reported.[15,21]Comparing the neural network (BRANNGP) results derived using both types of descriptors, we see that use of Dragon descriptors required a more complicated neural network with four neurons in the hidden layer. Both models have excellentr2values for both training and test sets and similar standard errors. The Dragon model SEE of 0.48 logS and SEP of 0.73 logS and signature descriptor model SEE of 0.39 logS and SEP of 0.65 logS indicate that both models accurately predict the solubilities of molecules in the data set.
The pathogen attachment data set was collected from copolymer microarrays generated from 22 acrylates and methacrylate mono-mers combinatorially copolymerized to generate 576 unique mate-rials. Models trained on both types of descriptors require the same number of neurons in the hidden layer, but the signature descrip-tor models required a larger number of effective parameters than those trained using Dragon descriptors. The training and test setr2
were similar except in the UPEC case where the model derived from signatures has a training set r2 of 0.89 compared with 0.58 for the Dragon model, although the test set standard errors are similar. As UPEC has 86 data points, this could be due to chance based on which data points ended up in training and test sets. The standard errors are similar across all three pathogen
models for models trained with both types of descriptors. This demonstrates that the signature descriptors are predictive as Dragon descriptors but, by their nature, should be more interpretable.
TheTg, WCA, andfibrinogen attachment data set were gen-erated for 112 copolymers synthesized from acid and diphenol moieties. The WCA model derived using signature descriptors had very similar metrics to that generated using Dragon descrip-tors except the latter requiredfive neurons in the hidden layer compared with four for the signature descriptor-based model. The model trained on signature descriptors required a larger number of effective parameters (41) in the model than the model trained using Dragon descriptors (15). Thefibrinogen adsorption model’s predictive performance was comparable for both descriptor sets, but the model trained on signature descriptors again required more effective parameters. The biggest difference between models generated from the two type of descriptors was with glass transition temperature models. The signature-based model had similarr2values for the training and test sets to those for models trained on Dragon descriptors. The standard errors were significantly lower for models trained on signature descrip-tors than for those trained on Dragon descripdescrip-tors, 3for training set and 4for test set, compared with 6and 9.0, respectively, for the model generated using Dragon descriptors. Overall, signature-based models have very similar predictive performance compared with models obtained using Dragon descriptors.
Nonlinear neural network (BRANNGP) models had higher predictive power than the linear (MLREM) models. The impor-tance of descriptors to the models was evaluated from the MLR coefficients in each model and, for the neural network models, by calculating partial derivatives of the modeled property with respect to the descriptors, as described in the Experimental Section. We found that the MLR coefficients and the partial deriv-atives of each descriptor with respect to the modeled properties were highly correlated (r2values between 0.85 and 0.99), so here we use the MLR coefficients for the model interpretations (partial derivatives are in Table S1, Supporting Information).
We describe the influence of the signature descriptors that contribute most, positively or negatively, to the models. The
Figure 5.Prediction of glass transition temperature (C) of polymers in training set (left) and test set (right) by the neural network model using signature descriptors.
Table 7. Signature descriptors with the greatest impact onTg, negative MLR coefficients reduceTg, and positive MLR coefficients increaseTg. The blue
boxes show where the significant fragment is located in an example monomer.
Descriptor Weights Exemplar
C 0.56 Total carbon count
C(O)C(O) 0.29
C(C)O(C(C)) 0.18
C(C(C))C(C(C(O))) 0.14
C(C(O═O))C(C(O═O)) 0.18
pathogen data set results showed that there are often a number of signatures or molecular features that are important for attach-ment or antiattachattach-ment across the range of pathogens. This is particularly true for PA and SA, which have70% of the most important molecular signatures in common, whereas only30% of the most important signatures are common to all three pathogens. The top five molecular fragments contributing to the nonattachment of PA are short-chain n-alkyl chains
C(HHC)C(HHC), hydroxyalkyl groups, methoxy
groups, , and the 1,3-dioxane signature
HC(COO). These fragments are associated with monomers hav-ing saturated and unsaturated rhav-ings and longer and more sterically crowded aliphatic chains. The top three fragments pro-moting attachment of PA (pro-attachment) are the number of nitrogen atoms, the hydroxy-PEG fragment, and a specific
molecular fragment . These signatures
represent measures of the hydrogen bond donor and acceptor properties of the polymer and also contribute to its hydrophilicity.
The top three SA antiattachment signatures are phenyl, short-chain alkyl, and fragment of the phenyl ester moiety O(C(C═C) C(C═O)). The remaining signatures have smaller derivatives and MLR coefficients. The top three fragments promoting attach-ment of SA monomers are the number of nitrogen atoms, num-ber of phenoxy groups, and numnum-ber of hydroxyl groups, similar to the PA attachment model signatures. This suggests that hydro-gen bonding and hydrophilicity play important roles in bacterial attachment of SA, such as with PA.
The three molecular signatures that contribute most strongly to antiattachment of UPEC are fragments of the phenyl ester moiety O(C(C═C)C(C═O)), short-chain alkyl, and
, as with the other two pathogens. Here, as with
PA antiattachment fragments, those with sterically crowded oxy-gen atoms seem to decrease attachment to the polymer. Thefive fragments promoting UPEC attachment (pro-attachment) are the number of nitrogen atoms, short ethylene glycol chains, and the hydroxy-substituted short glycol chain . Here, as in the other two models, theNfragment indicates increased pathogen attachment to polymers. The other fragments have hydrogen bond donors and acceptors. This is consistent with
findings of the previous two models discussed earlier. The signature descriptors that most strongly influenced WCA were the total number of carbon atoms, long-chain alkyl esters,
and short-chain and branched alkyl esters. As the polarity of the polymer surface is known to strongly effect the contact angle and wetting, it is unsurprising that the total carbon atom count and long-chain alkyl esters promoted increased contact angles. Conversely, more polar signatures associated with short-chain esters reduced the contact angle.
Thefibrinogen adsorption model is particularly simple, with only four signatures contributing to most of the increase or decrease in protein loading on the surfaces. The total number of carbon atoms (correlates roughly with lipophilicity) was the most significant contributor to the reduction in protein binding. Long-chain carboxylic acid signatures (esters in the polymer) were also associated with lower protein attach-ment, whereas short-chain alkyl esters favored binding of
fibrinogen.
The analysis of the signatures forTgshows that those with highflexibility contribute strongly to the reduction in polymer
Tg. This is also seen in the dramatic improvement on theTg model when a descriptor counting the number of rotatable bonds in the monomers, a simple surrogate for molecular flexibility, was added to the model.
4. Conclusions
We have shown that signature descriptors generate robust and predictive models for a relatively diverse range of polymer prop-erties relevant to their biological applications. ML-based models trained using traditional but hard-to-interpret molecular descriptors and molecular signature descriptors exhibited sim-ilar prediction accuracies for the structure–property relation-ships models studied. The signature descriptors have the advantage of more direct molecular interpretability as the most important signatures can be easily mapped back onto exemplar materials. This provides valuable guidance for materials scien-tists planning synthesis of materials with improved properties. Signature descriptors provide a useful way to break the accu-racy/interpretability nexus that has held back wider use of ML methods for design of materials for biological applications. We anticipate that signature descriptors or methods for gener-ating descriptors by fragmenting materials, such as those reported by Isayev et al. for crystalline materials,[24]will be more broadly applicable than just to polymers and will make elucida-tion of useful QSPRs across broader classes of materials achievable.
5. Experimental Section
Data Sets: Seven data sets were modeled in this study: AQSOL,[15]
WCA, glass transition temperature (Tg),fibrinogen adsorption (Fib),[16]
and attachment of three common hospital pathogens (SA, PA, and UPEC).[17]The structures of the 112 polyarylates screened forfibrinogen
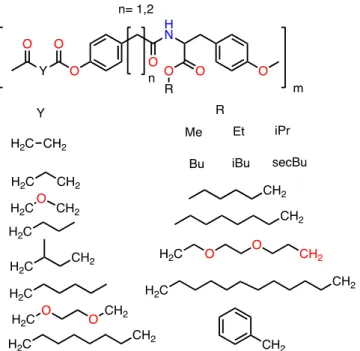
attachment, air–water contact angle, and glass transition temperature are shown inFigure 6.[23]The polymer library pathogen attachment data set contained data for 496 copolymers and homopolymers from Hook et al.[17,25] The copolymers were formed by combining monomers
1–16 (Figure 7) with monomers A–F in volume ratios from 10% to 30% in 5% steps.
The data set sizes, partitioning of data into training sets used to gen-erate the models and test sets used to quantify model predictivities of the
properties in each data set, are shown inTable 8. Model training sets con-tained 80% of the data and test sets 20% of the data, selected using k-means clustering. Some data sets are available in the cited publications, and the remainder is available at http://cheminformatics.org/datasets/ index.shtml.
The bacterial attachment of SA, PA, and UPEC was measured using the
fluorescence of bacteria transformed with greenfluorescent protein. The number of bacteria on the spot was proportional to the brightness of the greenfluorescence. As thefluorescence spanned several orders of mag-nitude, we modeled the logarithm of thefluorescence, logF. Some spots were below the level of detection, so were omitted, especially for the UPEC data set, that exhibited markedly lower attachment than the other patho-gens, and thefibrinogen attachment.
Signature Descriptors: We used signature descriptors to model the small molecule (AQSOL) and materials physical and biological properties. A brief description of how signature descriptors are generated is provided as follows; more detailed descriptions are provided in the key signature descriptor publications.[11,12,26]The signature of an atom in a polymer
(in this instance) is a representation of the atom’s connected environment up to a predefined depthd. Essentially, signature descriptors are all pos-sible fragments in a molecule, enumerated at each atomic position, that contain atoms attached to it along paths up to lengthd(a topological lengthd). This process for generating molecular signature descriptors is shown inFigure 8. As can be readily appreciated, if these types of descriptor are effective at generating strong predictive models of proper-ties, then the most and least beneficial molecular features can be mapped back onto prototype molecules in the data set to provide guidance for syn-thesis of materials with improved properties. The signature descriptor approach bears some similarity to the earlier molecular hologram
Figure 6. Structures of 112 polyarylate polymers generated by reaction of organic diacids is reacted with each alcohol to generate a YR library. The polymer library was used for fibronectin attachment, air–water contact angle, and glass transition temperature models.
Figure 7. Structures of monomers used to generate a combinatorial polymer library by combining monomers 1–16 with A–F in ratios of 10–30% in 5% increments. The resulting homo- and copolymers were tested for pathogen attachment. Adapted with permission from Hook et al.[17]
descriptors.[27]Although these types of descriptors are becoming popular
in the small-molecule drug designfield, to our knowledge, this is one of the
first applications to complex materials.
Signature descriptors were generated from molecular (.mol) files obtained by converting the text representations of monomers (SMILES) to .molfile format using the RDKit package.[28]Signature descriptors were
generated from depth 0 (single atoms) to 7 (complex fragments) using the packagesscan(https://sourceforge.net/projects/molsig/). The descriptors for the entire data set were generated, aggregated, duplicates removed, and sorted by size, and signatures with cross-correlations of more than 0.9 or low variance were removed.
Copolymer descriptors were calculated from the ratio of two mono-mers, using a linear combination rule shown to be useful in prior stud-ies.[18a,b]For the pathogen attachment data set, a pool of 837 signature
descriptors was calculated. AQSOL used an initial pool of 19 714 signature descriptors, and WCA,Tg, andfibrinogen data sets used an initial pool of
372 signature descriptors. Models were also generated using Dragon descriptors used in published models (where available). The initial pool of Dragon descriptors was 1505 (AQSOL), 254 (Tg, Fib, and WCA),
and 1645 (PA, SA, and UPEC). The most relevant subsets of these descrip-tors, chosen using sparse feature selection methods (see in the following), were used to construct thefinal models for each property. AsTgis known
to correlate strongly with molecularflexibility, we included the number of rotatable bonds as a descriptor for theTgmodel.
Feature Selection: The most relevant descriptors were identified using an efficient sparse linear feature selection method, MLREM.[22] This is a
Bayesian method that uses a sparse (Laplacian) prior to eliminate uninfor-mative or low-relevance descriptors by compressing them to zero. It is an L1 feature selection method similar to the popular least absolute shrinkage and selection operator (LASSO) method.[29]The sparsity of model was varied by
altering theβparameter, and linear regression with the lowest SEP for the test was selected as the model with optimum sparsity. Feature significance was encoded by sizes and magnitudes of the regression coefficients for each descriptor. Descriptors identified using the MLREM feature selection procedure were used to train nonlinear neural network regression models.
Bayesian Regularized Artificial Neural Networks with a Gaussian Prior
(BRANNGP): BRANNGP, which minimizes overfitting and generates
optimal predictions, were also used to model the data sets. Regularization generates models with high degrees of robustness (but consistent with the data quality) and prunes the number of effective weights in the neural network. This generates ML models that are rela-tively insensitive network architectures (the number of hidden layer modes). The neural networks comprised three layers: an input layer with a neuron for each feature used, a single hidden layer containing between two and eight neurons (generally two and three), and output layer with a single node representing the property being modeled. The input and out-put nodes used linear transfer functions and the hidden layers a sigmoi-dal transfer function. The Bayesian regularization prunes the weights to an effective number of parameters (Neff) for the models, which
asymp-tote to a constant number as the number of hidden layer nodes is increased above the minimum required.
Feature significance (parametric sensitivity) for ML models was evalu-ated by generating the partial derivative of the response variableawith respect to the descriptor at a position on the response surface close to the response variable maximum. This was achieved by inducing a small change of 0.01 to each normalized descriptor valuedin turn, with the remaining descriptors keptfixed. The difference between original predicted and perturbed predicted property value obtained from neural network (NN) allowed the partial derivativeδ ¼ Δfeature
Δoutput ¼ ∂∂adto be calculated.
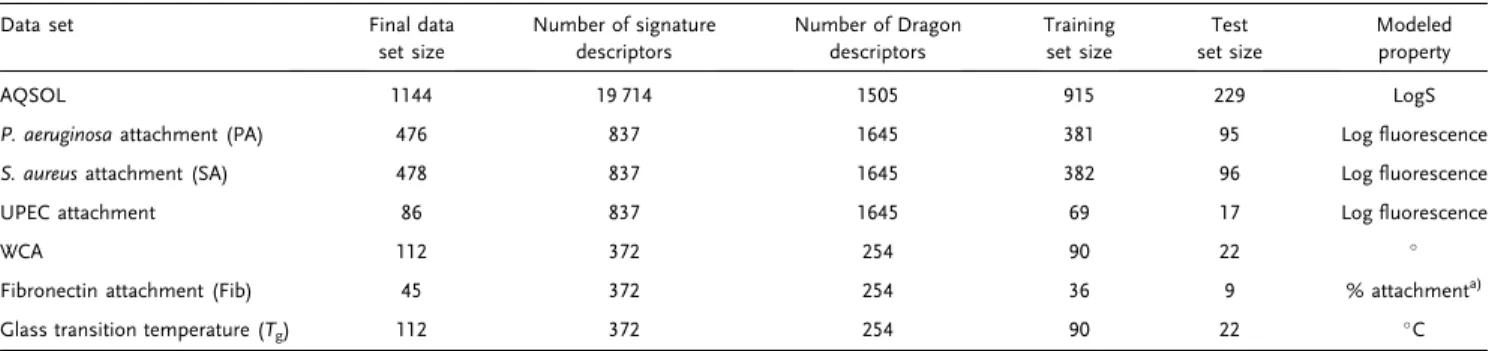
Table 8. Summary of data sets.
Data set Final data set size Number of signature descriptors Number of Dragon descriptors Training set size Test set size Modeled property AQSOL 1144 19 714 1505 915 229 LogS
P. aeruginosaattachment (PA) 476 837 1645 381 95 Logfluorescence
S. aureusattachment (SA) 478 837 1645 382 96 Logfluorescence
UPEC attachment 86 837 1645 69 17 Logfluorescence
WCA 112 372 254 90 22
Fibronectin attachment (Fib) 45 372 254 36 9 % attachmenta)
Glass transition temperature (Tg) 112 372 254 90 22 C
a)Relative to polypropylene control.
Figure 8.An example of how signature descriptor is computed. C,1 and C,2 represent atoms that complete a ring. Signatures with depth ranging from 0 to 4 are shown.
Supporting Information
Supporting Information is available from the Wiley Online Library or from the author. Data for this manuscript can be accessed at the University of Nottingham Research Data Management Repository.
Acknowledgements
This work was supported by the Engineering and Physical Sciences Research Council (grant number EP/N006615/1) and the Wellcome Trust (grant number 085245).
Con
fl
ict of Interest
The authors declare no conflict of interest.
Keywords
interpretability, machine learning, materials designs, molecular descriptors, structure–property relationships
Received: June 12, 2019 Revised: September 18, 2019 Published online:
[1] T. Le, V. C. Epa, F. R. Burden, D. A. Winkler,Chem. Rev.2012,112, 2889.
[2] T. Fujita, D. A. Winkler,J. Chem. Inf. Model.2016,56, 269. [3] a) J. E. Gubernatis, T. Lookman,Phys. Rev. Mater.2018,2, 120301;
b) Y. Liu, T. Zhao, W. Ju, S. Shi,J. Mater.2017,3, 159; c) J. Schmidt, M. R. G. Marques, S. Botti, M. A. L. Marques,Comput. Mater.2019,
5, 83.
[4] J. S. Ma, R. P. Sheridan, A. Liaw, G. E. Dahl, V. Svetnik,J. Chem. Inf. Model.2015,55, 263.
[5] A. W. Thornton, C. M. Simon, J. Kim, O. Kwon, K. S. Deeg, K. Konstas, S. J. Pas, M. R. Hill, D. A. Winkler, M. Haranczyk, B. Smit,Chem. Mater.2017,29, 2844.
[6] P. Mikulskis, A. L. Hook, M. H. Alexander, D. A. Winkler,ACS Appl. Mater. Interfaces2018,10, 139.
[7] D. A. Winkler, M. Breedon, P. White, A. E. Hughes, E. D. Sapper, I. Cole,Corros. Sci.2016,106, 229.
[8] a) C. Y. Shao, S. Z. Chen, B. H. Su, Y. J. Tseng, E. X. Esposito, A. J. Hopfinger, J. Chem. Inf. Model. 2013, 53, 142; b) D. A. Winkler, T. C. Le, Mol. Inf. 2017, 36; c) A. Cherkasov, E. N. Muratov, D. Fourches, A. Varnek, I. I. Baskin, M. Cronin, J. Dearden, P. Gramatica, Y. C. Martin, R. Todeschini, V. Consonni, V. E. Kuz’min, R. Cramer, R. Benigni, C. Yang, J. Rathman, L. Terfloth, J. Gasteiger, A. Richard, A. Tropsha,
J. Med. Chem.2014,57, 4977.
[9] A. Mauri, V. Consonni, M. Pavan, R. Todeschini,Match2006,56, 237. [10] P. Polishchuk,J. Chem. Inf. Model.2017,57, 2618.
[11] a) C. J. Churchwell, M. D. Rintoul, S. Martin, D. P. Visco, A. Kotu, R. S. Larson, L. O. Sillerud, D. C. Brown, J. L. Faulon, J. Mol. Graphics Modell.2004, 22, 263; b) J. L. Faulon, C. J. Churchwell, D. P. Visco,J. Chem. Inf. Comp. Sci.2003,43, 721; c) J. L. Faulon, D. P. Visco, R. S. Pophale,J. Chem. Inf. Comp. Sci.2003,43, 707. [12] P. Carbonell, L. Carlsson, J. L. Faulon,J. Chem. Inf. Model.2013,53,
887.
[13] a) D. S. Chekmarev, V. Kholodovych, K. V. Balakin, Y. Ivanenkov, S. Ekins, W. J. Welsh, Chem. Res. Toxicol. 2008, 21, 1304; b) J. J. F. Chen, D. P. Visco, Chem. Eng. Sci. 2017, 159, 31; c) J. D. Jackson, D. C. Weis, D. P. Visco,Chem. Biol. Drug Des.
2008, 72, 540; d) D. C. Weis, D. P. Visco,Comput. Chem. Eng.
2010,34, 1018; e) D. C. Weis, D. P. Visco, J. L. Faulon, J. Mol. Graphics Modell.2008,27, 466.
[14] W. M. Brown, S. Martin, M. D. Rintoul, J. L. Faulon,J. Chem. Inf. Model.2006,46, 826.
[15] J. S. Delaney,J. Chem. Inf. Comp. Sci.2004,44, 1000.
[16] N. Weber, D. Bolikal, S. L. Bourke, J. Kohn,J. Biomed. Mater. Res. A
2004,68a, 496.
[17] A. L. Hook, C. Y. Chang, J. Yang, J. Luckett, A. Cockayne, S. Atkinson, Y. Mei, R. Bayston, D. J. Irvine, R. Langer, D. G. Anderson, P. Williams, M. C. Davies, M. R. Alexander,Nat. Biotechnol.2012,
30, 868.
[18] a) V. C. Epa, A. L. Hook, C. Chang, J. Yang, R. Langer, D. G. Anderson, P. Williams, M. C. Davies, M. R. Alexander, D. A. Winkler,Adv. Funct. Mater.2014,24, 2085; b) V. C. Epa, J. Yang, Y. Mei, A. L. Hook, R. Langer, D. G. Anderson, M. C. Davies, M. R. Alexander, D. A. Winkler,J. Mater. Chem. 2012, 22, 20902; c) P. M. Khan, K. Roy, SAR QSAR Environ. Res. 2018, 29, 935; d) A. Afantitis, G. Melagraki, H. Sarimveis, P. A. Koutentis, J. Markopoulos, O. Igglessi-Markopoulou,Polymer2006,47, 3240.
[19] N. Jain, S. H. Yalkowsky,J. Pharm. Sci.2001,90, 234.
[20] A. J. Urquhart, M. Taylor, D. G. Anderson, R. Langer, M. C. Davies, M. R. Alexander,Anal. Chem.2008,80, 135.
[21] M. Salahinejad, T. C. Le, D. A. Winkler, Mol. Pharm. 2013, 10, 2757.
[22] F. R. Burden, D. A. Winkler,QSAR Comb. Sci.2009,28, 645. [23] R. Smith, V. Kholodovych, D. Knight, J. Kohn, W. J. Welsh,Polymer
2005,464296.
[24] O. Isayev, C. Oses, C. Toher, E. Gossett, S. Curtarolo, A. Tropsha,
Nat. Commun.2017,8, 15679.
[25] A. L. Hook, C. Y. Chang, J. Yang, S. Atkinson, R. Langer, D. G. Anderson, M. C. Davies, P. Williams, M. R. Alexander,
Adv. Mater.2013,25, 2542.
[26] J. L. Faulon, M. J. Collins, R. D. Carr,J. Chem. Inf. Comp. Sci.2004,44, 427.
[27] a) D. A. Winkler, F. R. Burden,Quant. Struct.-Act. Relat.1998,17, 224; b) T. Hurst, T. Heritage, presented at213th ACS Natl. Meeting, San Francisco, CA, American Chemical Society, Washington DC
1997.
[28] G. Landrum, inRDKit: Open-Source Cheminformatics,2010, http:// www.rdkit.org.