Polarity of Liquid Interfaces by Second Harmonic Generation Spectroscopy
Hongfei Wang,§ E. Borguet,‡ and K. B. Eisenthal*,†
Department of Chemistry, UniVersity of PennsylVania, Philadelphia, PennsylVania 19104, and
Department of Chemistry, UniVersity of Pittsburgh, Pittsburgh, PennsylVania 15260
ReceiVed: July 11, 1996; In Final Form: September 30, 1996X
A spectroscopic method, based on the interface selectivity of second-harmonic generation, is used to obtain the polarity of liquid interfaces. In this paper the second-harmonic measurement of the spectrum of the polarity indicator molecule N,N′-diethyl-p-nitroaniline (DEPNA) at the air/water interface demonstrates the method. Two different approaches are used to measure the intramolecular charge transfer (CT) absorption band position of DEPNA at the air/water interface. The DEPNA CT band blue-shifts from 429 nm in bulk water (polar solvent) to 359 nm in bulk hexane (nonpolar solvent) and 329 nm in the gas phase (no solvent). At the air/water interface, the charge transfer peak band maximum occurs at 373 nm, which indicates that the polarity of the air/water interface is similar to those of the bulk solvents carbon tetrachloride and butyl ether. The DEPNA results together with the results from another solvatochromic polarity indicator molecule, ET-(30), which will be reported elsewhere, show that the polarity results of the air/water interface are general.
1. Introduction
The solvent plays a fundamental role in chemical and physical processes in bulk solution. It is well-known, for example, that the rates of chemical reactions can be increased or decreased by orders of magnitude depending on the solvent medium in which they occur.1-3 The solvent also influences other impor-tant bulk molecular behavior. The position, shape, and intensity of fluorescence bands, as well as their dynamics, are a function of the solvent medium.4 This is illustrated dramatically by
species possessing TICT (twisted intramolecular charge transfer) states characterized by dual fluorescence bands, whose relative amplitude changes with the polarity of the solvent.5 The
influence of solvents on chemical equilibrium constants has been known for a long time.6-8
The dynamics and spectroscopy of intramolecular and intermolecular electron transfer processes, of practical and fundamental interest, depend on the solvent medium.9 Given the importance of the solvent in bulk
processes, as indicated by the preceding examples, it is reasonable that the properties of the solvent at liquid interfaces are important in interfacial chemical and physical processes. The experiments reported here provide interface-specific mea-surements of solvent polarity at liquid interfaces.
Solvent polarity is the term chemists use to describe solvent effects.10 It has been defined as the “overall solvation capability
of a solvent for reactants and activated complexes as well as for molecules in the ground and excited states, excluding solute-solvent interactions such as protonation, oxidation, reduction, complexation, etc., which may lead to a chemical change of the solute”.10 Solvation is a complicated process that
depends on a number of different solvent/solute interactions. These include nonspecific interactions arising from electrostatic and polarization forces, as well as more specific forces such as hydrogen bonding. Solvent polarity remains a difficult param-eter to describe theoretically as a consequence of the diverse range of interactions involved.
However, chemists have successfully introduced useful empirical solvent polarity scales, based on solvent-dependent
molecular properties.11-14
Using solvent polarity scales, quan-titative correlations of solvent polarity with molecular behavior are possible. For instance, it has been shown that the dynamics of singlet to triplet intersystem crossing in aromatic carbenes can be understood and predicted using solvent polarity scales.15
Reaction rates can be predicted using empirically established linear solvation energy relationships, based on solvent polar-ity.11,12
The most developed and widely used solvent polarity scales are constructed from spectroscopic observations of the solva-tochromic behavior of the intramolecular charge transfer (CT) π-π* absorption band of indicator molecules.
10
Solvato-chromism is the dependence of the position of a UV/vis/near-IR absorption band on the polarity of the solvent. The CT band of indicator molecules is sensitive to the solvent environment that the indicator molecule experiences. For some molecules the peak wavelength of the CT band can shift by several hundred nanometers from water, considered the most polar solvent on many of these scales, to hexane, a prototypical nonpolar solvent. The direction and magnitude of the solvatochromic spectral shifts depend on the nature of the solvent-solute interactions. A blue (hypsochromic) shift with increasing solvent polarity is called negative solvatochromism. A red (bathochromic) shift with increasing solvent polarity is termed positive solvato-chromism. The solvent effect on spectra depends on the chromophore and the nature of the transition. A red shift (positive solvatochromism) as the solvent polarity increases suggests that the excited state is more dipolar than the ground state (µg<µe) (Figure 1a), whereµgandµeare the permanent dipole moments of the ground and excited states, respectively. A blue shift (negative solvatochromism) will be observed if the ground state is more dipolar than the excited state (µg >µe) (Figure 1b). In addition, there is a general red shift of the transition due to the contribution of dispersion forces to solvation of the solute molecules, which goes as (n2-1)/(2n2+1). This red shift is generally much smaller than the effect induced by dipole-induced dipole or dipole-dipole interactions.11,16
-18 However, solvent-induced shifts of solvatochromic molecules cannot be explained by the change of the solute molecule dipole moment alone. Due to specific solute/solvent interactions such as hydrogen bonding, more than one indicator is used to probe a wide range of solvent-sensitive processes. Hence correlations * Author to whom correspondence should be addressed.
†Columbia University. ‡University of Pittsburgh. §University of Pennsylvania.
XAbstract published in AdVance ACS Abstracts, January 1, 1997.
between different scales based on different indicator molecules have been established.11,13,19,20
Liquid interfaces, which are the subject of the present study, is a field of intense activity because of the scientific, environ-mental, and technological importance of interfaces.21-24 The asymmetry of the forces at the interface, exemplified by the observation that molecules at liquid surfaces are aligned in a preferential direction rather than randomly oriented as they are in the bulk,25is the origin of many of the unique chemical and
physical properties of this region.21-24
Given the importance of polarity in determining chemical and physical behavior in bulk liquids, the measurement and understanding of interfacial polarity is an important scientific objective. Studies using solvatochromic polarity indicator molecules, such as ET(30) (Figure 1d), have been carried out to probe mean solvent properties of the interfacial region of water-in-oil microemul-sions,26oil-in-water microemulsions,27and ionic and nonionic
micelles,28,29as well as alumina30and silica31interfaces, by UV/
vis absorption spectra measurement. ET(30) has also been investigated at free oil/water interfaces by visible attenuated total internal reflectance absorption spectroscopy.32 Unfortunately,
these techniques are not necessarily surface specific. An investigation using the interface-specific technique of second harmonic generation on a well-characterized interfacial system would be helpful. This is especially true at the air/water interface, where, to our knowledge, no interface polarity measurements have been reported.
The air/water interface is a most important system and one of the most studied. It has already been demonstrated experi-mentally, using second-harmonic generation (SHG), that fun-damental chemical behavior at interfaces, such as acid-base equilibrium constants, is different at the air/water interface from that in bulk water.33,34 The shifts of pK
a showed that the air/
water interface preferentially stabilizes neutral species.35,36
Differences in solvation of ionic and neutral species at the air/
water interface undoubtedly play an important role in such equilibria. In addition, different parts of a solute molecule can experience different solvent environments at an interface.37The
discontinuity in material composition and electric field at the interface also certainly affects solvation. A knowledge of interfacial solvent polarity is important to understand and predict the properties of molecules, chemical equilibria, and dynamics of chemical reactions at interfaces.
SHG is electric dipole forbidden in centrosymmetric environ-ments such as bulk liquids.21,24,38,39 At interfaces the inversion
symmetry is broken and SHG is allowed, hence the interface specificity of SHG. The magnitude of the SHG signal, I(2), is
proportional to the square of the second-order susceptibility, χ(2), a macroscopic property of the interface (eq 1).
where Eωis the amplitude of the incident field at the frequency ω.
χ(2)can be expressed as a sum over all the states (a, b, c, ...)
of the molecular system that interact with the fundamental laser frequency,ω, and its second harmonic, 2ω.40 One of the most
important terms inχ(2)for the purposes of this work is
whereµab is the transition dipole moment,ωbais the optical
frequency of the transition, andΓabis the linewidth associated
with the transition.
Resonance enhancement ofχ(2)occurs when the fundamental
laser frequency, ω, and/or its second harmonic, 2ω, is in resonance with a transition between molecular states. This typically increases experimental signals by several orders of magnitude.41 By tuning the incident laser light frequency, one
can measure χ(2) as a function of photon energy, yielding
interfacial spectroscopic information. A number of investiga-tions have exploited the spectroscopic character of SHG41-43 and visible sum frequency generation (SFG),44,45 a related
surface nonlinear technique, to reveal the electronic transition spectra of interfacial species.
In this paper we present the results of experiments designed to determine the polarity of the air/water interface. This is achieved by the SH spectroscopy of the polarity indicator molecule, DEPNA (N,N-diethyl-p-nitroaniline). Two different approaches are used. One approach is based on the SH spectrum obtained at a fixed surface density of DEPNA. The other approach exploits the different density dependence of the SH signal at different wavelengths. The use of two methods provides a self-consistent check on the accuracy of the polarity determination. It also enables us to determine if the spectra are dependent on the density of DEPNA at the air/water interface, in the density range of our experiments. We have chosen to use DEPNA because its solvent-induced absorption peak shifts are large in bulk solution and within an experimen-tally accessible range for the tunable laser system used in this study. In addition, DEPNA is stable in bulk water and exists predominately in its neutral form over a wide range of solution pH. DEPNA is a positively solvatochromic species and one of the most extensively studied nitroaromatic indicators.19,20 The
solvatochromic behavior of the nitroaromatic indicators is associated with aπ-π* CT transition, involving charge density at the nitro and anilino substituents. Based on these nitroaro-matic compounds, a series of correlatedπ* scales of solvent polarity have been constructed. For DEPNA theπ-π* band Figure 1. Qualitative representation of solvent effects on the electronic
transition energy of dipolar solutes in solvents. Typical dipole moments for ground and excited states in solvent for ET(30) areµg)14.7 D>
µe)6.0 D, and for DEPNAµg)5.1 D<µe)12.9 D.
I(2)∝|χ(2)EωEω|2 (1) χ(2))
∑
b,c µabµbcµac (ωba-ω+iΓab)(ωca-2ω+iΓac) (2)peaks at 429 nm in bulk water, the most polar solvent in the scale, and 359 nm in bulk n-hexane, the most nonpolar solvent in the scale.47
2. Experimental Methods
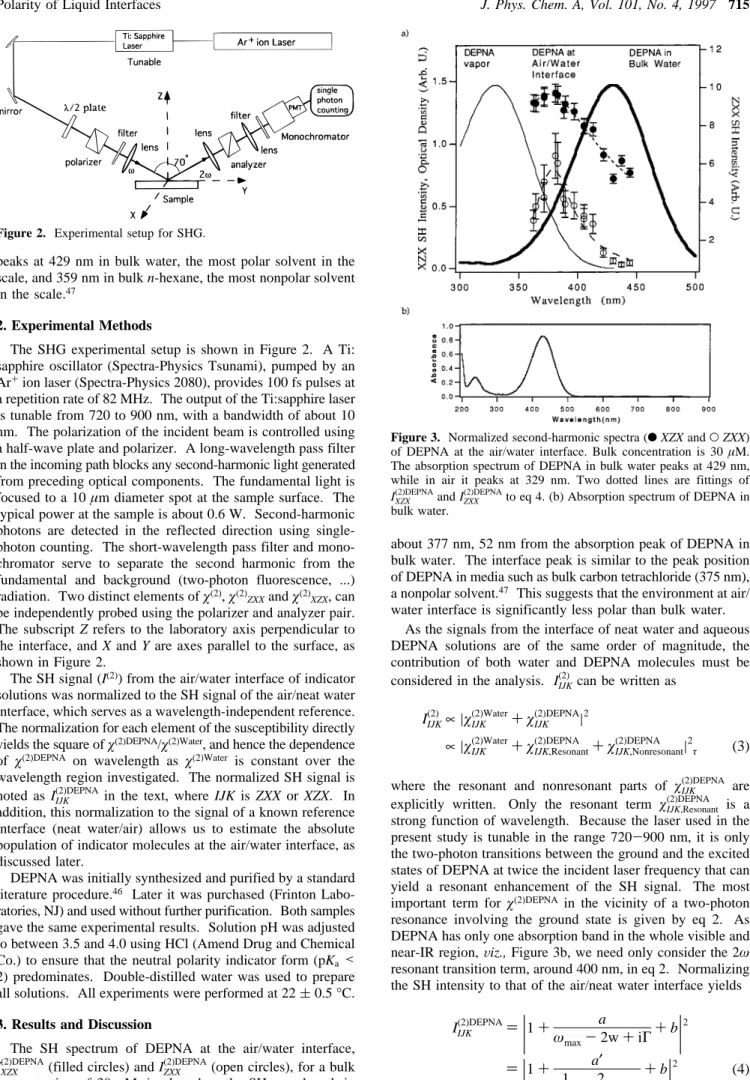
The SHG experimental setup is shown in Figure 2. A Ti: sapphire oscillator (Spectra-Physics Tsunami), pumped by an Ar+ion laser (Spectra-Physics 2080), provides 100 fs pulses at a repetition rate of 82 MHz. The output of the Ti:sapphire laser is tunable from 720 to 900 nm, with a bandwidth of about 10 nm. The polarization of the incident beam is controlled using a half-wave plate and polarizer. A long-wavelength pass filter in the incoming path blocks any second-harmonic light generated from preceding optical components. The fundamental light is focused to a 10µm diameter spot at the sample surface. The typical power at the sample is about 0.6 W. Second-harmonic photons are detected in the reflected direction using single-photon counting. The short-wavelength pass filter and mono-chromator serve to separate the second harmonic from the fundamental and background (two-photon fluorescence, ...) radiation. Two distinct elements ofχ(2),χ(2)
ZXXandχ(2)XZX, can
be independently probed using the polarizer and analyzer pair. The subscript Z refers to the laboratory axis perpendicular to the interface, and X and Y are axes parallel to the surface, as shown in Figure 2.
The SH signal (I(2)) from the air/water interface of indicator
solutions was normalized to the SH signal of the air/neat water interface, which serves as a wavelength-independent reference. The normalization for each element of the susceptibility directly yields the square ofχ(2)DEPNA/χ(2)Water, and hence the dependence
of χ(2)DEPNA on wavelength as χ(2)Water is constant over the
wavelength region investigated. The normalized SH signal is noted as IIJK(2)DEPNA in the text, where IJK is ZXX or XZX. In addition, this normalization to the signal of a known reference interface (neat water/air) allows us to estimate the absolute population of indicator molecules at the air/water interface, as discussed later.
DEPNA was initially synthesized and purified by a standard literature procedure.46 Later it was purchased (Frinton
Labo-ratories, NJ) and used without further purification. Both samples gave the same experimental results. Solution pH was adjusted to between 3.5 and 4.0 using HCl (Amend Drug and Chemical Co.) to ensure that the neutral polarity indicator form (pKa< 2) predominates. Double-distilled water was used to prepare all solutions. All experiments were performed at 22(0.5°C.
3. Results and Discussion
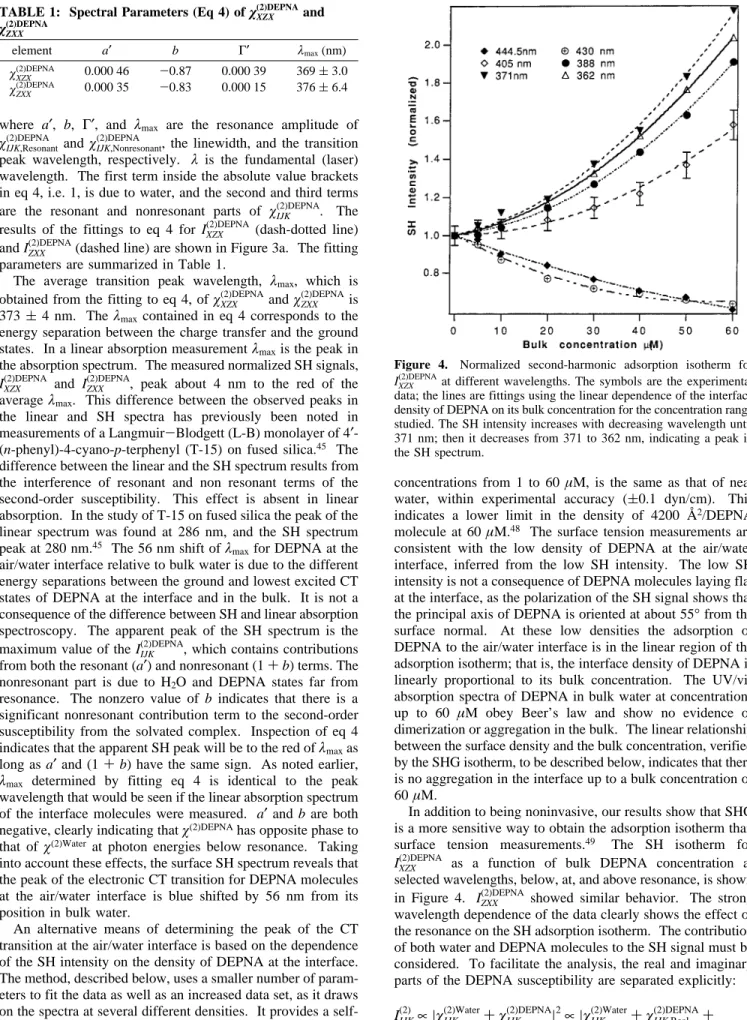
The SH spectrum of DEPNA at the air/water interface,
IXZX(2)DEPNA(filled circles) and IZXX(2)DEPNA(open circles), for a bulk concentration of 30 µM, is plotted vs the SH wavelength in Figure 3a. By inspection both IXZX(2)DEPNAand IZXX(2)DEPNApeak at
about 377 nm, 52 nm from the absorption peak of DEPNA in bulk water. The interface peak is similar to the peak position of DEPNA in media such as bulk carbon tetrachloride (375 nm), a nonpolar solvent.47 This suggests that the environment at air/
water interface is significantly less polar than bulk water. As the signals from the interface of neat water and aqueous DEPNA solutions are of the same order of magnitude, the contribution of both water and DEPNA molecules must be considered in the analysis. IIJK(2) can be written as
where the resonant and nonresonant parts of χIJK(2)DEPNA are explicitly written. Only the resonant term χIJK,Resonant(2)DEPNA is a strong function of wavelength. Because the laser used in the present study is tunable in the range 720-900 nm, it is only the two-photon transitions between the ground and the excited states of DEPNA at twice the incident laser frequency that can yield a resonant enhancement of the SH signal. The most important term for χ(2)DEPNA in the vicinity of a two-photon
resonance involving the ground state is given by eq 2. As DEPNA has only one absorption band in the whole visible and near-IR region,Viz., Figure 3b, we need only consider the 2ω resonant transition term, around 400 nm, in eq 2. Normalizing the SH intensity to that of the air/neat water interface yields Figure 2. Experimental setup for SHG.
Figure 3. Normalized second-harmonic spectra (bXZX andOZXX) of DEPNA at the air/water interface. Bulk concentration is 30µM. The absorption spectrum of DEPNA in bulk water peaks at 429 nm, while in air it peaks at 329 nm. Two dotted lines are fittings of IXZX(2)DEPNAand IZXX(2)DEPNAto eq 4. (b) Absorption spectrum of DEPNA in bulk water.
IIJK(2) ∝|χIJK(2)Water+χ IJK (2)DEPNA|2 ∝|χIJK (2)Water +χIJK,Resonant (2)DEPNA +χIJK,Nonresonant (2)DEPNA |2 τ (3) IIJK(2)DEPNA)
|
1+ a ωmax-2w+iΓ +b|
2 )|
1+ a′ 1 λmax -2 λ+iΓ′ +b|
2 (4)where a′, b, Γ′, and λmax are the resonance amplitude of
χIJK,Resonant(2)DEPNA andχIJK,Nonresonant(2)DEPNA , the linewidth, and the transition peak wavelength, respectively. λ is the fundamental (laser) wavelength. The first term inside the absolute value brackets in eq 4, i.e. 1, is due to water, and the second and third terms are the resonant and nonresonant parts of χIJK(2)DEPNA. The results of the fittings to eq 4 for IXZX(2)DEPNA (dash-dotted line) and IZXX(2)DEPNA(dashed line) are shown in Figure 3a. The fitting parameters are summarized in Table 1.
The average transition peak wavelength, λmax, which is
obtained from the fitting to eq 4, ofχXZX(2)DEPNAandχZXX(2)DEPNAis 373( 4 nm. Theλmaxcontained in eq 4 corresponds to the energy separation between the charge transfer and the ground states. In a linear absorption measurementλmaxis the peak in
the absorption spectrum. The measured normalized SH signals,
IXZX(2)DEPNA and IZXX(2)DEPNA, peak about 4 nm to the red of the averageλmax. This difference between the observed peaks in
the linear and SH spectra has previously been noted in measurements of a Langmuir-Blodgett (L-B) monolayer of 4′ -(n-phenyl)-4-cyano-p-terphenyl (T-15) on fused silica.45 The
difference between the linear and the SH spectrum results from the interference of resonant and non resonant terms of the second-order susceptibility. This effect is absent in linear absorption. In the study of T-15 on fused silica the peak of the linear spectrum was found at 286 nm, and the SH spectrum peak at 280 nm.45 The 56 nm shift ofλ
maxfor DEPNA at the
air/water interface relative to bulk water is due to the different energy separations between the ground and lowest excited CT states of DEPNA at the interface and in the bulk. It is not a consequence of the difference between SH and linear absorption spectroscopy. The apparent peak of the SH spectrum is the maximum value of the IIJK(2)DEPNA, which contains contributions from both the resonant (a′) and nonresonant (1+b) terms. The nonresonant part is due to H2O and DEPNA states far from
resonance. The nonzero value of b indicates that there is a significant nonresonant contribution term to the second-order susceptibility from the solvated complex. Inspection of eq 4 indicates that the apparent SH peak will be to the red ofλmaxas
long as a′and (1+b) have the same sign. As noted earlier, λmax determined by fitting eq 4 is identical to the peak
wavelength that would be seen if the linear absorption spectrum of the interface molecules were measured. a′and b are both negative, clearly indicating thatχ(2)DEPNAhas opposite phase to
that of χ(2)Water at photon energies below resonance. Taking
into account these effects, the surface SH spectrum reveals that the peak of the electronic CT transition for DEPNA molecules at the air/water interface is blue shifted by 56 nm from its position in bulk water.
An alternative means of determining the peak of the CT transition at the air/water interface is based on the dependence of the SH intensity on the density of DEPNA at the interface. The method, described below, uses a smaller number of param-eters to fit the data as well as an increased data set, as it draws on the spectra at several different densities. It provides a self-consistent check on the accuracy of our measurement. It also verifies that the peak of the CT transition at the air/water inter-face is independent of the density of DEPNA at the interinter-face. The surface tension of aqueous DEPNA solutions, for bulk
concentrations from 1 to 60 µM, is the same as that of neat water, within experimental accuracy ((0.1 dyn/cm). This indicates a lower limit in the density of 4200 Å2/DEPNA
molecule at 60µM.48 The surface tension measurements are
consistent with the low density of DEPNA at the air/water interface, inferred from the low SH intensity. The low SH intensity is not a consequence of DEPNA molecules laying flat at the interface, as the polarization of the SH signal shows that the principal axis of DEPNA is oriented at about 55°from the surface normal. At these low densities the adsorption of DEPNA to the air/water interface is in the linear region of the adsorption isotherm; that is, the interface density of DEPNA is linearly proportional to its bulk concentration. The UV/vis absorption spectra of DEPNA in bulk water at concentrations up to 60 µM obey Beer’s law and show no evidence of dimerization or aggregation in the bulk. The linear relationship between the surface density and the bulk concentration, verified by the SHG isotherm, to be described below, indicates that there is no aggregation in the interface up to a bulk concentration of 60µM.
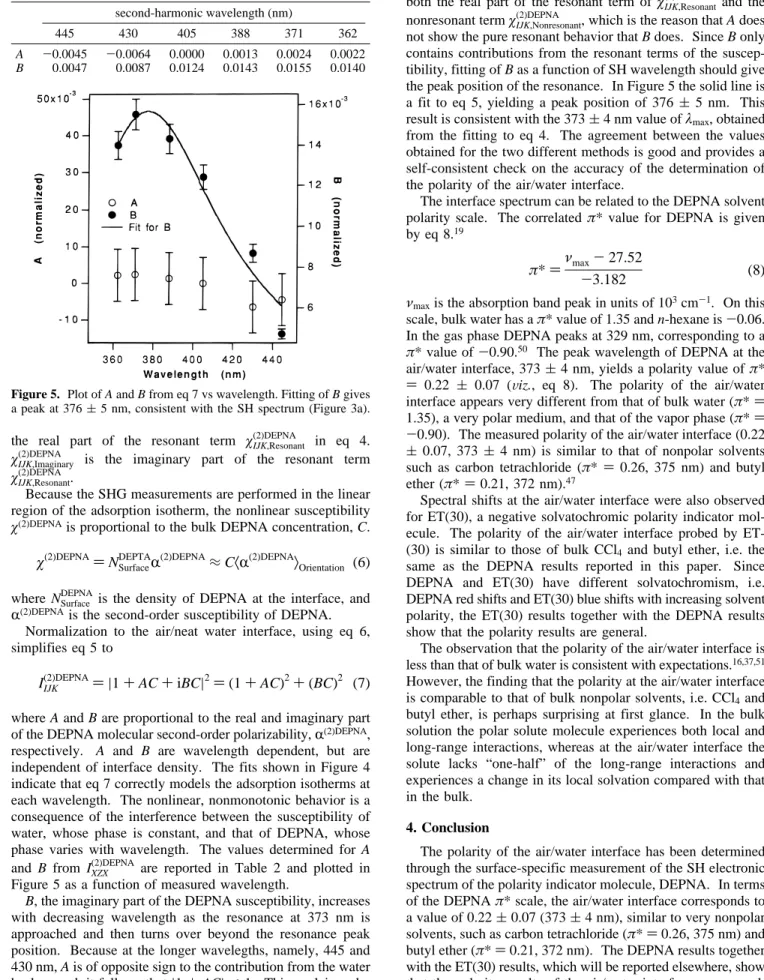
In addition to being noninvasive, our results show that SHG is a more sensitive way to obtain the adsorption isotherm than surface tension measurements.49 The SH isotherm for IXZX(2)DEPNA as a function of bulk DEPNA concentration at selected wavelengths, below, at, and above resonance, is shown in Figure 4. IZXX(2)DEPNA showed similar behavior. The strong wavelength dependence of the data clearly shows the effect of the resonance on the SH adsorption isotherm. The contribution of both water and DEPNA molecules to the SH signal must be considered. To facilitate the analysis, the real and imaginary parts of the DEPNA susceptibility are separated explicitly:
χIJK,Real(2)DEPNAis the sum of the nonresonant termχIJK,Nonresonant(2)DEPNA and TABLE 1: Spectral Parameters (Eq 4) ofχXZX
(2)DEPNA and χZXX (2)DEPNA element a′ b Γ′ λmax(nm) χXZX (2)DEPNA 0.000 46 -0.87 0.000 39 369(3.0 χZXX (2)DEPNA 0.000 35 -0.83 0.000 15 376(6.4
Figure 4. Normalized second-harmonic adsorption isotherm for IXZX(2)DEPNAat different wavelengths. The symbols are the experimental data; the lines are fittings using the linear dependence of the interface density of DEPNA on its bulk concentration for the concentration range studied. The SH intensity increases with decreasing wavelength until 371 nm; then it decreases from 371 to 362 nm, indicating a peak in the SH spectrum.
IIJK(2) ∝|χIJK(2)Water+χ IJK (2)DEPNA|2∝| χIJK(2)Water+χ IJK,Real (2)DEPNA + ι χIJK,Imaginary(2)DEPNA |2 (5)
the real part of the resonant term χIJK,Resonant(2)DEPNA in eq 4. χIJK,Imaginary(2)DEPNA is the imaginary part of the resonant term χIJK,Resonant(2)DEPNA .
Because the SHG measurements are performed in the linear region of the adsorption isotherm, the nonlinear susceptibility χ(2)DEPNAis proportional to the bulk DEPNA concentration, C.
where NSurfaceDEPNA is the density of DEPNA at the interface, and R
(2)DEPNAis the second-order susceptibility of DEPNA.
Normalization to the air/neat water interface, using eq 6, simplifies eq 5 to
where A and B are proportional to the real and imaginary part of the DEPNA molecular second-order polarizability,R(2)DEPNA, respectively. A and B are wavelength dependent, but are independent of interface density. The fits shown in Figure 4 indicate that eq 7 correctly models the adsorption isotherms at each wavelength. The nonlinear, nonmonotonic behavior is a consequence of the interference between the susceptibility of water, whose phase is constant, and that of DEPNA, whose phase varies with wavelength. The values determined for A and B from IXZX(2)DEPNA are reported in Table 2 and plotted in Figure 5 as a function of measured wavelength.
B, the imaginary part of the DEPNA susceptibility, increases
with decreasing wavelength as the resonance at 373 nm is approached and then turns over beyond the resonance peak position. Because at the longer wavelegths, namely, 445 and 430 nm, A is of opposite sign to the contribution from the water background, it follows that|1+AC|<1. This explains why at 445 and 430 nm, where|B|is small, the SH isotherm actually goes below the neat air/water value, which is unity, as the bulk concentration of DEPNA increases, Figure 4. At shorter
wavelengths where B is larger, IXZX(2)DEPNAgoes above the value for the neat water/air interface. A contains contributions from both the real part of the resonant term ofχIJK,Resonant(2)DEPNA and the nonresonant termχIJK,Nonresonant(2)DEPNA , which is the reason that A does not show the pure resonant behavior that B does. Since B only contains contributions from the resonant terms of the suscep-tibility, fitting of B as a function of SH wavelength should give the peak position of the resonance. In Figure 5 the solid line is a fit to eq 5, yielding a peak position of 376 (5 nm. This result is consistent with the 373(4 nm value ofλmax, obtained from the fitting to eq 4. The agreement between the values obtained for the two different methods is good and provides a self-consistent check on the accuracy of the determination of the polarity of the air/water interface.
The interface spectrum can be related to the DEPNA solvent polarity scale. The correlatedπ* value for DEPNA is given by eq 8.19
νmaxis the absorption band peak in units of 103cm-1. On this scale, bulk water has aπ* value of 1.35 and n-hexane is-0.06. In the gas phase DEPNA peaks at 329 nm, corresponding to a π* value of-0.90.
50 The peak wavelength of DEPNA at the
air/water interface, 373(4 nm, yields a polarity value ofπ* ) 0.22 ( 0.07 (Viz., eq 8). The polarity of the air/water interface appears very different from that of bulk water (π*) 1.35), a very polar medium, and that of the vapor phase (π*) -0.90). The measured polarity of the air/water interface (0.22 ( 0.07, 373( 4 nm) is similar to that of nonpolar solvents such as carbon tetrachloride (π* ) 0.26, 375 nm) and butyl ether (π*)0.21, 372 nm).
47
Spectral shifts at the air/water interface were also observed for ET(30), a negative solvatochromic polarity indicator mol-ecule. The polarity of the air/water interface probed by ET-(30) is similar to those of bulk CCl4and butyl ether, i.e. the
same as the DEPNA results reported in this paper. Since DEPNA and ET(30) have different solvatochromism, i.e. DEPNA red shifts and ET(30) blue shifts with increasing solvent polarity, the ET(30) results together with the DEPNA results show that the polarity results are general.
The observation that the polarity of the air/water interface is less than that of bulk water is consistent with expectations.16,37,51
However, the finding that the polarity at the air/water interface is comparable to that of bulk nonpolar solvents, i.e. CCl4and
butyl ether, is perhaps surprising at first glance. In the bulk solution the polar solute molecule experiences both local and long-range interactions, whereas at the air/water interface the solute lacks “one-half” of the long-range interactions and experiences a change in its local solvation compared with that in the bulk.
4. Conclusion
The polarity of the air/water interface has been determined through the surface-specific measurement of the SH electronic spectrum of the polarity indicator molecule, DEPNA. In terms of the DEPNAπ* scale, the air/water interface corresponds to a value of 0.22(0.07 (373(4 nm), similar to very nonpolar solvents, such as carbon tetrachloride (π*)0.26, 375 nm) and butyl ether (π*)0.21, 372 nm). The DEPNA results together with the ET(30) results, which will be reported elsewhere, show that the polarity results of the air/water interface are general. This study puts the polarity of the air/water interface on a quantitative polarity scale. Analogous to the value of bulk solvent polarity in describing equilibrium and dynamic processes TABLE 2: Wavelength Dependence of the Real (A) and
Imaginary (B) Parts of the DEPNA Second-Order Polarizability (Eq 7)
second-harmonic wavelength (nm)
445 430 405 388 371 362
A -0.0045 -0.0064 0.0000 0.0013 0.0024 0.0022 B 0.0047 0.0087 0.0124 0.0143 0.0155 0.0140
Figure 5. Plot of A and B from eq 7 vs wavelength. Fitting of B gives a peak at 376(5 nm, consistent with the SH spectrum (Figure 3a).
χ(2)DEPNA)N Surface DEPTA R (2)DEPNA≈ C〈R (2)DEPNA〉 Orientation (6)
IIJK(2)DEPNA)|1+AC+iBC|
2 )(1+AC) 2 +(BC) 2 (7) π*) νmax-27.52 -3.182 (8)
in the bulk, the development of an interface polarity scale permits correlations between various interfacial molecular properties, interfacial reaction equilibrium constants, and reac-tion rate constants.
Acknowledgments. The authors thank the Division of
Chemical Science of the Department of Energy for its support and the National Science Foundation for equipment support. Thanks also go to Dr. Ruo Xu and Shisun (Xuegong) Lei for help in the synthesis of DEPNA.
References and Notes
(1) Berthelot, M.; De Saint-Gilles, L. P. Ann. Chim. Phys. 3. Se´r. 1862,
65, 385.
(2) Berthelot, M.; De Saint-Gilles, L. P. Ann. Chim. Phys. 3. Se´r. 1862,
66, 5.
(3) Berthelot, M.; De Saint-Gilles, L. P. Ann. Chim. Phys. 3. Se´r. 1863,
68, 255.
(4) Simon, J. D. Acc. Chem. Res. 1988, 21, 128.
(5) Rettig, W.; Baumann, W. In Progress in Photochemistry and
Photophysics; Rabek, J. F., Ed.; CRC Press: Boca Raton, FL, 1989; Vol.
6.
(6) Claisen, L. Justus Liebigs Ann. Chem. 1896, 291, 25. (7) Wislicenus, W. Justus Liebigs Ann. Chem. 1896, 291, 147. (8) Knorr, L. Justus Liebigs Ann. Chem. 1896, 293, 70.
(9) Recent comprehensive reviews can be found in the special issue of Chem. ReV. 1992, 92 (3).
(10) Reichardt, C. Chem. ReV. 1994, 94, 2319.
(11) Reichardt, C. SolVent and SolVent Effects in Organic Chemistry,
2nd ed.; VCH Publishers: Weinheim, 1988; Chapter 6.
(12) Kamlet, M. J.; Abboud, J. L.; Taft, R. W. In Progress in Physical
Organic Chemistry; Cohen, S. G., Streitwieser, A., Taft, R. W., Eds.;
Wiley: New York, 1981; Vol. 13, p 485.
(13) Buncel, E.; Rajagopal, S. Acc. Chem. Res. 1990, 23, 226. (14) Marcus, Y. Chem. Soc. ReV. 1993, 409.
(15) Langan, J. G.; Sitzmann, E. V.; Eisenthal, K. B. Chem. Phys. Lett. 1984, 110, 521.
(16) Bayliss, N. S.; McRae, E. G. J. Phys. Chem. 1954, 58, 1002. (17) Ehrenson, S. J. Am. Chem. Soc. 1981, 103, 6036.
(18) Brady, J. E.; Carr, P. W. J. Phys. Chem. 1985, 89, 5759. (19) Kamlet, M. J.; Hall, T. N.; Boykin, J.; Taft, R. W. J. Org. Chem. 1979, 44, 2599.
(20) Buncel, E.; Rajagopal, S. J. Org. Chem. 1989, 54, 798. (21) Shen, Y. R. Annu. ReV. Phys. Chem. 1989, 40, 327.
(22) Corn, R. M.; Higgins, D. A. Chem. ReV. 1994, 94, 107.
(23) Richmond, G. L.; Robinson, J. M.; Shannon, V. L. Prog. Surf. Sci. 1988, 28, 1.
(24) Eisenthal, K. B. Acc. Chem. Res. 1993, 26, 636.
(25) Hicks, J. M.; Kemnitz, K.; Eisenthal, K. B.; Heinz, T. F. J. Phys.
Chem. 1986, 90, 560.
(26) Lay, M. B.; Drummond, C. J.; Thistlethwaite, P. J.; Grieser, F. J.
Colloid Interface Sci. 1989, 128, 602.
(27) Zachariasse, K. A.; Phuc, N. v.; Kozankiewicz, B. J. Phys. Chem. 1981, 85, 2676.
(28) Drummond, C. J.; Grieser, F.; Healy, T. W. Faraday Discuss. Chem.
Soc. 1986, 81, 95.
(29) Warr, G. G.; Evans, D. F. Langmuir 1988, 4, 217. (30) Michels, J. J.; Dorsey, J. G. Langmuir 1990, 6, 414.
(31) Lindley, S. M.; Flowers, G. C.; Leffler, J. E. J. Org. Chem. 1985,
50, 607.
(32) Perera, J. M.; Stevens, G. W.; Grieser, F. Colloids Surf., A 1995,
95, 185.
(33) Zhao, X.; Subrahmanyan, S.; Eisenthal, K. B. Chem. Phys. Lett. 1990, 171, 558.
(34) Zhao, X. L.; Ong, S. W.; Eisenthal, K. B. Chem. Phys. Lett. 1993,
202, 513.
(35) Wang, H.; Zhao, X. L.; Eisenthal, K. B. To be published. (36) Xiao, X.-D.; Vogel, V.; Shen, Y. R. Chem. Phys. Lett. 1989, 163, 555.
(37) Shi, X.; Borguet, E.; Tarnovsky, A. N.; Eisenthal, K. B. Chem.
Phys. 1996, 205, 167.
(38) Bloembergen, N. Nonlinear Optics; Benjamin: New York, 1965. (39) Heinz, T. F. Second-Order Nonlinear Optical Effects at Surfaces
and Interfaces; Elsevier: Amsterdam, 1991.
(40) Shen, Y. R. Principles of Nonlinear Oprics; Wiley: New York, 1984.
(41) Marowsky, G.; Gierulski, A.; Dick, B. Optics Commun. 1985, 52, 339.
(42) Tom, H. W. K.; Heinz, T. F.; Shen, Y. R. Laser Chem. 1983, 3, 279.
(43) Petralli, T.; Wong, T. M.; Byers, J. D.; Yee, H. I.; Hicks, J. M. J.
Phys. Chem. 1993, 97, 1383.
(44) Nguyen, D. C.; Muenchausen, R. E.; Keller, R. A.; Nogar, N. S.
Opt. Commun. 1986, 60, 111.
(45) Yam, R.; Berkovic, G. Langmuir 1993, 9, 2109.
(46) Behr, L. C.; Kirry, J. E.; MacDonald, R. N.; Todd, C. W. J. Am.
Chem. Soc. 1946, 68, 1296.
(47) Kamlet, M. J.; Taft, R. W. J. Am. Chem. Soc. 1976, 98, 377. (48) Adamson, A. W. Physical Chemistry of Surfaces, 4th ed.; John Wiley & Sons: New York, 1982; Chapter 3, p 73.
(49) Bhattacharyya, K.; Sitzmann, E. V.; Eisenthal, K. B. J. Chem. Phys. 1987, 87, 1442.
(50) Essfar, M.; Guiheneuf, G.; Abboud, J. M. J. Am. Chem. Soc. 1982,
104, 6786.