A CASE STUDY ON THE ROLE OF EXCEL AS A TEACHING AND LEARNING TOOL IN INFLUENCING LEARNERS’ INTERPRETATION OF
FUNCTIONS
by
LWAZI ZAKUMBA 203044746
Submitted in fulfilment of the requirements for the degree of
Magister Educationis
in the Faculty of Education at the Nelson
Mandela Metropolitan University.
DEGREE: M Ed. (R) Faculty of Education
NMMU
SUPERVISOR: DR LYN WEBB
ii
DECLARATION BY STUDENT
FULL NAME: LWAZI ZAKUMBA
STUDENT NUMBER: 203044746
QUALIFICATION: MEd
TITLE: A case study on the role of Excel as a teaching and learning tool in influencing learner’s
interpretation of functions
DECLARATION
In accordance with Rule G4.6.3, I hereby declare that the above-mentioned treatise/ dissertation/ thesis is my own work and that it has not previously been submitted for assessment or completion of any postgraduate qualification to another University or for another qualification.
SIGNATURE: __________________________
iii ABSTRACT
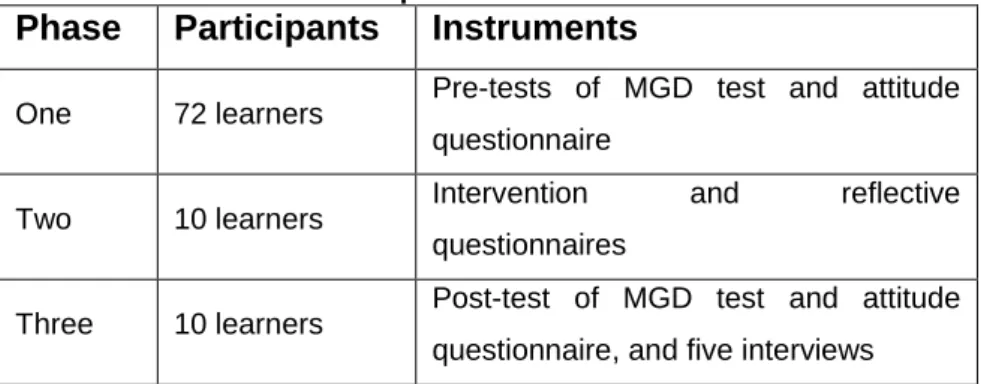
The aim of this study was to investigate the role Excel could play in influencing Mathematics and Mathematical literacy learners’ interpretation of functions and their attitude towards Mathematics. I used a Mathematical Graphical Diagnostic (MGD) test, an attitude questionnaire, a reflective questionnaire and semi-structured interviews as instruments. The MGD test and the attitude questionnaire were given to 72 volunteer grade 11 learners at a former Model C school in Port Elizabeth, in the Eastern Cape. This group included 50 pure Mathematics learners and 22 Mathematical literacy learners.
From this group, a smaller group of 10 learners further took part in the rest of the study were they went through an intervention were Excel was used as a teaching tool, covering concepts concerning functions. This group included 6 pure Mathematics and 4 Mathematical literacy learners. The 10 learners then re-wrote the MDG test and refilled the attitude questionnaire after the intervention. A reflective questionnaire was administered to the 10 learners after the intervention, with 5 learners from the 10 undergoing interviews in order to meet the objectives of the study. The administration of the MDG test and attitude questionnaire, interviews and reflective questionnaire enabled me to explore the relationship between learner performance and their attitude towards Mathematics as a subject, as well as the comparing the attitudes and performances between pure Mathematics and Mathematical Literacy learners. The study followed a qualitative research design, with an element of quantitative research. The qualitative data yielded findings that revealed the effectiveness of using Excel in teaching functions while the quantitative data revealed the difference in attitude and ability between pure Mathematics and Mathematical Literacy leaners.
The findings of the study revealed that Excel played a major role in improving pure Mathematics learners’ results but not those of the Mathematical Literacy
iv
learners. The study also showed that technology does not necessarily impact on learners’ attitudes positively.
Key words: Excel Functions Graphs Ability Attitude Mathematics Mathematical literacy
v ACKNOWLEDGEMENTS
This thesis would not be possible without the help of the following:
Lynette Webb, my supervisor. I thank you for your energy, belief and never-ending words of encouragement, which have given me strength to push through during the difficult times.
Marcelle Simpson, my editor. I thank you for your steadfast support and help through it all.
Mzukisi and Fezeka Sidlabane, my parents, for their love and support.
Nwabisa Zakumba, the woman of my dreams. Thank you for your sacrifices.
I gratefully acknowledge the financial assistance provided by NMMU and by the Eastern Cape Department of Basic Education.
And lastly, my Lord and Saviour, for blessing me with so many wonderful people.
Give thanks to the Lord, for He is good! For His mercy endures forever. (Psalm 106:1)
vi TABLE OF CONTENTS ABSTRACT ... III ACKNOWLEDGEMENTS ... V TABLE OF CONTENTS ... VI LIST OF FIGURES ... IX LIST OF TABLES ... XI CHAPTER ONE ... 1 OVERVIEW OF STUDY ... 1 1.1 INTRODUCTION ... 1 1.2 BACKGROUND ... 3
1.3 STATEMENT OF THE PROBLEM ... 4
1.4 RESEARCH AIM AND OBJECTIVES ... 6
1.4.1 AIM OF THE RESEARCH ... 6
1.4.2 OBJECTIVES OF THE RESEARCH ... 6
1.5 RESEARCH QUESTION AND SUB-QUESTIONS ... 6
1.6 LITERATURE REVIEW ... 7
1.6.1 THE IMPORTANCE OF MATHEMATICS ... 8
1.6.2 INTEGRATION OF ICT INTO TEACHING AND LEARNING ... 8
1.6.3 THEORETICAL FRAMEWORK ... 9
1.6.4 THE IMPACT OF ICT ... 10
1.6.5 SCHOOL BACKGROUND ... 11
1.7 RESEARCH DESIGN AND METHODOLOGY ... 11
1.7.1 METHOD ... 13
1.7.2 SAMPLING ... 13
1.7.3 INSTRUMENTS ... 14
1.7.4 LIMITATIONS OF THE STUDY ... 14
1.8 ETHICAL CONSIDERATIONS ... 14 1.9 CONCLUSION ... 15 CHAPTER TWO ... 17 LITERATURE REVIEW ... 17 2.1 INTRODUCTION ... 17 2.2 THE CHALLENGES ... 17
vii
2.4 TECHNOLOGY IN THE CLASSROOM ... 22
2.4.1 WHY TECHNOLOGY? ... 24
2.4.2 THE EFFECTS OF THE USE OF COMPUTERS ON MATHEMATICS ... 24
2.4.3 THE IMPACT OF THE USE OF COMPUTERS ON LEARNERS’ ATTITUDES ... 25
2.4.4 THE IMPACT OF THE USE OF COMPUTERS ON LEARNERS’ UNDERSTANDING ... 26
2.4.5 VISUALISATION ... 27
2.5 THEORETICAL FRAMEWORK OF THE STUDY ... 28
2.6 ICT AND MATHEMATICS: WHY SPREADSHEETS? ... 30
2.6.1 WHAT IS A SPREADSHEET? ... 30
2.6.2 ICT CHARACTERISED CLASSROOMS ... 31
2.7 CONCLUSION ... 32 CHAPTER THREE ... 34 RESEARCH METHODOLOGY ... 34 3.1 INTRODUCTION ... 34 3.2 RESEARCH PARADIGMS ... 34 3.3 RESEARCH DESIGN ... 36 3.4 RESEARCH METHODOLOGY ... 38
3.4.1 INSTRUMENTS UTILISED IN THE STUDY ... 39
3.4.2 DATA COLLECTION ... 40 3.4.2.1 Phase one ... 41 3.4.2.2 Phase two ... 49 3.4.2.3 Phase three ... 81 3.4 CONCLUSION ... 82 CHAPTER FOUR ... 84
FINDINGS AND DISCUSSIONS ... 84
4.1 INTRODUCTION ... 84
4.2 PHASE ONE ... 86
4.2.1 MGD TEST RESULTS ... 87
4.2.2 ATTITUDE QUESTIONNAIRE RESULTS ... 93
4.2.3 ABILITY AND ATTITUDE RELATION RESULTS ... 95
4.2.3.1 Relationship between ability and usefulness of Mathematics ... 96
4.2.3.2 Relationship between ability and confidence in Mathematics ... 100
viii
4.3.1 SESSION ONE WORKSHEETS ... 108
4.3.2 SESSION TWO WORKSHEET ... 111
4.3.3 REFLECTIVE QUESTIONNAIRES... 112
4.4 PHASE THREE ... 115
4.4.1 COMPARISON OF PRE-TEST AND POST-TEST RESULTS ... 116
4.4.2 COMPARISON OF PRE AND POST-ATTITUDE QUESTIONNAIRES RESULTS ... 120
4.4.3 INTERVIEWS ... 123
4.4.3.1 Part one of MGD test... 125
4.4.3.2 Part two of MGD test ... 135
4.5 CONCLUSION ... 136
CHAPTER FIVE ... 138
CONCLUSIONS AND RECOMMENDATION ... 138
5.1 INTRODUCTION ... 138
5.2 MAIN FINDINGS ... 139
5.2.1 TO ASCERTAIN IF THERE WAS ANY RELATIONSHIP BETWEEN THE ACHIEVEMENT LEVELS OF LEARNERS AND THEIR ATTITUDES TOWARDS THE SUBJECT OF MATHEMATICS AS A WHOLE ... 139
5.2.2 TO ASCERTAIN IF THERE WERE DIFFERENCES IN ATTITUDE TOWARDS MATHEMATICS BETWEEN PURE MATHEMATICS LEARNERS AND MATHEMATICAL LITERACY LEARNERS ... 139
5.2.3 TO ASCERTAIN IF USING EXCEL HAD AN EFFECT ON LEARNERS’ ATTITUDES TOWARDS MATHEMATICS ... 140
5.2.4 TO ASCERTAIN IF THERE WAS ANY DIFFERENCE BETWEEN THE ACHIEVEMENT LEVELS OF PURE MATHEMATICS AND MATHEMATICAL LITERACY LEARNERS AFTER AN INTERVENTION USING EXCEL... 141
5.3 LIMITATIONS ... 142 5.4 RECOMMENDATIONS ... 143 REFERENCES ... 145 APPENDICES ... 155 APPENDIX A ... 155 APPENDIX B ... 170 APPENDIX C ... 172 APPENDIX D ... 174 APPENDIX E ... 176 APPENDIX F ... 177 APPENDIX G ... 179
ix LIST OF FIGURES
FIGURE 2.1:INTERPLAY BETWEEN CONTENT, CONTEXT AND PROBLEM-SOLVING
SKILLS IN MATHEMATICAL LITERACY (BROMBACHER,2007) ... 21
FIGURE 2.2:THE FIVE STRANDS OF MATHEMATICAL PROFICIENCY ... 29
FIGURE 3.1:RESEARCH PARADIGMS (BURRELL &MORGAN,1979) ... 35
FIGURE 3.2:QUESTION 3 FROM MGD TEST ... 43
FIGURE 3.3:QUESTION 3(B) FROM DIAGNOSTIC TEST ... 43
FIGURE 3.4:QUESTION 5 FROM PART TWO OF THE MGD TEST ... 44
FIGURE 3.5:THE SEATING ARRANGEMENT OF THE LEARNERS DURING THE INTERVENTION SESSIONS ... 50
FIGURE 3.6:QUESTION 5(C) FROM THE MGD TEST ... 52
FIGURE 3.7:QUESTION 2 OF PART ONE OF THE MGD TEST ... 55
FIGURE 3.8QUESTION 3(A) OF PART ONE OF THE MGD TEST ... 56
FIGURE 3.9:QUESTION 3(B) OF PART ONE OF THE MGD TEST ... 56
FIGURE 3.10:QUESTION 4 OF PART ONE OF THE MGD TEST ... 57
FIGURE 3.11:QUESTION 3 OF PART TWO OF THE MGD TEST ... 58
FIGURE 3.12:QUESTION 4 OF PART TWO OF THE MGD TEST ... 58
FIGURE 3.13:QUESTION 5 OF PART TWO OF THE MGD TEST ... 59
FIGURE 3.14:TABLE OF VALUES FOR INTRODUCTORY STRAIGHT LINE GRAPH ... 60
FIGURE 3.15:THE GRAPH USED DURING THE INTRODUCTION OF SESSION ONE ... 61
FIGURE 3.16:SECOND GRAPH USED DURING THE INTRODUCTORY PHASE OF SESSION ONE ... 62
FIGURE 3.17:QUESTION 1 FROM THE WORKSHEET IN SESSION ONE ... 64
FIGURE 3.18:QUESTION 2 FROM THE WORKSHEET GIVEN IN SESSION ONE ... 65
FIGURE 3.19:QUESTION 3 FROM THE WORKSHEET GIVEN IN SESSION ONE ... 66
FIGURE 3.20:THE TABLE OF VALUES USED FOR THE GRAPH IN FIGURE 3.19... 67
FIGURE 3.21:THE REFLECTIVE QUESTIONNAIRE GIVEN TO LEARNERS ... 68
FIGURE 3.22:QUESTION 5 OF PART ONE OF THE MGD TEST ... 69
FIGURE 3.23:QUESTION 5(C) OF PART ONE OF THE MGD TEST ... 70
FIGURE 3.24:QUESTION 2 OF PART TWO OF THE MGD TEST ... 71
FIGURE 3.25:QUESTION 6 OF PART ONE OF THE MGD TEST ... 72
x
FIGURE 3.27:HYPERBOLIC GRAPH FOR GRAPH L=24/B ... 73
FIGURE 3.28:AN EXPONENTIAL GRAPH FROM SESSION TWO ... 74
FIGURE 3.29:COMPOUND AND SIMPLE INTEREST GRAPHS ... 76
FIGURE 3.30:QUESTION 1 OF WORKSHEET TWO ... 77
FIGURE 3.31:QUESTION 2 FROM WORKSHEET TWO ... 79
FIGURE 3.32:TABLE OF VALUES FOR PARABOLA GRAPH... 79
FIGURE 3.33:QUESTION 3 FROM WORKSHEET TWO ... 80
FIGURE 3.34:QUESTION 4 FROM WORKSHEET ... ERROR!BOOKMARK NOT DEFINED. FIGURE 4.1:LEARNERS’ PERFORMANCES IN PART ONE OF THE MGD TEST ... 90
FIGURE 4.2:COMPARISON BETWEEN RESULTS FOR QUESTION Q1.7A BETWEEN PURE MATHEMATICS AND MATHEMATICAL LITERACY LEARNERS ... 91
FIGURE 4.3:LEARNERS’ PERFORMANCE IN PART TWO OF THE MGD TEST ... 92
FIGURE 4.4:PURE MATHEMATICS AND MATHEMATICAL LITERACY LEARNER ATTITUDES IN TERMS OF THE USEFULNESS OF MATHEMATICS ... 93
FIGURE 4.5:PURE MATHEMATICS AND MATHEMATICAL LITERACY LEARNER ATTITUDES IN TERMS OF LEARNERS’ CONFIDENCE IN DOING MATHEMATICS .... 94
FIGURE 4.6:GRAPH RELATING TO QUESTION 2.3 ... 109
FIGURE 4.7:SECTION ONE OF QUESTION 3 ... 125
FIGURE 4.8:SECTION TWO OF QUESTION 3 ... 126
FIGURE 4.9:QUESTION 5(A) ... 129
FIGURE 4.10:GRAPH USED IN INTERVIEW FOR QUESTION 5(C) ... 131
xi LIST OF TABLES
TABLE 1.1TABLE SHOWING PERCENTAGE PASS RATES FOR MATHEMATICS AND MATHEMATICAL LITERACY BETWEEN 2008 AND 2010 ... 7
TABLE 2.1A SUMMARY OF MATHEMATICS RESULTS FROM 2008 TO 2010 ... 19
TABLE 2.2:BREAKDOWN OF LEARNER PERFORMANCE IN THE FINAL PAPER 1 IN
2009 AND 2010 ... 19
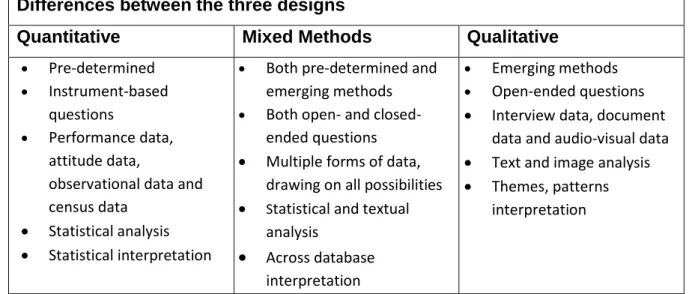
TABLE 3.1:DIFFERENCES BETWEEN RESEARCH DESIGNS (CRESSWELL,2009) .... 37
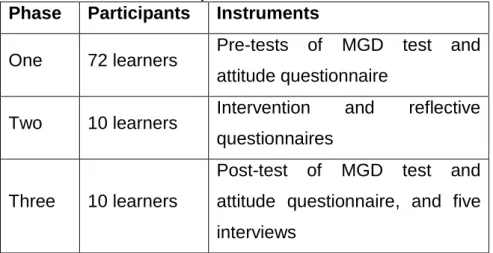
TABLE 3.2:OVERVIEW OF EACH PHASE OF THE RESEARCH... 40
TABLE 4.1:OVERVIEW OF EACH PHASE OF THE RESEARCH... 84
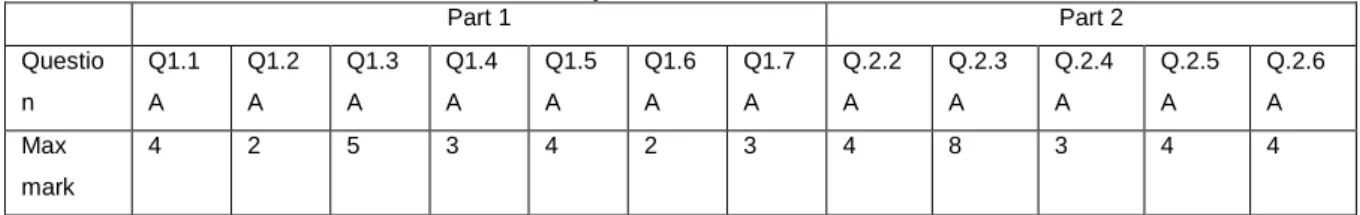
TABLE 4.2:THE MAXIMUM MARKS FOR EACH QUESTION IN THE MGD TEST ... 87
TABLE 4.3:MGD TEST PART ONE RESULTS FOR THE WHOLE GROUP OF
LEARNERS ... 88
TABLE 4.4:MGD TEST PART TWO RESULTS FOR THE WHOLE GROUP OF
LEARNERS ... 88
TABLE 4.5:PURE MATHEMATICS LEARNERS’ DESCRIPTIVE STATISTICS FOR THE PRE-TEST ... 89
TABLE 4.6:MATHEMATICAL LITERACY LEARNERS’ DESCRIPTIVE STATISTICS FOR THE PRE-TEST ... 90
TABLE 4.7:CRONBACH’S COEFFICIENT ALPHA ... 95
TABLE 4.8:RELATIONSHIP BETWEEN ABILITY AND USEFULNESS OF MATHEMATICS FOR THE WHOLE GROUP ... 97
TABLE 4.9:PURE MATHEMATICS LEARNERS’ PERFORMANCE AND THEIR VIEW OF THE USEFULNESS OF MATHEMATICS ... 98
TABLE 4.10:MATHEMATICAL LITERACY LEARNERS’ PERFORMANCE AND THEIR VIEW ON THE USEFULNESS OF MATHEMATICS ... 98
TABLE 4.11:PURE MATHEMATICS LEARNERS’ TEST AND ATTITUDE
QUESTIONNAIRE RESULTS FOR PART TWO OF THE MGD TEST ... 99
TABLE 4.12:MATHEMATICAL LITERACY LEARNERS’ TEST AND ATTITUDE
QUESTIONNAIRE RESULTS FOR PART TWO OF TEST ... 99 TABLE 4.13:RELATIONSHIP BETWEEN ABILITY AND CONFIDENCE IN
MATHEMATICS FOR THE WHOLE GRAPH ... 101
TABLE 4.14:PURE MATHEMATICS LEARNERS’ RESULTS FOR CONFIDENCE
xii TABLE 4.15:MATHEMATICAL LITERACY LEARNERS’ RESULTS FOR CONFIDENCE
ATTITUDE QUESTIONNAIRE AND TEST IN PART ONE OF THE PRE-TEST ... 106 TABLE 4.16:PURE MATHEMATICS LEARNERS’ RESULTS FOR CONFIDENCE
ATTITUDE QUESTIONNAIRE AND TEST IN PART TWO OF THE PRE-TEST ... 106 TABLE 4.17:MATHEMATICAL LITERACY LEARNERS’ RESULTS FOR CONFIDENCE
ATTITUDE QUESTIONNAIRE AND TEST IN PART ONE OF THE PRE-TEST ... 107
TABLE 4.18:LEARNER PERFORMANCES IN WORKSHEET ONE... 108 TABLE 4.19:LEARNER PERFORMANCES IN SESSION TWO ... 112 TABLE 4.20:OVERALL PERFORMANCE OF LEARNERS BETWEEN PHASE ONE AND
PHASE THREE ... 117
TABLE 4.21:PURE MATHEMATICS LEARNERS’ PERFORMANCE FOR POST-TEST ... 117 TABLE 4.22MATHEMATICAL LITERACY LEARNERS’ PERFORMANCE FOR
POST-TEST ... 117
TABLE 4.23:COMPARISON OF PURE MATHEMATICS RESULTS IN PART ONE OF THE MGD TEST ... 118
TABLE 4.24:COMPARISON OF MATHEMATICAL LITERACY RESULTS IN PART ONE OF THE MGD TEST ... 119
TABLE 4.25:COMPARISON OF PURE MATHEMATICS RESULTS IN PART TWO OF
MGD TEST ... 119
TABLE 4.26:COMPARISON OF MATHEMATICAL LITERACY RESULTS IN PART TWO OF MGD TEST... 119
TABLE 4.27:PRE- AND POST-INTERVENTION CONFIDENCE ATTITUDE RESULTS .... 121
TABLE 4.28:PRE- AND POST-INTERVENTION USEFULNESS ATTITUDE RESULTS ... 121
TABLE 4.29:PURE MATHEMATICS LEARNERS’ PRE- AND POST-INTERVENTION
ATTITUDE RESULTS IN TERMS OF THE USEFULNESS OF MATHEMATICS ... 121
TABLE 4.30:MATHEMATICAL LITERACY LEARNERS’ PRE- AND POST-INTERVENTION ATTITUDE RESULTS IN TERMS OF THE USEFULNESS OF MATHEMATICS ... 121
TABLE 4.31:PURE MATHEMATICS LEARNERS’ PRE- AND POST-INTERVENTION
ATTITUDE RESULTS IN TERMS OF CONFIDENCE ... 122
TABLE 4.32:MATHEMATICAL LITERACY LEARNERS’ PRE- AND POST-INTERVENTION ATTITUDE RESULTS IN TERMS OF CONFIDENCE ... 122
TABLE 5.1SUMMARY OF THE PHASES AND THE INSTRUMENTS USED IN EACH PHASE
1 CHAPTER ONE
OVERVIEW OF STUDY
1.1 INTRODUCTION
Mathematics problems have been solved for too long by learners by using pen and paper, and yet some problems are too hard to be posed in such a manner. Some require visual representations—graphs, diagrams, geometric figures, moving images—that respond to students’ questions, answers or commands (Goldenberg, 2000). Visual representations offer more to both teachers and learners than the traditional pen and paper and, according to McCormick, DeFantim and Brown (1987), offer a method to see the unseen. Taking Mathematics from paper to Excel, making it more visual, will enable the learners to see the side of Mathematics that has been hidden (McCormick, DeFantim & Brown, 1987). That Mathematics is a subject that is ‘hidden’ to so many learners shows itself in both the learners’ performances in the subject and in their attitude towards it.
Mrs Angie Motshekga, Minister of Basic Education in South Africa, made the following statement during the announcement of the 2011 National Senior Certificate Grade 12 examination results on the 7th of January 2012: “We remain concerned about the
number of passes in Mathematics; 104 033 in 2011 which is less than the 124 749 of 2010. The pass rate for Mathematics is 46.3% in 2011, a decline from 47.4% in 2010” (DBE, 2011a)
Mathematics results have been a concern for the South African Department of Education for the past few years and nothing seems to be improving. A report by the Department of Basic Education (DBE, 2011c), which considers learners’ performance in Mathematics over the last three years, reveals some poor results; the 2011 Grade 12 Mathematics results reveal a deterioration rather than an improvement in the results, which, as mentioned above, has given rise to concern for the Minister. As a result of the worrying decline in Mathematics results, researchers have investigated which sections in Mathematics are more problematic for learners than others. Analysis
2
of the departmental publication containing learner performances in the final Grade 12 exams for the last three years shows that learners performed particularly badly in the sections of functions and financial mathematics (DBE, 2011c). Stemming from the poor results in these two particular sections of Mathematics, this study focuses on one of the sections, namely functions.
According to the Curriculum Assessment Policy Statement (CAPS) document, the weighting of functions in the pure Mathematics paper should be approximately 35 per cent and, in the Mathematical Literacy paper, approximately 15 per cent (DBE, 2011a & b). The relatively high weighting of this section in both the pure Mathematics and the Mathematical Literacy examinations is an indication of the importance of this section in the syllabus as a whole and therefore also signifies a strong need for learners to understand this section. It is clear that any level of improvement in learner performance in one section of the whole syllabus will facilitate a change in the current Grade 12 Matric results in both pure Mathematics and Mathematical Literacy. Any improvement in one part would have an impact on the whole. As the results have shown (DBE, 2011c), learners struggle with functions, giving rise to the need to conduct this study which focuses on tools that could help learners understand the section better.
The aim of this research was to test whether the introduction of Excel as a teaching tool would help learners interpret functions better, thus playing a role in their performance in Mathematics as well at having an impact on their attitudes towards Mathematics1 as a subject.
Many studies have been conducted on the impact of Integrated Computer Technology (ICT) on learner performance and learner attitude (Aiken, 1976; Collins, 1996; Way & Webb, 2006), and the conclusion drawn from these studies is that integrated computer technology (ICT) has a positive impact on learner performances if used appropriately. It was these studies that informed this research study regarding the impact of ICT on school Mathematics.
1 From this point forward, the term Mathematics will be used to incorporate both pure Mathematics
and Mathematical Literacy. The terms ‘pure Mathematics’ or ‘Mathematical Literacy’ are used when there is need to differentiate between the two subjects.
3
Much research has been conducted on Mathematics education, but there has been insufficient research related to the use of Excel in teaching functions in a South African school context. The interpretation of graphs, such as straight line, parabolic and exponential graphs, is an important part of the South African school syllabus. Helping learners to interpret graphs, amongst other things, prepares and equips them to become contributing workers and self-managing individuals when they graduate from the boundaries of the school environment to the sphere of adulthood.
This research study compared the aptitude for and attitude towards the section of functions of pure Mathematics and Mathematical Literacy learners according to subject choice.
1.2 BACKGROUND
The government is encouraging the use of computers in the classroom (DOE, 2003b). The advantage of using computers is that they can be used as powerful teaching and learning tools when compared with the traditional chalk-and-board method of teaching, and this is because of the visual aspect that they bring (Goldenberg, 2000). Research shows that the use of ICT can alter learners’ attitudes towards Mathematics (Iyer, 2011; Wenglinsky, 1998) and improve learners’ performances in Mathematics (Ai, 2002; Aiken, 1970 Ifamuyiwa & Akinsola, 2008). ICT, when used effectively as a teaching and learning tool, could assist with teaching functions better and thus help learners to understand this section of Mathematics better. This particular study examined whether the introduction of Excel as a teaching and learning tool had an impact on both learner aptitude and attitude. Attitude, however, was not the main focus of this study as much as learner performance.
From the researcher’s own experience as both a Computer Applications Technology (CAT) and Mathematics teacher, teaching both pure Mathematics and Mathematical Literacy, it is evident that there is a strong need to teach for understanding in Mathematics. From this experience and from studying the Grade 12 learner performances (DBE, 2011c) in the Mathematics papers, it can be seen that many learners find functions challenging and, as a result, their attitude and performance
4
suffer. The focus of the research study was to research ways in which teachers, the researcher included, can help learners in Mathematics and Mathematical Literacy, with a particular focus on helping them with interpreting functions. The interpretation of functions is not a major part of the Mathematics and Mathematical Literacy functions section in the different syllabuses. However, it is the skill of interpretation of graphs that was the focus of this study as this skill will be required of the learners if they are to be contributing citizens in a society in which people are able to use Mathematics skills and processes to solve problems (DOE, 2003a).
1.3 STATEMENT OF THE PROBLEM
In six years of teaching both pure Mathematics and Mathematical Literacy, the researcher observed a large number of learners who struggled with the subject of Mathematics or aspects thereof. To be more specific, learners struggled with the section of functions in both pure Mathematics and Mathematical Literacy.
Another important observation that was made was that the learners who had difficulties with Mathematics tended to display a negative attitude towards the subject. Attitude, according to Kochhar (1993), is a dispositional readiness to respond to certain situations, persons or objects in a consistent manner that has been learned and has become one’s typical mode of response. Yoloye (1999) concedes that a learner’s attitude to a school subject is a determinant of whether he or she is drawn to or resistant to the subject. Thus a negative attitude towards Mathematics can be, in light of Yoloye (1999), the reason that a learner is resistant to the subject.
These observations about poor achievement results and negative attitudes toward the subject are a major concern, not only for the education department but for each individual teacher in the classroom.
Since functions carry about a 35 per cent weighting in the pure Mathematics syllabus and a 15 per cent weighting in the Mathematical Literacy syllabus, a slight change in how learners understand this section would have an impact on the overall learner achievement levels.
5
Many learners struggle with Mathematics, as the Grade 12 results of the past three years have shown. It is important to note that this problem is not just in Grade 12, but becomes more evident in Grade 12 when the learners are about to exit high school. When learners struggle, both their results and their attitudes towards the subject suffer. In an attempt to change the situation, the researcher decided to investigate how ICT could be used to improve the current situation in the country by doing a case study of how these changes could be implemented in one school.
In this study, the identified problem was that learners seemed to be unable to interpret functions and that they tended to have a negative attitude towards Mathematics in general. The aim of the study was to explore and understand the impact of Excel as a teaching and learning tool on learner performance and attitude.
Much research has been done on Mathematics and ICT, as well as on ICT and attitude (Funkhouser, 1993; Goodwin & Sutherland, 2004); however, not many studies have been conducted on the impact of Excel as a teaching and learning tool to help learners in the South African school context in their understanding and interpretation of functions.
In this study, context-filled classroom questions that pure Mathematics and Mathematical Literacy learners solve using pen and paper were converted into functions on Excel so that they could begin to see, by manipulating the formulas used to generate such graphs, the impact each variable in a given formula had on the shape of the graph. The purpose of this research was to investigate the influence of using Excel on learners’ understanding and attitude towards Mathematics by focusing on the interpretation of functions.
With regards to the aspect of attitude, the area of interest was whether there was a difference in learner attitude towards Mathematics before ICT was introduced as compared to after and, in short and without deviating from the main questions, answer the question does the introduction of Excel affect learner attitude towards Mathematics as well as their understanding of it?
6
This research could help teachers to teach Mathematics in a more visually stimulating and enjoyable way, which could have an impact on learners’ understanding and also, directly or indirectly, improve their attitude.
1.4 RESEARCH AIM AND OBJECTIVES
1.4.1 Aim of the research
The aim of the research study was to examine whether the use of Excel as a teaching and learning tool influenced learners’ ability to interpret functions.
1.4.2 Objectives of the research
The objectives of the research study were as follows:
1) To ascertain if there was any relationship between the achievement levels of learners and their attitudes towards the subject of Mathematics as a whole.
2) To ascertain if there were differences in attitude towards Mathematics between pure Mathematics learners and Mathematical Literacy learners.
3) To ascertain if using Excel had an effect on learners’ attitudes towards Mathematics.
4) To ascertain if there was any difference between the achievement levels of pure Mathematics and Mathematical Literacy learners after an intervention using Excel.
1.5 RESEARCH QUESTION AND SUB-QUESTIONS
The main research question was: Does the use of Excel as a teaching and learning tool influence learners’ ability to interpret functions?
The main research question was divided into the following sub-questions:
1) Is there any relationship between the achievement levels of learners and their attitudes towards the subject of Mathematics as a whole?
7
2) Is there any difference in attitude towards Mathematics between pure Mathematics learners and Mathematical Literacy learners?
3) Does using Excel have an effect on learners’ attitudes towards Mathematics? 4) Is there any difference between the achievement levels of pure Mathematics and
Mathematical Literacy learners after an intervention using Excel?
1.6 LITERATURE REVIEW
Since 1994, South African education has experienced major change. The education department progressed from a point at which quality of education was dependent upon one’s race to having one national education department with nine provincial departments (Padayachee, 2010). Padayachee (2010) states that the challenge that currently faces the country, and which it also faced during the governmental transition, is to build up the capacity in Mathematics and Science so as to improve the Grade 12 results in these subjects. The need to build the capacity in Mathematics is the primary focus of this study because, as the Grade 12 Matric results over the past few years have shown, the country's current capacity leaves much to be desired.
Regarding the period of the change in government since 1994, Crouch and Vinjevold (2006) noted that, during the transition, there was a large drop in the number of higher grade passes; in the old system, there were two levels of difficulty for most subjects, higher grade and lower grade. The situation has not changed and South Africa is still experiencing challenges with the pass rate of Mathematics. Both a departmental report (DBE, 2011c) and Sasman (2011) point out just how much of a problem there is with Mathematics in the country, showing that the pass rates for pure Mathematics between the years 2008 to 2010 have all been under 50 per cent.
Table 1.1 Table showing percentage pass rates for mathematics and mathematical literacy between 2008 and 2010
YEAR MATHS PASS RATE (%) ML PASS RATE (%)
2008 45.4 78.6
2009 46.0 74.4
8
Table 1.1 shows the results of the learners’ Grade 12 Mathematics results for the years 2008 until 2010 (DBE, 2011c). From the table, it can be observed that the Mathematical Literacy pass rate is higher than the Mathematics rate.
Looking at the Mathematics results makes evident the need to change the situation. This study brings Excel to the forefront as a teaching and learning tool with the purpose of changing of this situation.
The importance of Mathematics is examined:
in terms of the integration of technology and Mathematics, and
then on the basis of Mathematics’ importance in society, which transcends a number of different fields, in terms of the business and working world, as well as everyday life.
This discussion is followed by an examination of the impact on technology on both learner performance and attitude.
1.6.1 The importance of Mathematics
Mathematics is seen as important because a strong mathematical background is necessary for many careers in an increasingly technological society (Sasman, 2011). It is primarily this importance of Mathematics that raises the need for teachers, and all the other stakeholders in the educational sphere, to help learners to understand the subject better.
1.6.2 Integration of ICT into teaching and learning
The South African education department has documented, in the National Curriculum Statement (NCS) (DOE, 2003a & c) and CAPS (DBE, 2011a & b), the direction and vision of the education system. These two governmental documents continue to be reviewed for more clarity regarding what is expected of all the stakeholders, which include the teachers, the department, the parents and the learners. From these documents, a picture is painted of the importance of the subjects pure Mathematics and Mathematical Literacy, as well as of the framework and building blocks of the syllabus for these subjects. One of the nine principles spoken of is integration.
9
Integration, by definition, is the incorporation of knowledge and skills across different subjects in the curriculum (DOE, 2003a). One aspect of the aims of this research study was to integrate Mathematics teaching with computers, thus satisfying one of the principles upon which the curriculum is founded. The White Paper on e-Education (DOE, 2003b) encourages the integration of ICT into teaching and learning. Through this integration, one is able to create an environment that maximises learners’ learning opportunities (Galligan, Loch, McDonald & Taylor, 2010), an effect which is desirable in the Mathematics classroom.
Learners need to acquire the necessary skills in order to be proficient in Mathematics, skills like problem solving, critical thinking and analysing data (DBE, 2011a). Kilpatrick, Swafford and Findell’s (2001) five stands of mathematical proficiency is the theory on which this study is based.
1.6.3 Theoretical framework
As its theoretical framework, this research study focused on Kilpatrick, Swafford and Findell’s (2001) five strands of mathematical proficiency and Hadjidemetriou and Williams (2000). Kilpatrick et al. (2001) define five strands that they believe, if strengthened, will result in a learner becoming mathematically proficient. The term proficiency refers to what is necessary to learn Mathematics successfully (Kilpatrick et al., 2001). These strands are conceptual understanding, procedural fluency, strategic competence, adaptive reasoning and productive disposition. This research study focused on the conceptual understanding and adaptive reasoning strands and investigated how teachers can help learners with the interpretation of functions, using the visual advantage of Excel to better learners’ understanding of this section of Mathematics in order to improve their confidence and attitude and, simultaneously, their results in the subject.
Kilpatrick et al. (2001, p 116) define the strands as follows:
Conceptual understanding: comprehension of mathematical concepts, operations and relations
10
Procedural fluency: skill in carrying out procedures flexibly, accurately, efficiently and appropriately
Strategic competence: ability to formulate, represent, and solve mathematical problems
Adaptive reasoning: capacity for logical thought, reflection, explanation, and justification
Productive disposition: habitual inclination to see Mathematics as sensible, useful, and worthwhile, coupled with a belief in diligence and one’s own efficacy.
Proficiency in the mathematical work of teaching diverges sharply from the mathematical proficiency needed in other professions requiring mathematics. One of its aspects is an understanding of the mathematical thinking of learners, which may include, for example, recognising the mathematical nature of their errors and misconceptions (Kilpatrick et al., 2001).
Hadjidemetriou and Williams (2000) produced a Mathematical Graphical Misconception Diagnostic (MGD) test that serves as a diagnostic test for the learner misconceptions in graphs. The questions in the test that Hadjidemetriou and Williams (2000) developed, although its purpose is diagnostic in nature, it relates directly to the five strands mentioned by Kilpatrick et al. (2001). The misconceptions that Hadjidemetriou and Williams (2000) diagnose using the tests stem from a poor mathematical proficiency in learners.
The introduction of ICT into the Mathematical classroom has great benefit to both the conceptual understanding of the learners and their ability to develop adaptive reasoning. Thus ICT has a great impact in promoting mathematical proficiency in learners.
1.6.4 The impact of ICT
ICT can have an impact on both the learners’ attitude towards Mathematics and their performance, and research shows a strong correlation between these two factors (Funkhouser, 1993; Ganguli, 1992; Kulik, 1984; Way & Webb, 2006). Learner achievement and attitude are interrelated, and thus a discussion of the impact of ICT
11
on the learners’ attitude is included, even though this aspect is not the main focus of the research.
This research study examined the impact of ICT on both of these factors, and not necessarily their impact on each other, but with more emphasis on learner achievement. The study investigated how both of these factors were influenced by the introduction of Excel as a teaching and learning tool.
1.6.5 School background
The school in which this research was conducted was a former Model C school which was situated in the suburbs of Port Elizabeth. At the time of the research, the school had enrolled 1100 learners from Grade 8 to 12. Each grade consisted of approximately 217 learners. Pure Mathematics and Mathematical Literacy were offered to learners in Grade 10 to 12; in Grade 8 and 9, all learners studied Mathematics. Most learners in the senior grades, Grade 10 to 12, chose pure Mathematics: two out of three learners chose Mathematics over Mathematical Literacy.
The school was well-resourced with a strong functional leadership team and a very involved governing body.
In the Mathematics department, there was one Head of Department (HOD), two Subject Heads and one Learning Area Head. One teacher was the Subject Head for senior (Grade 10 to 12) pure Mathematics, one was the Subject Head for Mathematical Literacy and another was the Learning Area Head of junior (Grade 8 and 9) Mathematics.
The research design and methodology are discussed below.
1.7 RESEARCH DESIGN AND METHODOLOGY
In this research study, learners’ views, perceptions and feelings towards the use of Excel as a teaching and learning tool were investigated; their attitude towards Mathematics before and after the intervention also had to be properly understood. For
12
these reasons, a qualitative approach, by means of a case study, with a quantitative aspect was chosen for the research to allow the researcher to understand the learners’ perceptions and attitudes better (Struwig & Stead, 2001).
The following instruments were used: a pre-test, a post-test and a attitude questionnaires were used to gauge learners’ ability and attitudes towards Mathematics, an intervention, reflective questionnaires and interviews were also used. The pre-test and the post-test were used to test the learners’ level of understanding before and after the intervention was administered. A reflective questionnaire was used during the intervention session to assess the learners’ views of each intervention session, and then interviews were conducted after the intervention with five of the learners who participated in the intervention.
The research had three phases: phase one required that all the Grade 11s who volunteered to be part of the study write the pre-test and complete the attitude questionnaire. Phase two of the research further required the Grade 11 volunteers to be part of an intervention and then, in phase three, these participants wrote a post-test and filled in the same attitude questionnaire, and this was followed by interviews with the five learners.
The intervention consisted of three sessions in which Excel was used as a teaching and learning tool for the understanding of functions. The intervention sessions ran for 90 minutes each. Only one session was conducted a day and all three sessions were conducted over two weeks. At the end of the intervention, the same tests of aptitude and attitude were written by those learners who were part of the intervention session. Five of the learners were interviewed to gain a deeper understanding of the learners’ understanding of what they had written.
In order to meet all the objectives of the research study, a case study design was adopted in order for the researcher to attain a deeper understanding of the learners’ views, perceptions and feelings regarding the use of Excel as a teaching and learning tool as well as of their ability to interpret functions. At the same time, data were collected from the learners in order to compare learner achievement levels by examining their pre-test and post-test results(Creswell, 2009).
13 1.7.1 Method
There were 217 learners in Grade 11 at the school at which the study was conducted, with 76 studying Mathematical Literacy and 141 studying Mathematics. There were three Mathematical Literacy classes and six Mathematics classes, with an average of about 24 learners in each class. The research required that all the learners who volunteered to participate in phase one of the study complete the attitude questionnaire and the pre-test.
After the pre-test, the learners were given a questionnaire regarding their attitudes towards Mathematics. The results of the pre-test and the attitude questionnaire were analysed, summarised and recorded.
The intervention sessions, after the pre-test, were open to all learners who had completed the pre-test and questionnaire, and were conducted on a volunteer basis. In addition to the pre-test, post-test and questionnaire, interviews were conducted with five of the learners who participated in the intervention.
In the intervention, Excel was used as a teaching and learning tool in order to help learners to interpret functions and to endeavour to improve their understanding of functions. During the intervention sessions, probing questions were used so that the researcher could gauge the learners’ level of understanding of the concepts. The examples used were adapted from Van Dyke (2002) and Hadjidemetriou and Williams (2000).
1.7.2 Sampling
A purposive, convenience sampling method was used in order to ensure variation in the sample and to ensure that only interested participants, who had volunteered to be part of the study, were included in the sample (Struwig & Stead, 2001).
14 1.7.3 Instruments
For the qualitative data, reflective questionnaires were given to each learner who was part of the intervention. This data were used to analyse the learners’ views, perceptions and feelings, and underlying attitudes towards functions. After the intervention, interviews were conducted with five of the learners.
For the quantitative data, the results of the pre-test, post-test and attitude questionnaires were used. The attitude questionnaire was a modified Fennema-Sherman Mathematics Attitude Scale (Hyde, Fennema, Ryan, Frost & Hopp, 1990). This data allowed the researcher to gauge the effect of the intervention on the learners who participated in it.
1.7.4 Limitations of the study
The study was conducted at a well-resourced, former Model C school in the suburbs of Port Elizabeth. This study only considered Grade 11 pure Mathematics and Mathematical Literacy learners who were all between the ages of 16 and 18. The group of Grade 11 learners had a minimum of four years of being taught Mathematics in English as a first language. The study did not consider under-privileged schools or any other grades. This study was conducted over a short period of time, with a small number of participants and, thus, results could be not be generalised.
1.8 ETHICAL CONSIDERATIONS
Creswell (2009) refers to a number of areas in which ethics must be adhered to. In view of this, this research project adhered to all ethical principles of research.
There were no risks of any kind to any of the participants nor were there any expected benefits to be gained by the participants except a better understanding of functions for those who participated in the intervention. No harm could come to them and they were protected from embarrassment and offence. The privacy, anonymity and confidentiality of all participants were assured.
15
The process of research did not infringe on any ethical principles. All the participants were given consent forms to fill in, specifying the purpose of the research and what the research process entailed, and informing them that their names would be kept confidential. Ethical clearances were obtained from the school, education department, the parents and the learners and the Nelson Mandela Metropolitan University’s REC-H committee.
1.9 CONCLUSION
The results of the final Matric Mathematics examination are a concern as they show a decrease in the pass rate for Mathematics for the past three years. As a result of this, it is of grave importance that research is conducted as to how Mathematics results can be improved. The influence of the use of ICT in the classroom on the results and attitudes of the learners is well-documented. The aim of this research study was to see whether the use of Excel as a teaching and learning tool influenced learners’ attitude towards Mathematics and their ability to interpret functions.
For the purpose of studying the impact of using Excel as a teaching and learning tool on a group of learners, a number of Grade 11 learners in a former Model C school wrote a pre-test on functions and completed an attitude questionnaire as part of phase one of the study. A purposive, convenience sampling method was used for this.
A further ten learners volunteered to participate in phase two of the research study, which meant that these learners underwent three intervention sessions. At the intervention sessions, Excel was used as a teaching and learning tool. After the intervention, the participants completed a reflective questionnaire, a post-test and an attitude questionnaire and five of them underwent interviews. The results of the pre- and post-test form part of the quantitative aspect of the research study, and the results of the questionnaire and the interviews form part of the qualitative aspect of the study. Data were analysed to determine whether the use of Excel as a teaching and learning tool influenced the achievement levels and attitudes of the learners.
The next chapter contains an in-depth literature review regarding the challenges of Mathematics, various aspects of the use of technology in the classroom, the difference
16
between Mathematics and Mathematical Literacy, and Kilpatrick et al’s five strands of mathematical proficiency.
17 CHAPTER TWO
LITERATURE REVIEW
2.1 INTRODUCTION
A literature review involves the tracing, identifying and analysing of other documents that contain information relating to the study (Struwig & Stead, 2001). Mouton (2001) stresses the point that there is a need to find out what has been done in the field under study. This literature review was conducted in order to search for and understand what has already been done in this area of research.
This literature review covers a number of areas that are in-line with the aims of the research, linking and comparing what has already been studied and researched by other researchers in this area of using ICT in the Mathematics classroom. The main points covered are as follows:
The challenges in Mathematics facing the education department
The impact of ICT on teaching and learning by looking at the following:
o The benefits of visual tools
o The influence of ICT on learners’ attitudes and levels of achievement
o The impact of ICT on teaching style
The differences between Mathematics and Mathematical Literacy
Kilpatrick et al’s five strands of mathematical proficiency
2.2 THE CHALLENGES
The current level of Mathematics results in the country is a concerning issue (DBE, 2011a). Mathematical results have been a concern for the Department of education for a number of years, and nothing seems to be changing. At times, when things seem to be improving, they actually turn out for the worse. A possible reason for this is linked to Yushau (2006)’s belief; that Mathematics, as a subject, has remained mysteriously difficult and unpopular for most students. Mathematics has not become easier over the years; in fact, with the introduction of CAPS, high school Mathematics currently might be more challenging than it has been in the past few years. There are more
18
topics being covered and in greater depth than before. Before CAPS was introduced, when the NCS was at the forefront, Statistics was an important topic with Geometry and Probability being optional in schools. The introduction of CAPS meant that Geometry and Probability became part of the compulsory curriculum. However, with the added content to be covered, time to cover the content has not been increased. The time factor has been a challenge to many teachers who are currently teaching Grade 10 pure Mathematics.
As different as South African classrooms in different contexts can be, there are a number of challenges that are common to all classroom contexts. The following are just a few of the challenges faced by both teachers and learners in the classroom:
Learners are bored in class and lack understanding of the subject (Hurst & Sparrow, 2010). Boredom, at times, is a result of how the subject is taught which links to the teaching style, a factor in the effort to help learners form a better understanding of Mathematics.
Differing from Mathematical Literacy, pure Mathematics as a subject is not embedded in context (Hurst, 2008). Learners understand better if what they are studying can be connected to context.
Many teachers lack suitable qualifications and schools lack resources necessary to teaching and learning (Mgwebi, 2009).
There are so many other challenges that teachers and learners face that are not covered in this research. The aim of this research study was not to dwell on the challenges, but, rather, to improve on what is already happening in the classroom.
The reality is that pure Mathematics and Mathematical Literacy teachers have been faced with the daunting task of changing the current state of education by overcoming the challenges in their own classrooms. The state of education in our country is referred to by some as a national crisis (Daniels, 2007; Nicholson, 2009) and there are many stories in different publications about the dire state in which education finds itself. There are challenges that need to be addressed, especially when looking at the current state of the education system and the type of learners graduating from it. What do the results over the past few years say? Looking at the past few years’ results, is
19
there understanding of the impact of some of the challenges in the classroom that teachers and learners face?
Table 2.1 A summary of Mathematics results from 2008 to 2010 (Sasman, 2011)
Table 2.1 above shows the summarised results for pure Mathematic for the years 2008 to 2010. From 2008 to 2010, and even in 2011 (DBE, 2011a) the pass rates in the subject of Mathematics have been less than 48 per cent. Almost every year the Mathematics results are the lowest subject results in the Grade 12 final examinations in the country. A report by the Department of Basic Education (2011c) shows similar results as Sasman (2011).
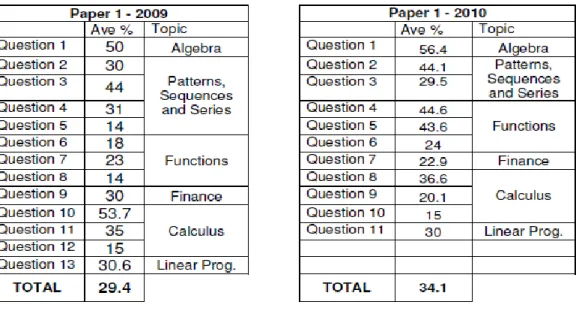
Table 2.2 below goes further than just looking at the results of the learners over the past few years, but actually gives a breakdown of the performances of the learners, question by question. Table 2.2 gives a breakdown of the learners’ performances in Paper 1 of 2009 and 2010 respectively.
Table 2.2: Breakdown of learner performance in the final Paper 1 in 2009 and 2010 (Sasman, 2011)
20
Looking at the average performance of 18,3% in Question 6, 7 and 8 in 2009 and 37,4% in Question 4, 5 and 6 in 2010 in the table highlights the poor performances of learners in this section of Mathematics.
This study focused on the section of functions and learners’ interpretation of functions. Although functions represent a small part of Mathematics, it is an important part nonetheless. Looking at the results above, it makes sense that if learners were to improve in only one of the sections, there would be an increase in their performance in the Mathematics examination as a whole.
2.3 PURE MATHEMATICS AND MATHEMATICS LITERACY
The subject of Mathematical Literacy provides learners with an awareness and understanding of the role of Mathematics in the modern world. It enables learners to become self-managing people, contributing workers and participating citizens in a developing democracy (DOE, 2003a). Hughes-Hallett (2003, p.92) defines Quantitative Literacy (the equivalent term for Mathematical Literacy in other countries like the United States of America, Australia and the United Kingdom) as the ability to identify, understand and use quantitative arguments in everyday contexts. An essential component is the ability to adapt a quantitative argument from a familiar context to an unfamiliar context.
Edge (2001) defines Mathematical Literacy as an individual’s capacity to function mathematically at some competent level in a particular society or culture. The Organization for Economic Cooperation and Development (1999) defines Mathematical Literacy as an individual’s capacity to identify and understand the role that Mathematics plays in the world, to make well-founded judgments, and to engage in Mathematics in ways that meet the needs of that individual’s current and future life.
Figure 2.1 shows the interrelationships that exist in Mathematical Literacy: how the content, competencies and real-life context make up what is called Mathematical Literacy. According to the NCS document, Mathematical Literacy involves the use of integrated content and/or skills in solving problems (DOE, 2003a).
21 FIGURE 2.1:INTERPLAY BETWEEN CONTENT, CONTEXT AND PROBLEM-SOLVING SKILLS IN
MATHEMATICAL LITERACY (BROMBACHER,2007)
Ewell, as cited in his interview with De Lange (2003), states that Quantitative Literacy is less formal and more intuitive, less abstract and more contextual, less symbolic and more concrete than Mathematics. This is a major difference between pure Mathematics and Mathematical Literacy or what some call Quantitative Literacy.
Mathematics on the other hand, enables creative and logical reasoning about problems in the physical and social world, as well as in the context of Mathematics itself. It is a distinctly human activity practised by all cultures. Mathematical problem-solving enables people to understand the world and make use of that understanding in their daily lives (DOE, 2003a).
Gerofsky (2004) defines school Mathematics (or pure Mathematics) as an interconnected set of content knowledge (including numbers and operations, Algebra, Geometry, measurement and data analysis) and cognitive process skills. Pure Mathematics equips learners with the creative and logical reasoning ability to solve real-life problems, while Mathematical Literacy demonstrates how Mathematics really fits in and how it can be used in everyday life. Steen (2003) goes further and defines
22
two types of Mathematics: workplace and school Mathematics. According to Steen (2003), workplace Mathematics is sophisticated use of elementary Mathematics rather than elementary use of sophisticated Mathematics.
A person who is mathematically literate needs to know some Mathematics, but literacy is not defined by the Mathematics known (Hughes-Hallett, 1999). Hughes-Hallett (1999) makes a distinction between ‘pure’ Mathematics and Mathematical Literacy, in that, just because a person studies Mathematics, it does not mean that he or she will be mathematically literate. A better comparison between pure Mathematics and Mathematical Literacy, then, should rather be the skills and competencies that exist in a mathematically literate person versus those that exist in a person who excels in pure Mathematics. However, most of the skills and competencies fall outside the scope of this research, which focused only on the skill of interpreting functions. Garii and Okumu (2008), citing Friedman (2005), Schiesel, (2005) and Skovsmose (2005), say that the application of Mathematics is less obvious and less understood by both teachers and their learners.
2.4 TECHNOLOGY IN THE CLASSROOM
Technology in the classroom offers more to teachers than the traditional chalk and board. Goldenberg (2000) says that, with technology, there is bigger pool of problems, because some problems cannot be solved by just a pencil and paper but can be solved with the aid of technology. One of the reasons is that society is evolving at a rapid pace and computers are becoming more and more an integral part of culture and the environment. Computers provide an added advantage when it comes to teaching sections in which learners achieve a better understanding of certain concepts when given a visual representation of the work (DOE, 2003a).
In South Africa, the curriculum is based on nine principles (DOE, 2003a & 2011a). One of the principles on which education has its foundation is that of integration, meaning the integration between subjects. For the purpose of this study, the focus is on integrating Excel, as an ICT tool, to help learners interpret mathematical problems. Integration is the implicit blending of technological components, parts or elements into a complex but harmonious whole, as well as how ICT is seamlessly embedded into
23
the classroom (Miller, Naidoo, Van Belle & Chigona, 2006; Tondeur, van Braak & Valcke, 2007).
It must be noted that the aim of the Department of Education is not merely to adopt using computers (Wilson-Strydom, Thomson & Hodgkinson-Williams, 2005), but to intrinsically integrate computers into the process of teaching and learning with as many subjects as it is possible.
The Department of Education encourages integration between ICT and the teaching and learning process of any learning area (DOE, 2003b), yet not every teacher or school is ready or even willing to integrate computers with the teaching and learning culture of the classroom or the school. There are various reasons that schools, and even teachers, would not be willing to integrate these two. Nawawi, Ayub, Ali, Yunus and Tarmizi (2005) and Stols and Kriek (2001) name some reasons that some teachers resist integrating computers and Mathematics, stating that some teachers are wary of technology and are relatively slow to adopt the innovative methods in the teaching-learning process. For these teachers, teaching Mathematics and computers separately is the best thing (Oldknow, 2008). This research does not intend to agree or disagree with such teachers, but, rather, to point out the positives and possibilities for those who choose to expand their way of teaching Mathematics by integrating these two.
The purpose of Mathematics is to equip learners and adults with the tools and skills to solve and to meet the mathematical demands that are placed on them (DBE, 2011b), more specifically, in terms of this research study, those relating to functions. The purpose of the integration of computers, in this study the use of Excel, and Mathematics, was to equip learners in interpreting functions, rather than merely being able to create graphs on Excel without much understanding, as is perhaps the case currently. Learners should be able to understand and interpret the graphs created by or given to them.
There is a wide spectrum of everyday mathematical demands, but the point is that learners should be prepared so that they are competent enough to meet these demands. The section of functions is only one aspect of the curriculum, but it is
24
important to learners, whether they take Mathematical Literacy or pure Mathematics (DOE, 2003a & c).
2.4.1 Why technology?
The findings of the British Educational Communications and Technology Agency (BECTA) (2010) study showed that institutions, teachers and learners all have differing perceptions of the impact of ICT on the level of personalised learning taking place. These findings were the starting point of this research study as well: as much as there is a big drive for it, not every teacher is willing to include computers in his or her form of presentation (Stols and Kriek, 2011). However, the integration of ICT into the school educational practice is seen as being crucial to prepare “young people to participate in and contribute to an information society that requires high levels of literacy, numeracy, technological competence and a spirit of creativity and enterprise” (Department of Education, Training & Youth Affairs [DETYA], 2000, p.17).
A number of researchers conclude that the effectiveness of technology depends upon how technology is used rather than just the presence of computers in the classroom (Goldenberg, 2000; Wenglinsky, 1998). If this is true, ways of integrating technology with Mathematics so that it has an impact on the teaching and learning process need to be investigated. While there is consensus that technology does have an effect on learning, the effect is largely dependent on how it is used (Goldenberg, 2000).
2.4.2 The effects of the use of computers on Mathematics
There are two major areas that one needs to look at when it comes to the effects of computers in the Mathematics classroom. The one is the impact of the use of computers on learners’ attitudes and the second is the impact of the use of computers on the learners’ performances. A number of studies have been done to show that these two aspects are in fact interrelated. (Ifamuyiwa & Akinsola, 2008).
A strong correlation between Mathematics achievement and attitude has been found in many studies; it has also been found that the two aspects interrelate and affect each other in a reciprocal manner (Aiken, 1970; Reyes 1984), thus the inclusion of attitude in this research study. Hemmings, Kay and Sturt (2010) state that there is strong and
25
consistent evidence that attitude towards Mathematics and mathematical achievement are inextricably linked. That is, the more positive an attitude a learner holds towards executing mathematical tasks, the better his or her achievement on those tasks and vice versa.
The aim of this research study was ultimately to strengthen learners’ conceptual understanding and adaptive reasoning strands (Kilpatrick et al., 2001), which would in turn result in better achievement levels for the learners in Mathematics. From the above research, it is evident that this cannot be done without, in some way, changing learners’ attitude towards Mathematics. As the Minister of Basic Education stated, and as the matric performances in the last examinations show, learner achievement needs to improve in this subject (DBE, 2011a).
2.4.3 The impact of the use of computers on learners’ attitudes
Teachers in general are not only concerned about learners’ understanding of Mathematics, but also about their attitudes towards the subject. Teachers’ perceptions of learners’ attitudes towards Mathematics are significant in determining whether they incorporate technology into their teaching of Mathematics (Mumtaz, 2000). Some factors that influence learners’ attitude towards Mathematics are confidence, beliefs in the importance of Mathematics and its utility in practice, and mathematical anxiety (Ashby, 2009).
Learners have a number of reactions towards Mathematics that affect their performance in the subject. Boredom, a lack of understanding and fear of the subject are but a few reactions that many learners have towards Mathematics (Chambers, 2006; Hurst & Sparrow, 2010). These reactions are negative in nature and have a negative effect on how learners see Mathematics and thus approach it, affecting how they perform in Mathematics.
Studies have shown that learners that have positive attitudes toward Mathematics tend to do well in the subject, and learners that have negative attitudes toward Mathematics tend to perform badly in the subject (Begle, 1979). A study conducted in America
26
showed that attitude towards Mathematics was one of a number of factors that was significantly related to success in Mathematics (Ai, 2002). Thus, changing the way learners think about Mathematics – their attitude towards the subject – can result in the learners being more motivated to learn and thus to perform better in the subject.
A great deal of study has been done on this topic. Research done by Aiken (1976) and Collins (1996) showed that technological aids such as calculators and computers have improved learners’ attitudes toward Mathematics.
Research shows that the use of computers in education has the potential of positively changing learners’ attitudes towards Mathematics and computers (Funkhouser, 1993; Ganguli, 1992; Kulik, 1984). Way and Webb (2006) state that ICT can be used as a motivational device to combat negative attitudes towards Mathematics and it is for this reason that using computers as teaching and learning tools in Mathematics classrooms should be considered.
Hyde, Fennema, Ryan, Frost and Hopp (1990) created an attitude questionnaire called the Fennema-Sherman Mathematics Attitude Scale. This questionnaire looks at four criteria:
Personal confidence about the subject matter (C)
Usefulness of the subject's content (U)
Subject is perceived as a male domain (M)
Perception of teacher's attitudes (T)
This scale has often been used by researchers that are looking at learner attitudes towards Mathematics (Ayotola & Adedeji, 2009). For the purpose of this study, a modified version of the scale was used.
2.4.4 The impact of the use of computers on learners’ understanding
Before looking into technology and learner performance, teachers need to be aware of the following statement by Ross, Morrison and Lowther (2010, p. 19): “educational technology is not a homogeneous intervention but a broad variety of modalities, tools,
27
and strategies for learning. Its effectiveness, therefore, depends on how well it helps teachers and students achieve the desired instructional goals.”
Research shows a positive relationship between the use of technology and learner performances in Mathematics (BECTA, 2003), but this positive relationship is largely influenced by the teacher’s appropriate use of the technology. The BECTA (2003) study’s findings concurred with Wenglinsky’s (1998) report that technology can indeed be effective in increasing Mathematics achievement and other educational outcomes, but that this effectiveness depends upon how technology is used.
For those teachers that do use technology, research shows that there is a clear and positive relationship between good ICT learning opportunities and higher learner achievement in secondary education (BECTA, 2003; Kent, 2006). Technology in the classroom provides teachers with another tool to teach.
2.4.5 Visualisation
There are many ways in which people learn (Iyer, 2011), but, in a normal classroom, not all those styles are used. Iyer (2011) names five ways in which people learn: verbal, kinaesthetic, tactile, visual and aural. The use of ICT, Excel in this case, largely satisfies the visual aspect of learning, as well as the verbal aspect of learning when accompanied by verbal instruction. Kent (2006), in using interactive whiteboards, notes that the use of such technology promoted higher order thinking, which shifted the learners’ focus from merely remembering the content to gaining a deep understanding of the concepts being taught. This is the true purpose of incorporating technology into the normal teaching and learning environment: to promote deep understanding in learners.
Makina and Wessels (2009) state that Mathematics, as a human and cultural creation dealing with objects and entities, is quite different from physical phenomena and therefore relies heavily on visualisation in its different forms and at different levels. Makina and Wessels (2009) go on to say that appreciating the importance of visualisation points to the need to use visualisation creatively as a tool for