İbrahim CİCİOĞLU1
Özlem ORHAN1
Çağrı ÇELENK1
1Gazi University, School of
Physical education and Sport
THE EFFECT OF THREE-YEAR ATHLETIC
TRAINING FOR INFRASTRUCTURE ON PHYSICAL
AND PHYSIOLOGICAL PARAMETERS OF FEMALE
STUDENTS
ABSTRACT
This study analyzed the effect of 3-year athletic training on some physical and physiological parameters of female students; to orientate skilled students to athletics, and to investigate the development of athletics in girl students.
The study included 106 female pupils from Turkish state schools. All participants were aged 9 years; 56 participants were allocated to the experimental group and 50 to the control group. Test and measurements (height, body weight, flexibility, grip strength, 1 min push-up, 1min sit-up, 6 min run, 30 m sprint, anaerobic strength, reaction) were performed on the experimental group three times per year in September-January and May-June periods for three years, 2005 to 2007. The control group was tested once per year, to differentiate the effects of natural growth from those of training. The T-test was used to evaluate the differences between the base line and final measurements of the subjects.
Statistically significant differences were observed between the experimental and control groups (p<0.05, p<0.01). It was found that the differences between the first and last measurements within experiment group and those of control group were high. These high values can be explained with the effect of exercise.
Key Words:Youth set up, Performance Test, Athletics
ALT YAPIYA YÖNELİK ÜÇ YILLIK ATLETİZM
ANTREMANLARININ KIZ ÖĞRENCİLERDE BAZI
FİZİKSEL VE FİZYOLOJİK PARAMETRELERE
ETKİSİ
ÖZET
Bu çalışmanın amacı; alt yapıya yönelik 3 yıllık atletizm antrenmanlarının kız öğrencilerde bazı fiziksel ve fizyolojik parametrelere etkisini inceleyerek, kız çocuklarını atletizm yapmaya teşvik etmek, yetenekli görülenleri yönlendirmek ve atletizmin kız çocuklardaki gelişime etkisini araştırmaktır.
Araştırmaya Milli Eğitim Bakanflığı’na bağlı devlet okullarından 56 kişi deney grubu (9 yaş), 50 kişi ( 9 yaş) kontrol grubu olmak üzere toplam 106 kişi gönüllü olarak katılmıştır. Test ve ölçümler (boy, vücut ağırlığı, esneklik, kavrama kuvveti, 1 dk şınav, 1 dk mekik, 6 dk koş yürü, 30m hız koşusu, anaerobik güç, reaksiyon) deney grubuna üç yıl boyunca 2005-2006-2007 Eylül- Ocak ve Mayıs- Haziran aylarında senede üç ölçüm şeklinde uygulanmıştır. Kontrol grubuna ise özellikle büyümenin ve antrenmanın etkisini ayırt edebilmek için yılda bir ölçüm uygulanmıştır. Ölçümlerin istatistiksel analizleri SPSS 11.0 programında yapılmıştır. Deneklerin ilk ve son ölçümleri arasındaki farklar t-test ile değerlendirilmiştir.
Çalışma sonucunda hem deney grubunda hem de kontrol grubunda yapılan ölçümlerde istatistiksel olarak (p<0,05, p<0,01) anlamlı farklılıklar gözlenmiş, ancak deney grubunda yapılan ilk ve son ölçümler arasındaki farkların kontrol grubuyla karşılaştırıldığında değerlerin yüksek olması egzersizin etkisi ile açıklanabilir.
INTRODUCTION
The constitution of the United Nations World Health Organization defines health as follows: “Health is a state of complete physical, mental and socio-economic well-being and not merely the absence of disease or infirmity”. This constitution also gives special attention to the development of children, stating: “healthy development of the child is of basic importance; it is essential for life”. Thus, attaching due importance to health, physical and social development of children can be considered a universal duty. One of the fundamental aims of society is to raise individuals that are physically, mentally and physiologically healthy. Continuous growth and development of children draw attention to this era7. In developed countries great importance is given to sport, and children are offered sports and physical training programs from a very early age8. The factor of a strong youth set up is also taken into account as the basis of success17. Athletics is considered as the main sports branch. Training methods used in athletics facilitate optimal physical development. These movements which are selected for this aim and which can be applied at all ages bring body functions to optimum level4.
This study aims to popularize athletics among children by applying youth setup training programs, to develop healthy individuals, and to encourage children to take up exercise and to orientate skilled students towards sports activities.
MATERIAL AND METHOD
A total of 106 participants from Turkish state schools voluntarily participated the study. Of the participants, 56 (age 9) were included in the experimental group and 50 (age 9) were included in the control group. Performance tests and physical measurements were performed on the experimental group three times per year in
September-January and May-June periods for three years (2005-2007). In the control group, one measurement was made each year to differentiate the effect of growth from that of training. The experimental group (n = 56) performed athletic training designed for a youth setup three days a week for three years, whereas the control group did not participate in any exercises apart from standard school physical education for three years. Physical tests examined flexibility, 1 min push-up, 1 min sit-up, 6 min run-walk, 30 m sprint, anaerobic strength, grip strength and reaction times.
Applied Tests:
Height measurement:Height was
measured using a Martin-type
anthropometer with a sensitivity of 1 cm.
Body weight:Body weight (kg) was
measured using a scale with a sensitivity of 100 gr.
Flexibility: A sit-and-reach test was
measured twice a using sit-and-reach box in the form of prolonged sitting without bending the knees. The better of the two values (cm) was recorded.
1min. push-up: The subjects were asked
to perform push-ups for 1 minute when their knees were on the floor.
1min.sit-up: The subjects were asked to
do as much sit-ups as possible during 1 minute, in supine position, with knees bent90 degrees, hands on the nape and soles in contact with the floor.
6 min. run-walk: The subjects were
motivated to cover as much distance as possible during 6 minutes.
30m sprint: A photocell (New Test 2000)
was used for the measurement. The measurement was made on a non-slip surface. The length of the running area was 30 m. When ready, the subject starts with all his/her strength and tries to reach the finish line fast as soon as possible. The best time was recorded from two trials.
Anaerobic power: Anaerobic power was
calculated according to the formula given below, by measuring the jump distance and using body weight.
Meter Unit Formula (kg-m/sec) P= (√4.9(Body Weight)√Dn) P= Power
Dn= Vertical jump distance(m)
Grip strength: A hand dynamometer
(Holtain) was adjusted to the hand size of the subject. The subject tried to grip the dynamometer as much as possible with his/her hand, without bending the elbow, keeping the arm on the side stretched at an angle of10 to 15 degrees from the shoulder. The best value was recorded after 4 trials with both hands.
Reaction time: Reaction times were
measured with a multi option reaction timer
(La Fayette). Each subject made 5 repetitions in response to audio and light stimuli. The time was recorded as 1/100 sec after each repetition. After performing 2 trials, the average of 5 repetitions was recorded as the reaction time. The subjects responded to light and sound using the index fingers of the right and left hands.
Statistical Analysis: SPSS (Version
11.0)was used for statistical analysis of the measurements. The T–test was used to evaluate the differences between the baseline and final measurements of the subjects.
FINDINGS
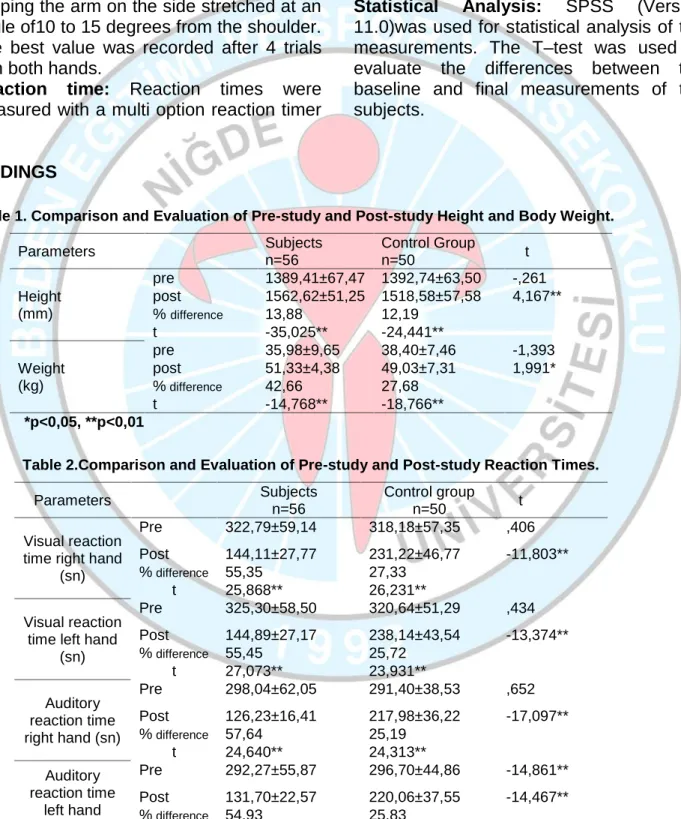
Table 1. Comparison and Evaluation of Pre-study and Post-study Height and Body Weight.
Parameters Subjects n=56 Control Group n=50 t Height (mm) pre 1389,41±67,47 1392,74±63,50 -,261 post 1562,62±51,25 1518,58±57,58 4,167** %difference 13,88 12,19 t -35,025** -24,441** Weight (kg) pre 35,98±9,65 38,40±7,46 -1,393 post 51,33±4,38 49,03±7,31 1,991* %difference 42,66 27,68 t -14,768** -18,766** *p<0,05, **p<0,01
Table 2.Comparison and Evaluation of Pre-study and Post-study Reaction Times.
Parameters Subjects
n=56
Control group
n=50 t
Visual reaction time right hand
(sn) Pre 322,79±59,14 318,18±57,35 ,406 Post 144,11±27,77 231,22±46,77 -11,803** %difference 55,35 27,33 t 25,868** 26,231** Visual reaction time left hand
(sn) Pre 325,30±58,50 320,64±51,29 ,434 Post 144,89±27,17 238,14±43,54 -13,374** %difference 55,45 25,72 t 27,073** 23,931** Auditory reaction time right hand (sn) Pre 298,04±62,05 291,40±38,53 ,652 Post 126,23±16,41 217,98±36,22 -17,097** %difference 57,64 25,19 t 24,640** 24,313** Auditory reaction time left hand (sn) Pre 292,27±55,87 296,70±44,86 -14,861** Post 131,70±22,57 220,06±37,55 -14,467** %difference 54,93 25,83 t 28,635** 24,134** *p<0,05, **p<0,01
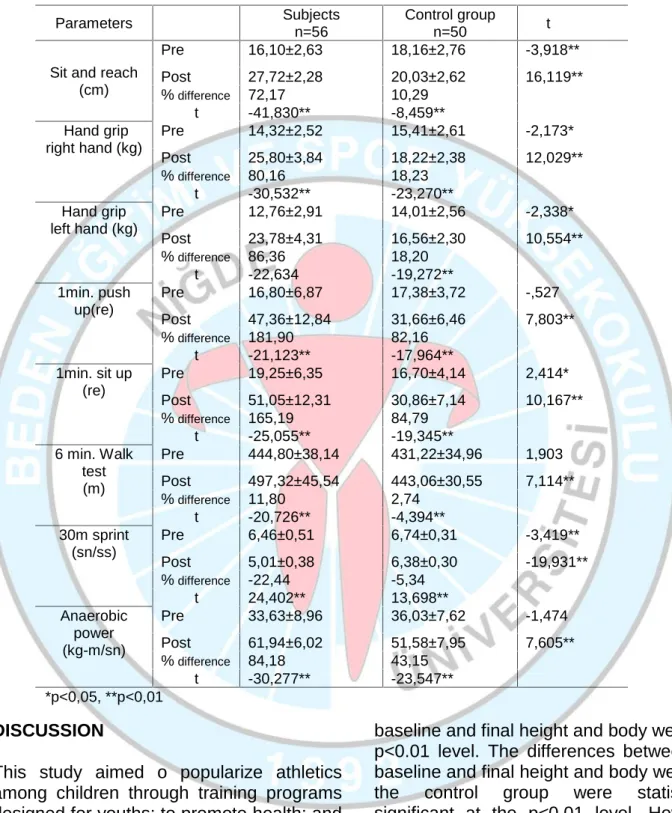
Table 3. Comparison and Evaluation of Pre-study and Post-study Flexibility, Grip Strength (right-left hand), 1 min Push-up, 1 min Sit-up, 6 min Run-Walk, 30 m Sprint, Anaerobic Power
Measurements of Experiment and Control Group.
Parameters Subjects
n=56
Control group
n=50 t
Sit and reach (cm) Pre 16,10±2,63 18,16±2,76 -3,918** Post 27,72±2,28 20,03±2,62 16,119** %difference 72,17 10,29 t -41,830** -8,459** Hand grip right hand (kg) Pre 14,32±2,52 15,41±2,61 -2,173* Post 25,80±3,84 18,22±2,38 12,029** %difference 80,16 18,23 t -30,532** -23,270** Hand grip left hand (kg) Pre 12,76±2,91 14,01±2,56 -2,338* Post 23,78±4,31 16,56±2,30 10,554** %difference 86,36 18,20 t -22,634 -19,272** 1min. push up(re) Pre 16,80±6,87 17,38±3,72 -,527 Post 47,36±12,84 31,66±6,46 7,803** %difference 181,90 82,16 t -21,123** -17,964** 1min. sit up (re) Pre 19,25±6,35 16,70±4,14 2,414* Post 51,05±12,31 30,86±7,14 10,167** %difference 165,19 84,79 t -25,055** -19,345** 6 min. Walk test (m) Pre 444,80±38,14 431,22±34,96 1,903 Post 497,32±45,54 443,06±30,55 7,114** %difference 11,80 2,74 t -20,726** -4,394** 30m sprint (sn/ss) Pre 6,46±0,51 6,74±0,31 -3,419** Post 5,01±0,38 6,38±0,30 -19,931** %difference -22,44 -5,34 t 24,402** 13,698** Anaerobic power (kg-m/sn) Pre 33,63±8,96 36,03±7,62 -1,474 Post 61,94±6,02 51,58±7,95 7,605** %difference 84,18 43,15 t -30,277** -23,547** *p<0,05, **p<0,01 DISCUSSION
This study aimed o popularize athletics among children through training programs designed for youths; to promote health; and to encourage the children to take up exercise and to orientate skilled students towards to sports activities.
After following a 3-year athletic training programs, experimental group showed statistically significant differences in
baseline and final height and body weight at p<0.01 level. The differences between the baseline and final height and body weight in the control group were statistically significant at the p<0.01 level. However, comparison of pre-study and post-study values of the experimental and control groups showed no statistically significant difference between the baseline measurements for height and body weight. The differences between the final height measurements were not significantly
different between the experimental and control groups (p<0.01). However, the final measurements showed a significant difference in body weight between the two groups at the p<0.05 level.
In a study that evaluated some anthropometric characteristics and physical aptitude parameters of children who were doing athletics, a total of 95 athletes (52 boys and 43 girls) between the ages of 10 and 13 were included in the study. These parameters were 141.3±3.7 cm, 29.3±3.3 kg for 10-year-old girls and 145.5±6.8 cm, 32.9±3.7 kg for 11 year-olds18. In another study, girls between the ages of 9 and 10 were found to have mean body weight of 31.34 kg and mean height of 135.13 cm; 11 year-old girls had mean body weight of 35.03 kg and mean height of 142.16 cm1. The greatest increase was observed in height in the 9–11 age, group and in body weight in the 11–12 age group. Despite slight differences in height and body weight in the same age groups, it can be suggested that our values are consistent with those reported in the literature. In a 4-year study by Gregor et al.6of children aged7–11 who participated or did not participate in sports activities, it was found that those who participated in sports activities ranged in height from 132.5 to165.2 cm, and body weight from24.0 to 58.5 kg; the children who did not participate in sports activities had a height range of 130 to 161 cm and body weight of 27.1- to 65.5 kg. The values obtained in that study are consistent with our study.
In a seven-year study which involved children from age 11 to 18, it was found that height and body weight were greater in children who participated in sports 10. Since athletics combines a wide range of physical movements, these promote favorable development of the circulatory and nervous systems; develop and improve strength, speed, endurance, mobility and motor skills. As a result, coordination is improved and, particularly due to perfection of motor skills,
movements in daily life are performed in a more economic and functional manner9. The differences between the first and last measurements of flexibility and grip strength (right hand) within the experiment group were statistically significant at the level of p<0.01. However, the differences between the first and last measurements of grip strength (left hand) were not statistically significant (p<0.01, p<0.05). The differences between the first and last measurements of flexibility, grip strength (right–left hand) variables within the control group were statistically significant at the level of p<0.01. Pre-study and post-study flexibility was significantly different in the experimental and control groups at the p<0.01 level. Similarly, the differences between the first measurements of grip strength (right–left hand) were statistically significant at the p<0.05 level.
In a study of 60 girls aged 9–10, average flexibility was 20.84±3.88 cm, while the flexibility value among sixty11-year-old girls was 22.00±5.1519.The values obtained in that study are consistent with those of the present study in terms of the increase of flexibility values with exercise. In a study by Anindita1, average grip strength among girls aged9 to 10 was 17.76 kg, while that of 11-year-old girls was 22.17 kg. It was observed that the values reported in that study were consistent with those obtained in the present study. Katie et al.10found a difference in grip strength between primary school students who generally received sedentary training and those who received both sports training and sedentary training in a balanced manner. Bockous3reported a significant difference in grip strength between early adolescents who exercised regularly and those who did not exercise. The differences between the first and last measurements of visual reaction time (right–left hand), audio reaction time (right– left hand) within the experimental group were statistically significant at p<0.01 level. The differences between the first and last
measurements of visual reaction time (right–left hand) and audio reaction time (right–left hand) within the control group were statistically significant at p<0.01 level. Comparison of pre-study and post-study results of the experimental and control groups showed a statistically significant difference between the first and last audio-reaction time (left hand)in the experimental and control groups at p<0.01; however there was no statistically significant difference between the first and last measurements of other reaction time variables (p<0.01, p<0.05). When pre-study and post-study values for the experiment and control groups were compared, there was a significant difference between the first and last measurements of visual reaction time (right–left hand) and also audio reaction time (right–left hand) at p<0.01 level.
In a previous study it was reported that there was an increase in timing precision in 7–10-year-old children who received tennis training 2. In a study of children aged 8–13, reaction times were shorter among those who participated in sports activities compared to non-participants14. Mouelhi et al.15reported that reaction to external environmental stimuli can be accelerated through exercise. Reaction time varies according to age. This time remains at a certain limit value according to audio physiology. Reaction time develops the most in the 8–11 age group16.
The differences between the first and last measurements of 1 min push-up, 1 min sit-up, 6 min run-walk, 30 m anaerobic power variables within the experiment group were significantly different at the p<0.01 level. There was a statistically significant difference between the first and last measurements of 1 min push-up, one min sit-up, 6 min run-walk, 30 m sprint, and anaerobic power results of the control group at p<0.01 level. Comparison of pre-study and post-pre-study test results of the
experimental and control groups showed that the difference between the first measurements for1 min push-up, 5 min run-walk, and anaerobic power variables were statistically significant (p<0.01, p<0.05). While the difference between the first measurement of the 30 m sprint variable was statistically significant at p<0.01 level, the difference in 1 min sit-up was statistically significant at p<0.05 level. The differences between the last measurements of these variables were statistically significant at p<0.01 level.
In a study of children who played rugby, Gabbet et al.5found that 1 min sit-up and 1 min push-up values improved following a 10-week training period. In a study of children aged 4–11, Lammers et al.12found that average values of 6 min walk test were 496±53 m for 9–year-old children; 506±45 m for 10-year-old children and 512±41 m for 11-year-old children. It was emphasized that distance increases parallel to age. The values reported in that study are consistent with the findings of the present study. Zahner20 applied a school-based physical activity program to improve health and form in 6–13-year-old children. After one year, the anaerobic capacity of the experimental group improved and their quality of life increased compared to the control group. Kienet al11reported that 10–12-year-old secondary school students who participated in recreational sports activities were stronger than their peers who did not participate in sports activities. The findings of the present study are consistent with those results. Loko et al.13reported that children between the ages of 10 and 17 who did regular exercise were faster than those of the same gender and age who did not exercise regularly. 11. Following an exercise program of three days per week applied, children aged 10 to 12 showed significant improvements in 20, 30 and 40-m sprint ti40-mes. The results of that study are consistent with the findings of the present stduy6.
CONCLUSIONS
Measurements performed over a period of three years showed that 1 min push-up, 1 min sit-up and anaerobic power values of the experimental group showed a significant percentage increase. Reaction time variables within the experimental group were lower than those of the control group at the end of three years. In addition, the differences between the pre-and post-study flexibility and grip strength of the experiment group and those of the control group were found to be high. This
difference can be explained by the effects of the athletics-training program.
In conclusion, trainers and specialists should know the physical properties of developing children to achieve success in sports. In developed countries, great importance is given to sports and children are offered sports and physical training programs from a very early age. It is believed that this study will be beneficial to observe physical and physiological effects of exercise on girls during the childhood developmental period.
REFERENCES
1. Anindita M., "Physical and Motor Fitness Level of Indian School Going Girls" International Journal of Applied Sports Sciences.;Vol:18, No:2, 50-64, 2006. 2. Bengugui N., Ripoil H., "Effects of Tenis Practice on
The Coincidence Timing Accuracy of Adults and Children" Res Q Exerc. Spor. 69(3); 217-23,1998. 3. Bockous D.D., Farrow J.A., Friedl K.E., "Assesment of
Maturity in Boys and Grip Strength" J Adolesc Healty Care. 11 (6): 497-500, 1990.
4. Demir M., Atletizm Koşular, Atlamalar, Atmalar,
Teknik, Metodik ve Antrenman Bilgisi. Ankara: Nobel Yayın Dağıtım; 2005.
5. Gabbet T.J., Johns J., Rieman M., "Performance Changes Following Training in Junior Rugby League Players" J Strength Cond Res. May; 22(3):910-7, 2008.
6. Gregor J., Marjeta K., Strel J., "Impact Of The Additional Physical Ducation Lessons Programme on The Physical and Motor Development Of 7 To 10 Year Children".Kinesiology. 38-2: 105-115, 2006.
7. Güler D., 8-10 Yaş Grubu Erkek Çocuklarda Aahperd Fiziksel Uygunluk Test Bataryasının Sosyo- Ekonomik Düzey ile İlişkilendirilmesi. Doktora Tezi. Ankara: G.Ü. Sağlık Bilimleri Enstitüsü Beden Eğitimi ve Spor Anabilim Dalı; 2003.
8. Gürses Ç., Olgun P., Sporda Başarıyı Etkileyen
Faktörler. Sportif Yetenek Araştırma Metodu, Türk Spor Vakfı Yayınları; 1991.
9. İşler M., (Koşular, Atlamalar, Atmalar) Teknik-Metod-Antrenman.Ankara: Tubitay Yayınları Ltd. Şti.;1997. 10. Katie M.M., Brad S.M., Joanne K., Linda D.V., Terence
J.W., "Contribution of Timetabled Physical Education to Total Physical Activity in Primary School Children: Cross Sectional Study". Bmj . Volume 327, 13 September, 2003.
11. Kien C.L, Chiodo A.R., "Physical Activity İn Middle School-Aged Children Participating in A School-Based
Recreation Program" Arch Pediatr Adolesc Med. 157(8): 811-5, 2003.
12. Lammers A.E., Hislop A.A., Flynn Y., Haworth S.G., "The Six-Minute Walk Test: Normal Values For Children Of 4-11 Years Of Age" Arch. Dis. Child. April, 2007.
13. Loko J., Aule R., Sikkut T., Ereline J., Viru A.," Motor Performance Status in 10 To 17-Year-Old Estonian Girls And Boys" Scand J Med Sci Sports. 10(2) : 109-13, 2000.
14. Montes- Mico R., Bueno I., Candel J., Pans A.M., "Eye Hand and Eye-Foot Visual Reaction Times of Young Soccer Players" Optometry. 71 (12); 775-80, 2000. 15. Mouelhi Guizani S., Bouzaouach I., Tenenbaum G.,
Ben Kheder A., Feki Y., Bouaziz M., "Simple and Choice Reaction Times Under Varying Levels of Physical Load in High Skilled Fencers" J. Sports Med Phys Fitness.46(2): 344-51, 2006.
16. Muratlı S. Çocuk ve Spor, Nobel Yayın Dağıtım; 2001. 17. Pekel A., Atletizmde Yetenek Aramasına Bağlı Olarak
10-12 Yaş Grubu Çocuklarda Bazı Değişkenler Üzerinde Normatif Çalışma. Doktora Tezi. Ankara: G.Ü. Sağlık Bilimleri Enstitüsü; 2007.
18. Pekel H.A., Balcı S.Ş, Pepe H, Arslan Ö., Bağcı E., Tamer K., Aydos L., Atletizm Yapan Çocukların Bazı Antropometrik Özellikleri ve Performansla İlgili Fiziksel
Uygunluk Parametrelerinin Değerlendirilmesi. 8.
Uluslararası Spor Bilimleri Kongresi Antalya, 2004. 19. Turgut A., Çetinkaya V., 6-11 Yaş Grubu Kız
Çocuklarda Bazı Motor Özelliklerin Belirlenmesi. 9. Uluslar Arası Spor Bilimleri Kongresi 3-5 Kasım, Muğla, 2006.
20. Zahner L., Puder J.J., Roth R., Schmid M., Guldimann R., Pühse U., Knöpfli M., Braun-Fahrländer C., Marti B., Kriemler S., "A School-Based Physical Activity Program to İmprove Health and Fitness in Children Aged 6-13 Years ("Kinder-Sportstudie Kıss"): Study Design of A Randomized Controlled Trial" Bmc Public Health. Jun 6;6:147, 2006.