Payroll Taxation in Canada:
An Overview
Livio Di Matteo
Michael Shannon*
Department of Economics Lakehead UniversityD
espite constituting the third most im-portant source of revenue for Canadian governments, payroll taxes receive relatively little attention. This is particularly surprising on two counts: first, there are important con-troversies regarding the employment effects of these taxes and, second, payroll taxes have grown substantially over the last 30 years and are likely to continue to increase in the future.Payroll taxes rose from 2.9 per cent of total government revenue in 1965 to 12.9 per cent in 1993. As a share of total labour income, they increased from 1.9 per cent in 1961 to 10.3 per cent in 1992. Payments for the three major programs funded through payroll taxes — Unemployment Insurance, the Canada and Quebec Pension Plans, and provincial work-ers’ compensation — rose from 3.6 per cent of GDP in 1985 to 5.1 per cent in 1992.
The goals of this article are to provide a com-prehensive overview of payroll taxation, to consider its future direction, and to discuss its potential impacts. We begin by outlining the current state of payroll taxation in Canada, chronicling its recent growth as a revenue source. We also consider the range of mar-ginal payroll tax rates across provinces and use earnings distribution data to determine the groups facing the highest payroll tax rates. We then discuss anticipated future trends. Following this, the impact of payroll taxation on wages and employment is considered. We conclude that these taxes do have a negative impact on employment; however, there are a wide range of estimates as to the size of this effect.
Payroll Taxes in
Canada
The federal and provincial governments im-pose payroll taxes with levies on both employ-ers and employees. The federal government taxes employers and employees to finance un-employment insurance and pensions. Prov-inces tax employers to fund workers’ com-pensation and, more recently, health care and education; Quebec levies both employers and employees for its own pension plan.
Over the last 30 years, the proportion of total government revenue accounted for by payroll taxes has quadrupled (Table 1). The average payroll tax rate (as a percentage of total labour income) rate jumped dramatically in 1966 with the onset of the Canada and Quebec Pen-sion Plans (C/QPP) and has risen steadily ever since (Figure 1).
Employer contribution rates for C/QPP and Unemployment Insurance (UI) have risen substantially in recent years (Table 2). The rate applied to contributable earnings for C/QPP was 1.8 per cent for both employees and employers from 1966 to 1986. Since then, they have risen 0.1 percentage points per year, reaching 2.6 per cent in 1994. These rates are levied on wage and salary earnings between maximum pensionable earnings ($34,400 in 1994) and the basic exemption ($3,400 in 1994).
UI premiums are charged on earnings below a weekly maximum ($815 in 1994) which is linked to changes in the average industrial wage over an eight-year period. The employer rate is 1.4 times that for employees.1 Under
than 15 hours per week who earn below 20 per cent of the weekly maximum are exempt. As Table 2 indicates, UI premiums have fol-lowed an upward trend since 1966. This re-flects rising unemployment, increases in self-financing requirements due to the generosity of benefits and, since 1990, the end of
contri-butions to the UI fund from general reve-nues.2 Current premium levels are more than
three times higher than they were in 1966. There have also been significant cyclical movements in UI premium rates around the upward trend. Premiums peaked following the recession of the early 1980s, declining once the debt accrued during the recession had been paid off. Rates rose once again with the recession of the early 1990s in order to meet the growing cumulative deficit in the fund.
Workers’ compensation is financed by pro-vincial levies on employer payrolls below a specified maximum earnings per employee. The tax or assessment rate applied to this base varies across industry rate groups.3 These
rates are generally set at levels sufficient to cover the projected costs of accidents incurred by the rate group in each year. Additional sur-charges may be added to cover costs of past unfunded accidents. Average rates have risen substantially in several provinces (Table 2). No province experienced a fall in its average assessment rate between 1966 and 1994.
Quebec, Manitoba, Newfoundland, and On-tario also levy additional payroll taxes to help finance health care and/or postsecondary
Figure 1 Payroll Taxes as a Percentage of
Labour Income
Source: Canadian Economic Observer, Kesselman (1994).
Notes: Payroll Taxes are defined as total contributions to Workers’ Compensation, CPP/QPP and UI and Provincial Payroll Taxes for Health & Education. Labour income is wages, salaries and supplementary labour income.
Table 1
Trends in Payroll Taxes as a Percentage of Total Government Revenue
1Year Unemployment Insurance Workers’ Compensation Canada/ Quebec Pension Provincial
Payroll Taxes2 All
1950 2.3 1.2 - - 3.5 1955 2.2 1.0 - - 3.2 1960 2.5 1.1 - - 3.6 1965 1.9 1.0 - - 2.9 1970 1.5 0.8 3.3 0.1 5.7 1975 3.0 1.2 3.0 0.3 7.5 1980 2.7 1.3 3.0 0.5 7.5 1985 4.6 1.4 3.0 0.9 9.9 1990 4.6 1.7 3.5 1.9 11.7 1992 5.9 1.6 3.8 1.8 13.1 1993 5.8 1.3 3.9 1.8 12.9
Sources: Canadian Tax Foundation (1993); Kesselman (1994); data from Statistics Canada. 1 Includes all three levels of government.
2 Refers to provincial payroll taxes brought in by Quebec, Manitoba, Ontario, and Newfoundland to finance health and education. Per cent 0 2 4 6 8 10 12 26 29 32 35 38 41 44 47 50 53 56 59 62 65 68 71 74 77 80 83 86 89 92
education4. In Ontario, the Employer Health
Levy was introduced in 1990. It is applied at a graduated rate to total annual gross wages, salaries, and other remuneration paid by the employer. In 1994, the rate was 0.98 per cent up to a $200,000 annual payroll, and rose to a maximum of 1.95 per cent for payrolls over $400,000.
Manitoba introduced a payroll tax in 1982. The initial tax rate was 0.75 per cent, which rose to 2 per cent in 1987; however, the payroll exemption was also increased from $50,000 to $100,000. A payroll tax credit introduced in 1991 can reduce the rate by up to 0.3 per cent for firms with qualifying training costs.
Quebec’s payroll tax was introduced with its Medicare plan in 1970 at an original rate of 0.8
per cent. Now Quebec also has a business sur-tax on the payroll sur-tax which stands at 15 per cent of the payroll tax. In 1994, the effective payroll tax rate was 3.75 per cent.
Newfoundland brought in its payroll tax in 1990 to fund health care and postsecondary education. It was imposed at a rate of 1.5 per cent on payrolls in excess of $300,000. In 1992, the commercial property tax for schools was replaced by broadening the base for the payroll tax. The exemption was lowered from $300,000 to $100,000 of the annual payroll and the rate was increased from 1.5 to 2 per cent. The fishery, agricultural, and forestry in-dustries which were originally exempted, now are taxed at 1 per cent.
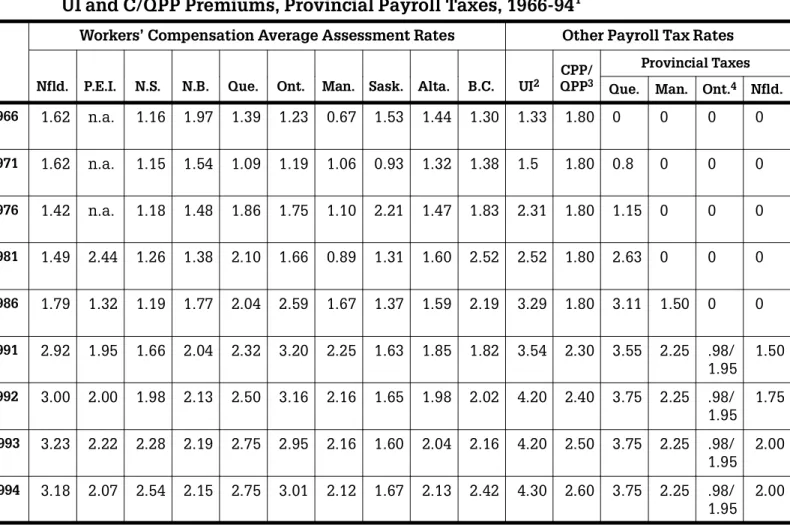
Table 2
Payroll Tax Rates, Workers’ Compensation Average Assessment Rates, Employer
UI and C/QPP Premiums, Provincial Payroll Taxes, 1966-94
1Workers’ Compensation Average Assessment Rates Other Payroll Tax Rates
Nfld. P.E.I. N.S. N.B. Que. Ont. Man. Sask. Alta. B.C. UI2
CPP/ QPP3
Provincial Taxes Que. Man. Ont.4 Nfld.
1966 1.62 n.a. 1.16 1.97 1.39 1.23 0.67 1.53 1.44 1.30 1.33 1.80 0 0 0 0 1971 1.62 n.a. 1.15 1.54 1.09 1.19 1.06 0.93 1.32 1.38 1.5 1.80 0.8 0 0 0 1976 1.42 n.a. 1.18 1.48 1.86 1.75 1.10 2.21 1.47 1.83 2.31 1.80 1.15 0 0 0 1981 1.49 2.44 1.26 1.38 2.10 1.66 0.89 1.31 1.60 2.52 2.52 1.80 2.63 0 0 0 1986 1.79 1.32 1.19 1.77 2.04 2.59 1.67 1.37 1.59 2.19 3.29 1.80 3.11 1.50 0 0 1991 2.92 1.95 1.66 2.04 2.32 3.20 2.25 1.63 1.85 1.82 3.54 2.30 3.55 2.25 .98/ 1.95 1.50 1992 3.00 2.00 1.98 2.13 2.50 3.16 2.16 1.65 1.98 2.02 4.20 2.40 3.75 2.25 .98/ 1.95 1.75 1993 3.23 2.22 2.28 2.19 2.75 2.95 2.16 1.60 2.04 2.16 4.20 2.50 3.75 2.25 .98/ 1.95 2.00 1994 3.18 2.07 2.54 2.15 2.75 3.01 2.12 1.67 2.13 2.42 4.30 2.60 3.75 2.25 .98/ 1.95 2.00
Sources: Association of Workers Compensation Boards of Canada; Kesselman (1994); Statistics Canada, Unemployment Insurance Statistics, Health and Welfare Canada (1986).
1. In years where rates changed an average is reported.
2. Since 1971 this is 1.4 times the rate paid by employees. Pre-1971, employers and employees paid matching contributions which varied with earnings.
3. Employees pay a matching rate. The 1994 Worker’s Compensation Assesment Rates are preliminary. 4. Rate varies by payroll size.
Table 3
Payroll Tax Rates by Province: Employer Contributions Only
Nfld. P.E.I. N. S. N.B. Que. Ont.1 Man. Sask. Alta. B.C.
1966 4.75 n.a 4.29 5.10 4.52 4.36 3.80 4.66 4.57 4.43 1971 4.92 n.a. 4.45 4.84 5.19 4.49 4.36 4.23 4.62 4.68 1976 5.53 n.a 5.29 5.59 7.12 5.86 5.21 6.32 5.58 5.94 1981 5.81 6.76 5.58 5.70 9.05 5.98 5.21 5.63 5.92 6.84 1986 6.88 6.41 6.28 6.86 10.24 7.68 8.26 6.46 6.68 7.28 1991 8.76 7.79 7.50 7.88 11.70 10.99 10.34 7.47 7.69 7.66 1992 9.60 8.60 8.58 8.73 12.85 11.71 11.01 8.25 8.58 8.62 1993 9.93 8.92 8.98 8.89 13.20 11.60 11.11 8.30 8.74 8.86 1994 10.08 8.97 9.44 9.05 13.40 11.86 11.27 8.57 9.03 9.32
1. Ontario uses 1.95 as the rate of the Provincial payroll tax for 1987-1993.
Table 4
Marginal Payroll Tax Rates, 1991
Nfld. P.E.I. N.S. N.B. Que. Ont. Man. Sask. Alta. B.C.
Employer Rates Only
Under CPP maximum* 10.26 7.79 7.50 7.88 11.70 10.99 10.33 7.47 7.69 7.66 Under UI maximum (over CPP) 8.16 5.69 5.40 5.78 9.60 8.89 8.24 5.37 5.59 5.56 Under WC maximum (over UI, CPP) 9.45 1.95 1.66 2.04 5.87 5.15 4.5 1.63 1.85 1.82 Above all ceilings 1.5 0 0 0 3.55 1.95 2.25 0 0 0
Combined Employer and Employee Rates Under CPP maximum1 15.08 12.61 12.32 12.7 16.53 15.81 15.16 12.29 12.51 12.48 Under UI maximum (over CPP) 12.98 10.51 10.22 10.6 14.43 13.71 13.06 10.19 10.41 10.38 Under WC maximum (over UI, CPP) 4.42 1.95 1.66 2.04 5.87 5.15 4.5 1.63 1.85 1.82 Above all ceilings 1.5 0 0 0 3.55 1.95 2.25 0 0 0
The combined employer payroll tax rates from 1966 to 1994 are reported for each prov-ince in Table 3. In most provprov-inces, these rates doubled or even tripled during the period. In 1994, Quebec had the highest combined em-ployer rate, at 13.4 per cent (compared to 3.13 per cent in 1966). The lowest rate was in Sas-katchewan (8.57 per cent in 1994 compared to 4.66 per cent in 1966).5
Impacts of Payroll
Taxes on Different
Employee Groups
Since economic models typically focus on decisions at the margin, marginal payroll tax rates are most relevant in evaluating the im-pacts of these taxes. Marginal payroll tax rates differ from the tax rates reported in Tables 3 (plus employee contributions) because UI, C/QPP, and workers’ compensation apply only to earnings below a specified maximum and because of our use of an average assess-ment rate for workers’ compensation.6
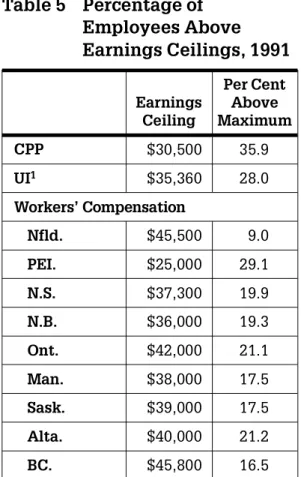
The ceilings for UI, C/QPP, and workers’ compens ation, above which no tax is charged, mean that the marginal (and aver-age) tax rates will eventually fall as a worker’s earnings rise. In 1991, for example, the maxi-mum marginal combined employer tax rate for an Ontario worker was 10.99 per cent for those paid less than $30,500 who were UI in-surable. This fell to 8.89 per cent for those earning between $30,500 and $35,360 (i.e., those whose additional wage income was tax-able under all payroll taxes except C/QPP), then to 5.15 per cent for those earning be-tween $35,360 and $42,000 (above the UI maximum insurable earnings), and finally to 1.95 per cent for those earning more than $42,000. Marginal rates by earnings level for each province in 1991 are reported in Table 4. Table 5 draws upon 1991 data on Canada Pension Plan contributors to show the distri-bution of the workforce (excluding Quebec) by marginal rate level. The annual payroll tax ceiling for C/QPP was $30,500; in 1991, 64 per cent of workers had earnings below this level and consequently faced the maximum possi-ble marginal payroll tax rate (assuming they were all UI insurable). Another 7.9 per cent had earnings between the C/QPP ceiling and
the (annual) UI ceiling of $35,360 and conse-quently had marginal rates equal to the sum of all tax rates excluding C/QPP. Workers’ compensation ceilings vary by province. In 1991, about 20 per cent of workers in most provinces were paid more than the workers’ compensation ceiling and consequently had the lowest possible marginal payroll tax rate. This minimum rate equaled the provincial payroll tax rate (or 0 per cent in provinces with no provincial payroll tax). In summary, about 20 per cent of workers faced the mini-mum marginal rate and 64 per cent faced the maximum.
Data from the 1989 Labour Market Activity Survey (LMAS) provide a similar picture. Be-tween 63 per cent and 66 per cent of workers had earnings below the 1989 C/QPP ceiling of $27,700.7 Estimates from the LMAS indicate
that 55-58 per cent faced the maximum mar-ginal rate. Another 4-6 per cent were between UI and C/QPP ceilings and 82-84 per cent were below the workers’ compensation cutoff.
Table 5
Percentage of
Employees Above
Earnings Ceilings, 1991
Earnings Ceiling Per Cent Above Maximum CPP $30,500 35.9 UI1 $35,360 28.0 Workers’ Compensation Nfld. $45,500 9.0 PEI. $25,000 29.1 N.S. $37,300 19.9 N.B. $36,000 19.3 Ont. $42,000 21.1 Man. $38,000 17.5 Sask. $39,000 17.5 Alta. $40,000 21.2 BC. $45,800 16.5Source: Based on data from Health and Welfare Canada (1991).
The LMAS dataset can be used to determine the composition of the groups facing different marginal tax levels and, consequently, it indi-cates where the impacts of the taxes are likely greatest. As Table 6 indicates, the proportion of those facing the top marginal rate is rela-tively high for women, young workers, the less educated, and those in the Atlantic Prov-inces. Those employed in non-union jobs, with small employers, in the retail trade and service industries (especially accommodation and food), and in clerical, sales, or service oc-cupations are all substantially more likely to be at the top rate than the average worker. In short, the low-wage sectors face the highest marginal tax rates because of tax ceilings. It is the workers in these sectors who bear the brunt of these taxes8
Future Payroll Tax
Trends
In this section, we consider whether the up-ward trend in payroll tax rates is likely to con-tinue. Each tax is examined in turn.
Canada Pension Plan
The increases in the C/QPP rates which have occurred since 1986 are part of a planned long-term rate increase required to maintain the viability of the plan. The rate schedule projected sees combined employer-employee rates rising gradually from 5.4 per cent in 1995 to 12.80 per cent in 2021 (Cana-dian Institute of Actuaries, 1993).
While this projection suggests substantial fu-ture rate increases, it is not certain that this rate schedule will actually be realized. At one level, the projection is based upon assump-tions regarding future growth in wages and salaries, life expectancy, and other variables, which are themselves uncertain. At a more fundamental level, the projection assumes that program benefit levels and eligibility will remain the same. Less drastic rate increases would be required if the program were to be judged too costly, with the result that substan-tial reductions in benefits and eligibility oc-curred.
Workers’ Compensation
The likely course of future workers’ compen-sation assessments varies substantially from
province to province, largely because of dif-ferences in financial circumstances. Data col-lected by the Financial Executives Institute of Canada (1995) for 1993 show that Saskatche-wan ran a surplus while its pension liabilities were actually overfunded (Table 7). Three other provinces had surpluses but had plans with unfunded liabilities. Six provinces had deficits in 1993; of these, Ontario, Quebec, and Nova Scotia also had substantial un-funded liabilities.
These financial positions suggest that as-sessment rates in Ontario, Quebec, and Nova Scotia may have to rise substantially in the fu-ture. In fact, since 1984, Ontario’s assessment rates have included a surcharge intended to amortize the unfunded liability by 2014. The Workers’ Compensation Board of Ontario (1992) suggested that its financial position would require the average assessment rate to rise to 3.98 per cent by 1996 and remain at that level for the rest of the amortization pe-riod. However, because of the slow economic recovery in Ontario since the 1990-91 reces-sion, the assessable payroll has not grown as fast as projected and the post-1995 rate is now likely to be higher than the 3.98 per cent tar-get.9. Assuming a sustained one per cent rise
in average assessment rates seems reasonable for Ontario. The problem is less severe in the other two provinces with large unfunded li-abilities and their required rate increases are likely to be smaller than those in Ontario.10
The other two provinces with deficits, British Columbia and Prince Edward Island, may also require rate increases but, given their relatively small unfunded liabilities, the re-quired increases could be quite small or sim-ply temporary. Some rate reductions may eventually be possible in those provinces run-ning surpluses; however, Alberta, New Brunswick, and Newfoundland do have sub-stantial unfunded liabilities and rates may not come down for some time. Only Saskatche-wan appears to be in a position to immedi-ately reduce rates.11
Unemployment Insurance
Unemployment insurance premiums are currently at a cyclical high and can be ex-pected to fall as the debt accrued during the last recession is paid off and a cumulative sur-plus accumulates. The combined
employer-Table 6
Percentage of Employees at the Maximum Payroll Tax Rate
by Selected Characteristic, 1989
All Employees 58.7 Men 47.4 Women 71.9 Age 16-24 72.2 25-34 61.3 35-44 48.7 45-54 52.6 55-64 54.2 Province Newfoundland 67.2Prince Edward Island 76.3
Nova Scotia 65.3 New Brunswick 67.2 Quebec 62.9 Ontario 55.6 Manitoba 63.9 Saskatchewan 62.6 Alberta 57.4 British Columbia 53.0 Education
Less than 8 years 69.0
Some secondary 63.5 High School 66.3 Some Post-secondary 63.9 Post-secondary Certificate 55.8 University Degree 38.0 Trades certificate 56.4 Employment Status Full-time 57.9 Part-time 62.4
Union Status Union 50.2 Non-union 63.3 Industry Primary 52.3 Manufacturing 53.8 Construction 57.3
Transportation, Communications and other Utilities 43.1 Trade 68.2 Finance 64.0 Services 63.3 Public administration 47.4 Occupation Managerial/ Professional 45.3 Clerical 75.9 Sales 64.3 Service 70.5 Primary 61.7 Processing 56.3 Metals, Machining 49.4 Product Fabrication 66.1 Mechanics/Repair 41.7 Construction 52.3 Transport 52.7
Material Handling/ Craft 57.9
Firm Size (Number of employees)
Less than 20 70.2
20-99 64.6
100-499 58.5
500 or more 48.1
employee rate is currently projected to fall from 7.2 per cent in 1995 to 6.72 per cent in 1996 and 5.28 per cent in 1997 (Freeman, 1995). This projected rate decline is slower than that which would have occurred if the 1995 federal budget had not required the fund to build a cumulative surplus of $5 billion prior to the next downturn rather than merely eliminate the cumulative debt.12 Rates are
also unlikely to return to pre-recession lows due to changes in financing made in 1990 which eliminated general revenue contribu-tions to the UI fund. Through the 1980s, the share of UI benefits funded out of general revenues was roughly 25 per cent (Employ-ment and Immigration Canada, various years).
Since all costs must now be covered by pre-miums, this change in financing will lead to a substantial, permanent upward shift in pre-miums. However, this upward pressure will be partly offset by cuts to benefits made in 1993 and 1994. The present combined rate of 7.37 per cent stands out markedly compared to the pre-recession low of 4.35 per cent. Add-ing 25 per cent to the latter figure (i.e., the for-mer general revenue contribution) suggests that rates could fall as low as 5.44 per cent, which is near the currently projected 1997 rate. This may prove to be the new rate floor.
Naturally, if more cuts are made to UI bene-fits, and these savings are used to reduce pre-miums, then payroll taxes will fall further. Hu-man Resources Development Canada (1994) has provided estimates of savings under a va-riety of reforms to UI. The elimination of Re-gional Extended Benefits would provide the single largest saving of the options costed ($4.5 billion). This would reduce combined employer-employee premiums by 1.63 per-centage points. This is likely an upper bound as it assumes the largest possible cuts and that the savings are realized to their full extent as premium reductions. It should be noted that there could be other competing uses for these savings, including new labour adjustment or income support programs.
Provincial Payroll Taxes
Substantial provincial debt (estimated at $155 billion in 1994) will likely create pres-sure for new payroll taxes or for further rises in existing ones. Adding to these pressures are the cuts to federal transfers brought about by the replacement of the Established Program Financing and the Canada Assistance Plan with the Canada Social and Health Transfer, as announced in the 1995 federal budget.
Payroll taxes may be an attractive source of additional revenue from a political
perspec-Table 7
Financial Positions of the Workers’ Compensation Boards,
1993
(millions of dollars)
Deficit/Surplus Unfunded Liability Assessable Payroll
Newfoundland 16 -119 2,921
Prince Edward Island
-1 -10 547
Nova Scotia -12 -461 4,640
New Brunswick 17 -66 N.A.
Quebec -65 -3,516 61,900 Ontario -504 -11,532 83,423 Manitoba 19 -72 5,856 Saskatchewan 4 62 6,860 Alberta 299 -277 23,010 British Columbia -94 -191 37,523
tive. Witness, for example, the relatively muted response to the introduction of the Em-ployer Health Tax in Ontario in 1990, com-pared to the introduction of the Goods and Services Tax a year later. The existing provin-cial taxes are nominally earmarked for par-ticular expenditures (health in Ontario and Quebec, and health and education in Mani-toba and Newfoundland). This makes it tempting to argue that pressure for rises in these taxes may be created by increases in health spending, as the population continues to age. However, it is probably more accurate to view these taxes as just another source of general revenue and, therefore, to think of fu-ture trends as being tied to the provinces’ overall fiscal situation.
Quebec will have a new one per cent payroll tax in 1996 to raise funds for training. Levy-grant schemes to fund training, which typi-cally use a payroll tax as the levy, have also been discussed as a possibility for Ontario in the recent past although this may end with the recent change in government.
Moreover, relative to most types of taxation, a major attraction of payroll taxes is their rela-tively low cost of administration and compli-ance. Once the tax is in place and the collec-tion mechanisms established, raising further revenues from rate increases is a relatively simple matter. Ontario, for example, reported that for the fiscal year 1992-93, the adminis-trative costs of its payroll taxes amounted to 0.38 percent of the associated tax revenues which are substantially lower than for most other taxes (Kesselman, 1994: 182).13
Another attraction of payroll taxation for pro-vincial governments is the ability to shift some of the tax burden onto the federal gov-ernment. This effect operates through two channels. First, federal employees and agen-cies pay provincial payroll taxes in an effort to be consistent with other employers even though, technically speaking, the Crown is immune from taxation. Second, for federal in-come tax purposes, incorporated and unin-corporated businesses are able to deduct pay-roll taxes paid when calculating their income for the purposes of remitting federal income tax.14
Summary
In conclusion, it seems likely that the long-term upward trend in payroll tax rates will continue. This will be driven by rising C/QPP contribution rates and reinforced by increases in other payroll taxes, particularly increases in workers’ compensation assessments in some provinces. A possible source of relief is unem-ployment insurance, with premiums decling as the expansion continues, as the debt in-curred during the last recession is paid off, and as UI benefits are cut and eligibility re-quirements tightened. The combined effects of falling unemployment and UI reform could more than offset rises in other payroll taxes in the near term. However, as the economy moves through the business cycle, UI premi-ums will stabilize and then rise, while C/QPP premiums will continue to climb, with the re-sult that the overall payroll tax rate will prob-ably increase.
The Impact of Payroll
Taxation
Economist and Business
Views
In simple economic models, a payroll tax levied on employers lowers labour demand, inducing a decline in wages which will par-tially or, if labour supply is perfectly inelastic, wholly offset the effects of the tax on employ-ment.15 Alternatively, a payroll tax levied on
employees will decrease labour supply, lead-ing to an increase in wages which will again counter the initial effects of the tax on em-ployment. In either case, the employer’s wage costs (tax inclusive) will rise while the net-of-tax wage received by workers will fall. Em-ployment will decline in either case (if neither curve is perfectly inelastic) but no unemploy-ment will be generated by the tax since work-ers will remain on their labour supply curve and choose to work less at the lower net-of-tax wage. Thus, we have the result, familiar to economists, that the effect of the tax is the same regardless of whether it is levied on the employer or the employee.
Economists have placed the greatest empha-sis on whether business or labour bears the burden of the tax. The answer depends upon
how responsive the market wage rate is to the introduction of the tax. If an employer payroll tax eventually leads to a large offsetting fall in wages, then workers will bear much of the burden of the tax. The same result is obtained if an employee payroll tax induces only a small increase in the wage. In either case, the labour supply and labour demand elasticities are the critical parameters in determining the extent to which wages change and the degree to which employment will change in response to the wage change.
In Canada, especially for the approximately 35 per cent of the workforce covered by col-lective agreements, the simple model of sup-ply and demand may not accurately reflect how wages are determined. Non-cooperative bargaining theory suggests that the effects of payroll taxes in a collective bargaining context will be in the same direction as in the simple model (Wilton and Prescott, 1993). Employ-ers will attempt to share the cost of an em-ployer payroll tax with their unionized work-ers by trying to negotiate smaller wage increases. Unions will try to shift the em-ployee portion of a payroll tax to employers by negotiating higher wage increases.
There is a contrast between what might be called the “business view” or “public view” of the effects of payroll taxes and the econo-mist’s view. Business groups view payroll taxes as a “tax on jobs” and emphasize their employment effects. Quoting the Canadian Chamber of Commerce: “Rising payroll taxes leave companies with little choice other than to cut jobs or hire fewer people.” (Globe and Mail, February 10, 1994). This view also has a following in government circles. Paul Martin has referred to payroll taxes as “a cancer on jobs” (Freeman, 1995). Statements concern-ing the 1994 roll-back of UI premiums (Fi-nance Canada, 1994) and arguments made for UI reform by Human Resources Develop-ment Canada (1994: 42-43) also emphasize employment effects.
Can these two views be reconciled? Stressing employment impacts makes most sense to economists if labour demand and supply curves are elastic or if wage rates are rigid and the tax is levied on employers. In the former case, any wage change induced by the tax will result in relatively large changes in employ-ment. In the latter case, labour demand falls
with an increase in the tax but, as there is no offsetting decline in wages, employment falls in the rigid-wage sector.
Furthermore, the fall in employment in the rigid-wage case has the potential to increase unemployment since those losing their jobs will still want to work at the constant wage. The “potential” proviso is necessary since the disemployment effect may be specific to the rigid-wage sector. The existence of sectors with flexible wages in which those losing jobs in rigid-wage sectors can work will mean that some of these unemployed workers will enter the flexible-wage sector, driving its wages lower than the payroll tax would alone, until the unemployed are absorbed. Unemploy-ment may still occur, but it will be of the “wait” variety, as workers queue for jobs in the rigid-wage sector.16
If there is no other flexible-wage market to which workers losing their jobs in the rigid-wage market can move, as is the case in mini-mum-wage labour markets, the effects of pay-roll taxes will be solely on employment and will definitely create unemployment.17 The
rigid-wage case has received little attention from economists when examining payroll taxes despite the common use of this assump-tion in the macroeconomics literature.18
It could also be argued that the business view reflects a focus on the short-run effects of payroll taxes. This can be a legitimate view if the wage adjustments stressed by econo-mists are slow, or if those employers that now bear the costs of the tax may not be around to benefit from any longer-term wage decline which the tax may bring. Dahlby (1993) notes that there is support in the empirical literature for slow dynamic adjustment; some evidence on this point is presented in the next section. It is also possible that business is not con-cerned with employment effects per se, but that emphasizing them is the best way to gar-ner support against a policy which creates a welfare loss for employers via reduced pro-ducer’s surplus and added costs of adminis-tering the tax.
Another surprising result from the business point of view is the economist’s prediction that it is irrelevant to the tax’s eventual impact whether it is levied on employers or employ-ees. It is hard to imagine, for example, that
employer groups would be indifferent to a payroll tax levied on their wage costs or to a surtax on wage income levied through the in-come tax system. Yet the simple model sug-gests that the effects would be much the same. Again, wage inflexibility may help to reconcile the two positions. In the presence of rigid wages above market-clearing levels, a tax on labour income will have no effect on employer wage costs or on employment; i.e. there will be no costs to employers.
Offsetting Benefits
Some payroll taxes provide a benefit to the employer which may, to some degree, offset the cost of the tax itself. Workers’ compensa-tion premiums are paid by employers to fi-nance payments to injured workers. This sys-tem provides two possible benefits to employers: first, workers give up the right to sue their employers in the event of a work-place injury and, second, since workers know they will be compensated in the event of an injury, this reduces any compensating wage differential needed in more dangerous jobs.19
It is clearly inappropriate, then, to treat the en-tire workers’ compensation premium as a cost to employers. Indeed, Vaillancourt and Mar-ceau (1990) find that the effects of workers’ compensation assessments are in the oppo-site direction to the effects of other payroll taxes. They suggest that offsetting benefits may help explain this.
The offsetting benefit argument can also be applied to unemployment insurance and C/QPP premiums. The greater security pro-vided by UI and the post-retirement pension benefits through C/QPP may make workers willing to accept lower wages, thus offsetting the employer portion of the tax. Only the pro-vincial payroll taxes have no apparent offset-ting benefit.
The lack of UI experience rating and the im-perfect experience rating systems in workers’ compensation programs weaken the benefit-tax link for individual employers. The pay-as-you-go nature of C/QPP has the same effect. Unemployment insurance may allow employ-ers with unstable labour demand patterns to pay a lower wage than would be necessary without UI. Consequently, the net effect of UI on employment could actually be positive among such employers. Of course, firms with
stable work patterns receive no such offset-ting benefit and, given the lack of experience rating, end up subsidizing other employers.
These arguments suggest that payroll taxes with offsetting benefits should be analysed differently from other payroll taxes. However, the differences between the two types of taxes may not be as stark as it first seems. In prac-tice, the effect of a change in tax rates may be similar between the two types of taxes even though the consequences of introducing the two different types of tax from scratch may be very different. This is because the link be-tween a change in the tax rate and changes in offsetting benefits of the program funded may be weak. For example, current increases in the workers’ compensation assessments to pay for unfunded benefits awarded in the past provide no offsetting benefit to current em-ployees. Similarly, increases in C/QPP premi-ums for today’s young workers to pay pension liabilities of tomorrow’s retiring baby boom-ers provides little offsetting benefit for the for-mer. Reforms which strengthen links between tax rate changes and benefit changes will re-duce the distortionary effects of these taxes.
The introduction of a payroll tax may pro-vide another type of offsetting benefit to em-ployers if it, or the program financed by the tax, replaces an existing employer tax or dis-places a fringe benefit commonly provided by employers. The Ontario Employer Health Tax, for example, replaced Ontario Health Insur-ance Plan premiums which were commonly paid by employers (as a fringe benefit).20
Ceilings and Floors
An important feature of UI, C/QPP, and workers’ compensation taxes is the existence of a ceiling above which earnings are not taxed. Such ceilings lead to the differences in marginal tax rates recorded in Table 4. At the extreme, the marginal employer tax rate on an extra hour worked by a worker with earnings above the ceilings of all payroll taxes is zero compared to at least 8.57 per cent and as high as 13.4 per cent for a low-wage worker in 1994. These ceilings will make higher-wage labour relatively cheaper at the margin, with the consequence that wage and employment effects will be more severe for lower-wage workers. This can create a bias in favour of hiring highly-paid workers. It also provides an
incentive to have current workers work more hours rather than hire additional workers and so favors full-time over part-time employ-ment. The effects of ceilings also make these taxes more regressive.
These impacts will be less important for a tax with offsetting benefits. With UI, for example, earnings above the insurable ceiling are not taxed but, also, are uninsured. Consequently, wages for higher-paid workers may be greater than if insurance applied to all earnings.
The existence of minimum pensionable and insurable earnings under C/QPP and UI, and the 15 hour per week requirement for UI, cre-ate biases in the opposite direction to ceilings. However, figures reported in an earlier section suggest that ceilings are empirically more im-portant than floors.
Exempt or Low-Tax Groups
If certain groups are exempt from the payroll tax — for example, the self-employed or some small businesses under provincial payroll taxes — then such taxes will tend to depress wages (incomes) in the exempt group as well as the covered groups. In effect, the fall in la-bour demand in the covered group represents a fall in labour demand for all workers of that particular skill level regardless of group and will therefore lower wages across groups.
Empirical Work on
the Effects of Payroll
Taxation
Dahlby (1993: 133), in reviewing the litera-ture on the incidence of payroll taxes, notes that “empirical studies....suggest that labour bears over 80 per cent of the employer payroll tax burden in the long run”.21 The usual
find-ing is that, consistent with the simple model, wage rates adjust to offset payroll taxes result-ing in a significant shiftresult-ing of the tax to la-bour.22 This result suggests that it is incorrect
to ignore the wage effects of payroll taxes, as the business view tends to do.
A number of Canadian studies have exam-ined the “shifting” issue. Using collective agreements data in Quebec, Vaillancourt and Marceau (1990) found the standard result that increases in general payroll taxes reduced wage growth with some of the tax, shifted to
workers. Increases in workers’ compensation assessments, however, actually appeared to increase wage growth. The authors use an off-setting-benefit argument to explain this latter result, noting the close tie between tax rates and injury costs for workers’ compensation. Beach, Lin, and Picot (1995) estimate a labour demand equation derived from a CES produc-tion funcproduc-tion on pooled provincial employ-ment and wage data for 1966-1993. Their re-sults are consistent with full shifting of the employer payroll tax to workers through wage reductions. Wilton and Prescott (1993) exam-ine the impact of income, sales, and payroll taxes on wage costs using data on private-sec-tor collective agreements from 1979-1992. Us-ing several alternative specifications, they find that higher employer payroll taxes actu-ally increase real wages. This is contrary to the standard result from the simple supply-demand model or the bargaining framework, which lies behind Wilton and Prescott’s specification.
The macroeconomic-labour literature, which aims to explain unemployment pat-terns by estimating aggregate labour market models, can also be used to assess the effects of payroll taxes.23 In these models,
employ-ment is negatively related to real wage costs and real wages depend negatively on the un-employment rate and positively on the “wedge”, which is the difference between the wage cost to the employer (including tax) and the net wage of the worker. The payroll tax en-ters the model as part of the wedge. As in the simple model, a rise in payroll taxes increases the wedge, and therefore tax-inclusive wage costs, and this lowers employment. However, unlike the simple model, there is no assump-tion that employment is determined along the labour supply curve. Consequently, rising payroll taxes raise wage costs and lower em-ployment, but can also lead to unemploy-ment. These unemployment effects of payroll taxes create downward pressure on wage rates which partially offsets the original effect of payroll taxes on wage costs.
Our calculations based on Bean, Layard, and Nickell (1986) indicate that a one per cent rise in payroll tax rates results in long-run in-creases of 0.5 per cent in real wage costs and a -0.2 per cent decrease in employment. Bean, Layard and Nickell’s own simulations suggest
that increases in the wedge raised the unem-ployment rate by 1.34 points between the early-1960s and the early 1980s — a period in which the unemployment rate rose by about 4.5 percentage points. Of the 1.34 point rise attributed to the wedge, our calculations sug-gest that about 25 per cent can be attributed to the rise in payroll taxes alone. Simulations by Keil and Symons (1990) indicate that 0.5 points of the 3 percentage point rise in unem-ployment between 1981 and 1985 was due to increases in the wedge. Again, based on our calculations, about 22 per cent of this 0.5 point increase can be attributed to the rise in payroll taxes.
Both Bean, Layard, and Nickell and Keil and Symons adopt dynamic specifications. Re-sults from the former show a mean lag for em-ployment adjustment of 1.5 years. In the Keil and Symons model where dynamics are slower, while a change in the payroll tax does not affect long-run employment, it can have lingering negative effects as the economy moves toward equilibrium. This pace of la-bour market adjustment lends some credence to the business view of the payroll-tax effect. Both models, though, are consistent with the economist’s story in the long run.
In general, then, studies support the stand-ard model suggesting that the effects of pay-roll taxes on employer wage costs are moder-ated by changes in wage rates. Only the study by Wilton and Prescott is at odds with this conclusion. This suggests that an important effect of the rise in payroll taxes, then, has likely been slower wage growth. In addition, the macroeconomic-labour studies suggest that payroll taxes will reduce employment and raise unemployment though these effects may be transitional. Another interesting point arising from this literature and the study by Wilton and Prescott is that the impact of a payroll tax on labour markets can be expected to be much the same as other taxes (i.e. sales and income taxes) which drive a wedge be-tween the supply and demand prices for labour. Finally, the literature has also considered the distributional impact of Canadian payroll taxes. Recent work by Gillespie, Vermaeten, and Vermaeten (1995) has found that payroll taxes were generally regressive with respect to family income from 1951-1969 but by 1988, they had acquired an inverted U-shape.
Pay-roll taxes were progressive until about the 5th decile, remained proportional for the next two, and then began to decline. Most likely, the increased progressivity of the taxes at the low to middle income ranges does not reflect changes in tax design but rather the growth in the importance of transfers as an income source in the lowest deciles.
New Estimates of the
Impact of Payroll
Taxation
Measuring the impact of payroll taxes on em-ployment and wages requires estimates of la-bour demand and supply elasticities. How-ever, t here are no generally accept ed estimates of these elasticities for the Canadian economy. Past studies report large differ-ences.24
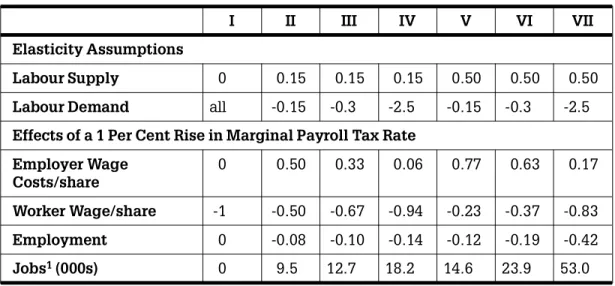
Table 8 presents estimates of the wage and employment effects of a one per cent rise in marginal payroll tax rates based upon various combinations of labour supply and labour de-mand elasticities. The elasticities used are reasonable by standards of the literature, with the exception of the -2.5 labour demand elas-ticity (cases IV and VII) used by Keil and Sy-mons (1990), which is provided for contrast. As the labour demand and supply elasticities increase, the effects of payroll taxes on em-ployment increase; however, the results show that for reasonable labour demand elastici-ties, these effects are not substantial.
The table also illustrates the sensitivity of the wage-shifting results to even the small range of elasticities considered. A labour demand elasticity of -0.3 and labour supply elasticity of 0.15 implies that 33 per cent of the tax rise is realized as a rise in labour costs and the rest as a fall in employee pay. Elasticities of -0.15 and 0.5 more than reverse this result with the employer cost share at 77 per cent and the em-ployee burden at 23 per cent. Therefore, the wage effects of the taxes may be particularly hard to predict.25
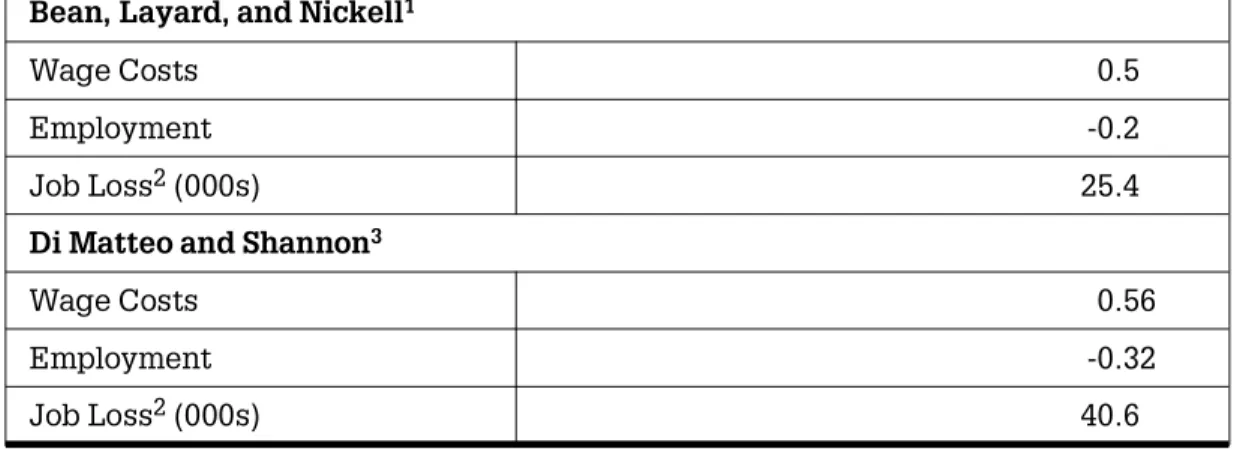
The top panel of Table 9 presents the long-run effects of a one per cent rise in average (rather then marginal) payroll taxes, as de-rived from the Bean, Layard, and Nickell model. These are closest to those obtained for
case VI in the previous table (for a labour de-mand elasticity of -0.3 and a labour supply elasticity of 0.5). The actual long-run labour demand elasticity in Bean, Layard, and Nickell is -0.42.
The bottom panel of Table 9 reports long-run impacts based upon our own estimates using annual data for the period 1958-1992. We base our model on Bean, Laya rd, and Nickell’s aggregate labour market model so as to facilitate comparison as well as make use of a standard and accepted modelling approach. This involves specification of a real wage equation and an employment equation (both in log-linear form). In the model, the real wage is explained by the wedge (including payroll taxes), an indicator of labour market tightness (the employment rate), the capital-labour ratio, and the unemployment insur-ance coverage rate. Employment depends upon the real wage, GDP, and the capital-la-bour ratio. Both equations include quadratic trend terms and allow for dynamic adjust-ment by including a one-period lag of the de-pendent variable as a regressor. Modifications were made to reflect the current article’s inter-est in payroll taxes.26 Both level and
first-dif-ference versions of the model were estimated using two-stage least squares.27
The results broadly parallel those of Bean, Layard, and Nickell. The coefficient on the wedge was positive and reveals that there is a
positive relationship between the average payroll tax rate and real wages; however, this coefficient is only marginally significant in the levels version and insignificant in the first dif-ferences version. Moreover, there is a negative and significant relationship between the real wage variable and changes in employment suggesting that increases in the average pay-roll tax rate can lead to a reduction in employ-ment via changes in the real wage. The long-run labour demand elasticity was -0.56.28
These results suggest that the employment effects of payroll taxes are non-trivial. Solving the estimated equations for the long-run ef-fect of a one per cent rise in the average pay-roll tax rate on employment indicates a rise in real wage costs of 0.56 per cent and a decrease in employment of 0.32 per cent in the long run (Table 9). The wage received by workers would fall by 0.44 per cent. Using 1994 as the base year, in the long run about 40,600 jobs would have been lost by such a policy action. We emphasize that there are a wide range of estimates of the actual magnitude of the job losses from payroll taxation because, ulti-mately, the size of the losses depends on esti-mates of labour demand and supply. At the same time, the overall evidence is consistent with the view that payroll taxes reduce em-ployment. The fact that since the 1960s the persistent upward trend in unemployment has been accompanied by rising payroll tax
Table 8
Estimated Effects of a 1 Per Cent Rise in Marginal Payroll
Tax Rate
Various Labour Supply and Demand Scenarios
I II III IV V VI VII
Elasticity Assumptions
Labour Supply 0 0.15 0.15 0.15 0.50 0.50 0.50
Labour Demand all -0.15 -0.3 -2.5 -0.15 -0.3 -2.5
Effects of a 1 Per Cent Rise in Marginal Payroll Tax Rate
Employer Wage Costs/share 0 0.50 0.33 0.06 0.77 0.63 0.17 Worker Wage/share -1 -0.50 -0.67 -0.94 -0.23 -0.37 -0.83 Employment 0 -0.08 -0.10 -0.14 -0.12 -0.19 -0.42 Jobs1 (000s) 0 9.5 12.7 18.2 14.6 23.9 53.0
rates is probably not an entirely coincidental relationship.
Conclusion
Payroll taxes have grown to become the third most important source of government reve-nue after personal income taxes and con-sumption taxes. Given the unfunded liability problems in C/QPP and the workers’ com-pensation schemes in some provinces as well as fiscal problems at both the provincial and federal level, governments may attempt to further exploit this tax base. In addition, the relatively hidden nature of employer payroll taxes provides a further incentive for their use given the current climate of resistance to vis-ible tax increases.
Payroll tax rates vary across provinces and industry groups because of the number of dif-ferent taxes as well as differences in rates. We found that when the composition of the groups facing tax levels is examined, low-in-come groups faced higher marginal rates. Women, young workers, those with less edu-cation, employees in retail, clerical, and serv-ices, and in small business generally, are likely to be at high marginal rates and conse-quently bear many of the employment and wage costs these taxes may produce.
The empirical literature suggests that payroll taxes raise employer wage costs and have im-portant negative consequences for take-home wages. There is also some evidence of
nega-tive employment effects. In estimating the ef-fects of payroll taxes, we emphasize that the size of these impacts depends on the labour demand and supply elasticities utilized. How-ever, there is no consensus estimate of these elasticities. Our own estimates imply that a one per cent rise in the average tax rate will lead to a 0.56 per cent rise in wage costs and a -0.32 per cent fall in employment.
Notes
* The authors wish to acknowledge the helpful com-ments of Jon Kesselman and two anonymous referees. 1. Prior to 1971, premiums differed by earnings class. The 1966 figure reported in Table 2 is an average. 2. The 1994 system is more generous than the 1966
system in terms of level and duration of benefits. Generosity, however, peaked in the 1970s. 3. In some provinces, partial experience rating allows
rates to vary among firms within an industry rate group as well.
4. These taxes are examined in detail in Kesselman (1994).
5. The summed rates in Table 3 apply to wage and salary earnings below the maximums specified for workers’ compensation, C/QPP, and UI. Rates ap-plicable to other types of labour income, such as fringe benefits, differ as UI and C/QPP exclude these while the provincial taxes do not. In each province, employee contributions represented 5.67 per cent of total labour income in 1994.
6. The use of average workers’ compensation assess-ments is unavoidable if figures are to be reported in summary form. Quebec, for example, had 341 indus-try rate groups in 1993. Note, however, that the use of an average rate masks substantial variation in
Table 9
Estimated Effects of a One Per Cent Increase in Average
Payroll Tax Rate
Bean, Layard, and Nickell1
Wage Costs 0.5
Employment -0.2
Job Loss2 (000s) 25.4
Di Matteo and Shannon3
Wage Costs 0.56
Employment -0.32
Job Loss2 (000s) 40.6
1. Based upon estimates reported in Bean, Layard and Nickell (1986) 2. Assumes employment before tax increase of 12,700,000.
rates between industry groups. For example, work-ers’ compensation assessment rates ranged from 0.15 per cent to 23.6 per cent across Ontario rate groups in 1992.
7. The range arises from the use of alternative meas-ures of earnings.
8. Again, the picture, especially by industry, is impre-cise because of the use of average assessment rates for workers’ compensation.
9. The possibility of extending the amortization period to 2024 or abandoning full funding for 70 per cent funding were also examined. These options would still require rate increases, but on a smaller scale than those necessary under the current plan. 10. The unfunded liability was 9.8 per cent of assessable
payrolls in Nova Scotia, 5.7 per cent in Quebec, and 13.3 per cent in Ontario in 1993.
11. This discussion refers to rate adjustments required to clear past liabilities. Considerable uncertainty with respect to these future rate projections is intro-duced by changes in future accident rates and bene-fits. The recent introduction of a wage-loss system in Ontario, for example, makes future benefits for permanent disability pensions less predictable. 12. The changes in the budget will tend to dampen
cy-clical rate swings requiring rates to be higher during upswings and lower during recessions than was the case in the past.
13. On the other hand, Vaillancourt (1986: 83) argues that the total administrative and compliance costs of the personal income tax and payroll tax system in Canada account for about 6.9 per cent of tax reve-nues collected.
14. The federal government has moved to curtail the deductibility of these provincial payroll taxes. 15. Dahlby (1992) provides a thorough review of the
theoretical literature on payroll tax impacts. 16. See Mincer (1976) for a model with this type of
unemployment.
17. This argument, combined with the observation that marginal payroll tax rates are highest for low-wage workers, suggests that employment impacts may be especially large for these workers.
18. Mitchell (1993) provides a recent survey of the wage rigidity literature.
19. See Meng (1989) for measures of compensating dif-ferentials for dangerous jobs in Canada.
20. Dahlby (1993: 81) notes that 65 per cent of premi-ums were paid by employers.
21. Hamermesh (1993: 172), however, is skeptical of these “not very satisfactory studies”.
22. The supply-demand model suggests that an em-ployer payroll tax should decrease net-of-tax wages (or slow wage growth) while a tax on employees should increase wage growth.
23. Layard, Nickell, and Jackman (1991) and Lindbeck (1993) provide recent examples.
24. For example, Woodland (1975) reports labour de-mand elasticities by industry that range from -0.351 (finance) to -0.009 (trade) while Merrilees (1982) reports small labour demand elasticities that are ac-tually positive for certain age groups. The long-run labour demand elasticity for Canada in the Keil and Symons (1990) model is -2.5 compared to -0.42 in Bean, Layard, and Nickell (1986). Beach, Lin, and Picot (1995) provide an estimate of roughly -.3. Hum and Simpson (1991) summarize the Canadian la-bour supply literature reporting that uncompen-sated labour supply elasticities are almost always below 0.5 with a concentration of studies around 0.4-0.5 and another group concentrated in the 0.1-0.2 range. Some studies have even reported negative labour supply elasticities.
25. Hamermesh (1993) concludes that near full-shifting to labour is a reasonable assumption on the basis of low labour-supply elasticity estimates (mainly for the United States).
26. Specifically, two changes were made: (1) the “wedge” was separated into payroll tax and non-payroll tax components and (2) rather than model the change in the real employer wage as a function of the level of the wedge, we considered it more natural to express the level of the real wage as func-tion of the level of the wedge. Addifunc-tional detail re-ga rdin g the specification, data sou rces, and estimation are available from the authors. 27. This is in recognition of the simultaneity of the two
equations. Employment depends upon the real wage and the real wage depends upon employment through the employment rate.
28. These results from Table 9 are from the levels version of the model because it is not possible to simulate long-run effects from the first- differences version of the model.
References
Beach, Charles, Zhengi Lin, and Garnett Picot (1995) “The Employer Payroll Tax in Can-ada and its Effects on the Demand for La-bour,” paper presented at the Conference on Transition and Structural Change in the North American Labour Market, John Deutsch Institute and the Industrial Rela-tions Centre, Queen’s University, King-ston.
Bean, C., R. Layard, and S. Nickell (1986) “The Rise in Unemployment: a Multi-country Study,” Economica, Vol. 53, pp. S1-S22.
Canadian Institute of Actuaries (1993) Cana-dian Retirement Income Social Security Programs, Report of the Task Force on So-cial Security Financing (Toronto).
Canadian Tax Foundation (1993) The Na-tional Finances (Toronto).
Dahlby, Bev (1992) “Taxation and Social In-surance,” in R.M. Bird and J. Mintz (eds.)
Taxation to 2000 and Beyond, Canadian Tax Paper No. 93, Canadian Tax Founda-tion, pp. 110-165.
Dahlby, Bev (1993) “Payroll Taxes,” in A. Maslove (ed.) Business Taxation in On-tario (Toronto: University of Toronto Press), Chapter 3.
Employment and Immigration Canada (vari-ous years) Annual Report (Ottawa: Sup-ply and Services Canada).
Finance Canada (1994) Proposed Changes to the Unemployment Insurance Program,
Ottawa.
Financial Executives Institute of Canada (1995) Workers’ Compensation in Can-ada 1993 (Toronto).
Freeman, Alan (1995) “UI Premium Cuts on the Horizon,” Globe and Mail, March 7. Gillespie, W. Irwin, Frank Vermaeten, and
Arndt Vermaeten (1995) “Who Paid the Taxes in Canada, 1951-1988,” Carleton Economics Paper, No. 95-02, Ottawa. H a m e r m e s h , D . ( 1 9 9 3 ) Labor Demand
(Princeton: Princeton University Press). Health and Welfare Canada (1986) Income
Se-curity Programs (Ottawa).
Health and Welfare Canada (1991) Canada Pension Plan Contributors (Ottawa). Hum, D. and Simpson, W. (1991) Income
Maintenance, Work Effort, and the Cana-dian Mincome Experiment, study pre-p a red f o r t h e E c on o mi c Co u n ci l o f Canada (Ottawa: Supply and Services Canada).
Human Resources Development Canada (1994) From Unemployment Insurance to Employment Insurance (Ottawa: Supply and Services Canada).
Keil, M.W. and J.S.V. Symons (1990) “An Analysis of Canadian Unemployment,”
Canadian Public Policy, Vol. XVI, No. 1, pp. 1-16.
Kesselman, Jonathan R. (1994) “Canadian Provincial Payroll Taxation: A Structural and Policy Analysis,” Canadian Tax Jour-nal, Vol. 42, No. 1, pp. 150-200.
Layard, R., S. Nickell, and R. Jackman (1991)
Unemployment - Macroeconomic Perform-ance and the Labor Market (Oxford: Ox-ford University Press).
Lindbeck, A. (1993) Unemployment and Mac-roeconomics (Cambridge: MIT Press). Meng, R. (1989) “Compensating Differentials
in the Canadian Labour Market,” Cana-dian Journal of Economics, Vol. XXII, No. 2, pp. 413-424.
Merrilees, W. (1982) “Labour Market Seg-mentation in Canada: an Econometric Approach,” Canadian Journal of Eco-nomics, Vol. XV, pp. 458-473.
Mincer, J. (1976) “Unemployment Effects of Minimum Wages,” Journal of Political Economy, Vol. 84, pp. S87-S104.
Mitchell, D.J.B. (1993) “Keynesian, Old Keynesian, and New Keynesian Wage Nominalism,” Industrial Relations, Vol. 32, No. 1, pp. 1-29.
Vaillancourt, F. (1986) The Administrative and Compliance Costs of the Personal In-come Tax and Payroll Tax System in Can-ada, 1986, Canadian Tax Foundation, Canadian Tax Paper no. 86.
Vaillancourt, F. and N. Marceau (1990) “On General Firm-specific Payroll Taxes,” Eco-nomics Letters, Vol. 34, pp. 175-181. Wilton, D. and D. Prescott (1993) “The
Ef-fects of Tax Increases on Labour Costs,” Government and Competitiveness Pro-ject, Discussion Paper 93-29, School of Policy Studies, Queen’s University, King-ston.
Woodland, A. (1975) “Substitution of Struc-tures, Equipment and Labor in Canadian Production,” International Economic Re-view, Vol. 16, pp. 171-187.
Workers’ Compensation Board of Ontario (1992) WC Funding Strategy (Toronto).