University of Massachusetts Amherst
ScholarWorks@UMass Amherst
Masters Theses 1911 - February 2014January 2007
An Analysis Of The Saftey Effects Of Crosswalks
With In-pavement Warning Lights
George Gadiel
University of Massachusetts Amherst
Follow this and additional works at:https://scholarworks.umass.edu/theses
This thesis is brought to you for free and open access by ScholarWorks@UMass Amherst. It has been accepted for inclusion in Masters Theses 1911 -February 2014 by an authorized administrator of ScholarWorks@UMass Amherst. For more information, please contact
Gadiel, George, "An Analysis Of The Saftey Effects Of Crosswalks With In-pavement Warning Lights" (2007).Masters Theses 1911 -February 2014. 8.
AN ANALYSIS OF THE SAFETY EFFECTS OF CROSSWALKS WITH IN-PAVEMENT WARNING LIGHTS
A Thesis Presented
by
GEORGE GADIEL
Submitted to the Graduate School of the
University of Massachusetts Amherst in partial fulfillment of the requirements for the degree of
MASTER OF SCIENCE
MAY 2007
AN ANALYSIS OF THE SAFETY EFFECTS OF CROSSWALKS WITH IN-PAVEMENT WARNING LIGHTS
A Thesis Presented
by
GEORGE GADIEL
Approved as to style and content by:
_______________________________ Michael A. Knodler, Jr., Chair
_______________________________ John Collura, Member
_______________________________ Donald L. Fisher, Member
__________________________________________ Carlton L. Ho
Graduate Program Director, MSCE and Ph. D. Department of Civil and Environmental Engineering
iii ABSTRACT
AN ANALYSIS OF THE SAFETY EFFECTS OF CROSSWALKS WITH IN-
PAVEMENT WARNING LIGHTS
MAY 2007
GEORGE GADIEL, B.S.I.E., LEHIGH UNIVERSITY
M.S., UNIVERSITY OF MASSACHUSETTS AMHERST
Directed by: Professor Michael A. Knodler, Jr.
Pedestrian safety is among one of the largest concerns in the transportation
profession. Many treatments have been developed and implemented to improve
pedestrian safety. This current research focuses on the efficiency of in-pavement
warning lights systems and involves multiple objectives. The primary objective is to
evaluate the yielding rates and crosswalk usage of existing and proposed in-pavement
lights systems with comparisons including before and after data through a case study
approach. A secondary objective is to evaluate where drivers are looking when they
approach in-pavement lights systems and develop a model to evaluate their behavior.
The research described herein formulated these objectives into two research
hypotheses and used statistical evaluation methodologies to provide quantitative and/or
qualitative responses to the developed hypotheses. Data on pedestrian and driver
behavior in the field, and the interaction between, them was collected using video camera
technology in the Amherst, Massachusetts area. Data regarding drivers scan patterns
during the approach to a crosswalk with in-pavement warning light system was collected
using a driving simulator and an eye tracker. In total, 1,949 non-staged pedestrians and
iv
field experiment and a total of 32 drivers participated in 576 crosswalk scenarios in the
driving simulator evaluation.
The field evaluation resulted in increased yielding rates and crosswalk usage after
installation of in-pavement warning lights, while driving simulator evaluation resulted in
drivers not becoming accustomed to scanning for lights instead of a pedestrian.
Recommendations include installation of in-pavement warning lights at traditional,
midblock crosswalks and continued exploration of all crosswalks in the driving simulator
v
TABLE OF CONTENTS
ABSTRACT... iii
LIST OF TABLES... vii
LIST OF FIGURES ... viii
CHAPTER I. INTRODUCTION………...1
Problem Statement ... 2
Crosswalks ... 3
In-Pavement Warning Lights System ... 4
Research Hypotheses ... 7
Research Objectives... 8
Scope... 8
II. REVIEW OF THE LITERATURE…………...……….9
In-Roadway Treatments... 9
Pedestrian Signal Treatments... 15
Driver Scan Patterns ... 20
Reaction to Different Colored Warning Lights ... 21
Summary ... 22
III. EXPERIMENTAL DESIGN AND RESEARCH METHODOLOGY……….……..24
Task 1: Literature Review... 24
Task 2: In-Pavement Crosswalk Field Evaluation... 24
Task 3: Driving Simulator Evaluation ... 29
Task 4: Documentation of Findings... 34
IV. ANALYSIS OF EXISTING AND PROPOSED IN-PAVEMENT LIGHTS……....35
Field Evaluation Results and Analysis ... 35
Summary ... 41
V. ANALYSIS OF DRIVER’S SCAN PATTERNS………..……….43
Demographics ... 44
vi
Yielding and Braking Responses ... 45
Follow-Up Evaluation... 48
Scanning Behavior from Crosswalk 18 ... 50
Summary ... 52
VI. CONCLUSIONS AND RECOMMENDATIONS……….………53
Conclusions... 53
Field Evaluation ... 54
Driving Simulator Evaluation ... 55
Conclusions of Research Hypotheses ... 56
Recommendations... 57
Future Research ... 58
APPENDICES A. DRIVING SIMULATOR FORMS... 60
B. DRIVING SIMULATOR SCORECARD ... 67
C. DRIVING SIMULATOR FOLLOW-UP STATIC EVALUATION ... 69
vii
LIST OF TABLES
Table Page
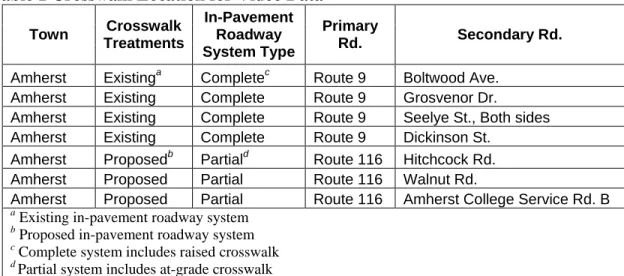
1. Crosswalk Location for Video Data ... 25
2. Crosswalk Attributes... 26
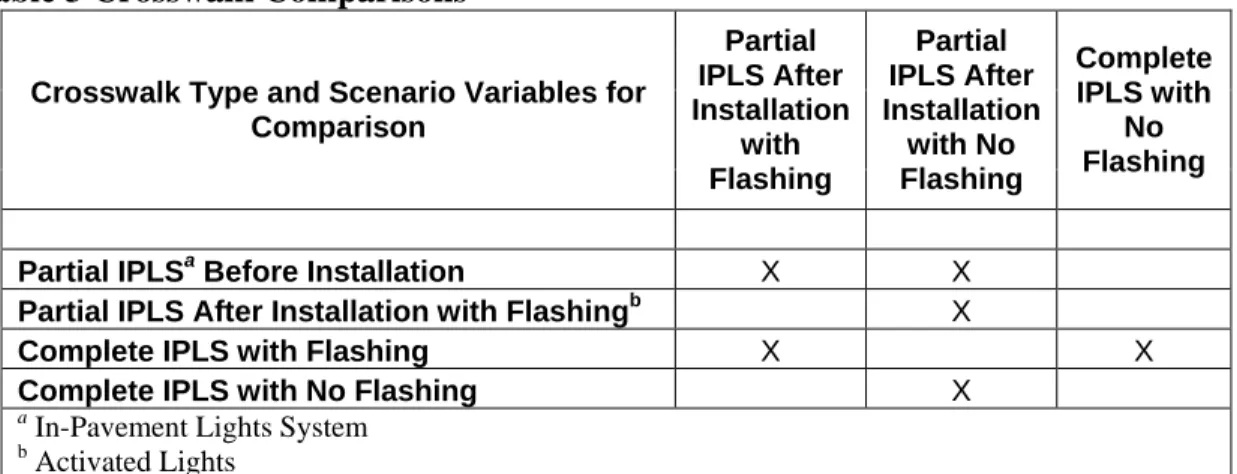
3. Crosswalk Comparisons... 27
4. Crosswalk Staging Distances... 29
5. Simulator Scenarios ... 33
6. Non-Staged Crosswalk Yielding Percentages ... 37
7. Staged Crosswalk Yielding Percentages... 38
8. Crosswalk Use Percentages ... 38
9. Yielding Percentage Comparisons between Complete and Partial In-Pavement Lights Systems ... 40
10. Yielding Percentage Comparisons between Staged Complete and Partial In-Pavement Lights Systems ... 40
11. Crosswalk Use Comparisons between Complete and Partial In-Pavement Lights Systems ... 41
12. Breakdown of Driver Demographics for Task 3 Experiment ... 45
13. Yielding and Driver Response Behavior Experimental Group... 46
14. Yielding and Driver Response Behavior Control Group... 47
15. Yielding Percentage Comparison Between Experimental and Control Groups ... 48
16. Summary of Follow-Up Evaluation... 49
viii
LIST OF FIGURES
Figure Page
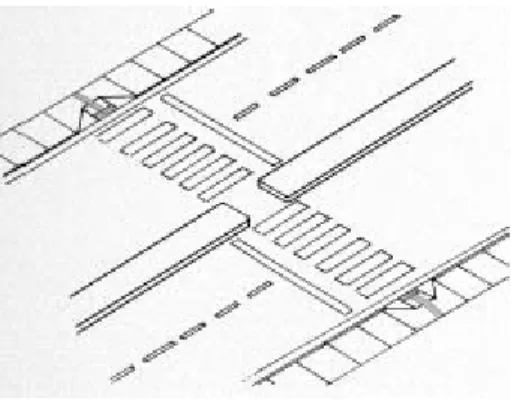
1. Example of a Midblock Crosswalk (3). ... 3
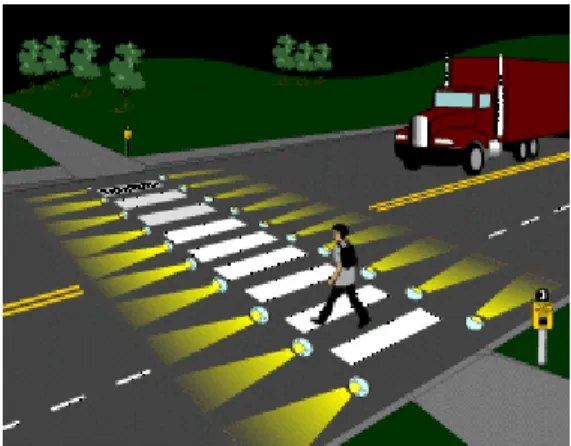
2. In-Pavement Warning Lights System (5). ... 5
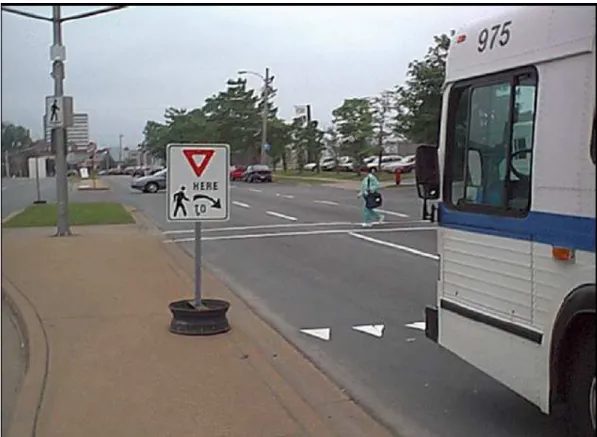
3. Advance Yield Marking in Halifax, Nova Scotia (10). ... 11
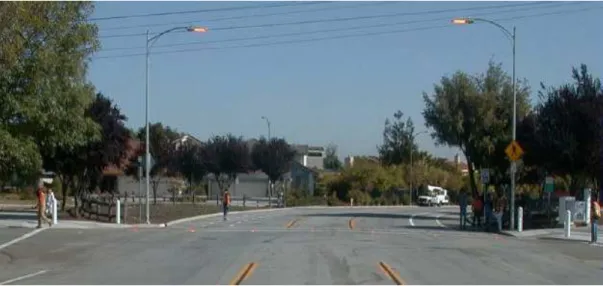
4. In-Pavement Warning Lights System in San Jose, CA (13)... 12
5. Countdown Signal in Lake Buena Vista, FL (17)... 16
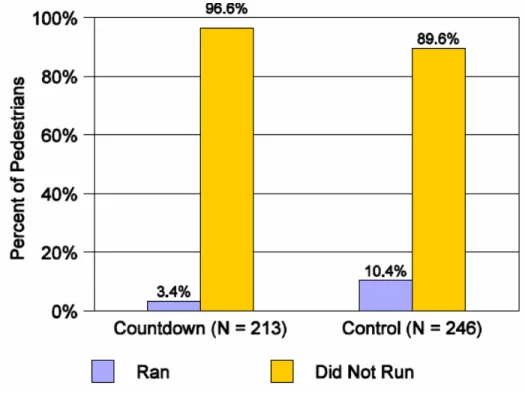
6. Compliance Levels of Pedestrians in Lake Buena Vista, FL (17)... 17
7. Pedestrians who started running when flashing DON’T WALK indication appeared (17)... 18
8. Animated LED “Eyes” Pedestrian Signal in Clearwater, FL (18)... 18
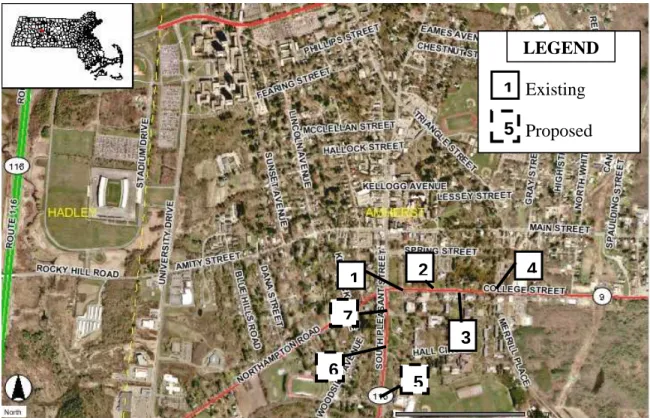
9. GIS Map of Amherst, MA Crosswalk (22)... 26
10. Video Camera Setup in the Field. ... 28
12. Human Performance Lab Driving Simulator at University of Massachusetts Amherst ... 31
13. Applied Science Laboratories Eye and Head Tracker. ... 31
1
CHAPTER 1 INTRODUCTION
Despite the increased emphasis on promoting the accommodation of pedestrians
within the transportation system, pedestrians have the highest risk of injury among users
of the road system. Specifically, there is a high risk of death or injury due to the
interaction of pedestrians and drivers, particularly with the prevalence today of higher
speeds: only 15 percent of pedestrians hit at 40 miles per hour survive, while at 20 miles
per hour or less, 95 percent survive (4). Given the prevalence of walking as a critical
mode of transportation, and the particular vulnerability of pedestrians, pedestrian safety is
among one of the most important concerns in the transportation industry. Crashes
involving pedestrians are a frequent occurrence and make up two percent of all people
injured in traffic crashes and 11 percent of all traffic related fatalities. In the U.S. in
2003, 4,749 pedestrians were killed and 70,000 injured from motor vehicle crashes,
which translates to an average of one pedestrian killed every 111 minutes and an average
of one pedestrian injured every eight minutes (1).
Extensive research and innovative strategies have been employed in an effort to
counter the failures to keep the roadways safe for pedestrians in just the past few years
with varying results. One of the more promising pedestrian treatments that has recently
been added to the Federal Highway Administration’s (FHWA) Manual on Uniform
Traffic Control Devices (MUTCD), which the governs the use of traffic control devices
and presents recommendations for regulatory, warning and guide signs, pavement
2
Warning Light System (1). Alternatively, this system has been referred to as
in-pavement roadway lights. It has been the focus of myriad studies focusing on vehicle
compliance and pedestrian use.
Problem Statement
Providing pedestrian safety is a critical objective of the transportation profession
and in recent years, increasing amounts of time have been spent researching strategies to
reduce the conflicts, or consequences of conflicts, between pedestrians and motor
vehicles. Achieving pedestrian safety while simultaneously maintaining a desirable level
of service for vehicles is a challenging process for transportation professionals. Although
the National Highway Traffic Safety Administration’s (NHTSA) National Center for
Statistics and Analysis has reported a 15 percent decline over the past 10 years in the
frequency of pedestrian fatalities from 5,489 in 1994 to 4,641 in 2004, there is still great
concern for pedestrian safety. Specifically, recent developments indicate that there is a
need for added research to develop an understanding of existing practices and
developments of in pavement lights (1).
The largest proportion of pedestrian fatalities occurs at night when pedestrians are
commonly less conspicuous (1). Most of the pedestrian treatments currently employed
do not make it easier to see crosswalks; rather they only make drivers aware that a
crosswalk exists. The following sections describe how crosswalks are used, the
Crosswalk with In-Pavement Warning Light System, and how it interacts with
3
Crosswalks
The crosswalk is the most commonly used pedestrian treatment and has been
standardized by the MUTCD. A crosswalk is defined by the MUTCD 2003 Edition as
consisting of crosswalk markings (1). Specifically the MUTCD states:
Crosswalk markings provide guidance for pedestrians who are crossing roadways by defining and delineating paths on approaches to and within signalized intersections, and on approaches to other intersections where traffic stops. Crosswalk markings also serve to alert road users of a pedestrian crossing point across roadways not controlled by highway traffic signals or STOP signs. At nonintersection locations, crosswalk markings legally establish the crosswalk.
Crosswalks are used to mark intersections where there are substantial conflicts
between pedestrian and vehicular movements, but are used at unsignalized midblock
pedestrian crossings as well. A midblock crossing is a location between intersections
where a crosswalk has been placed and is used when there is heavy pedestrian traffic and
there are no nearby existing crosswalks to provide more frequent crossing opportunities.
Figure 1 illustrates a midblock crosswalk.
4
Midblock crosswalks provide access for pedestrians to cross roads with only two
directions of traffic allowing for easier crossing (3). Nevertheless, midblock crossings
create added challenges for drivers as their expectation is violated as they are less likely
to anticipate a crossing. To overcome this challenge, crosswalks are often equipped with
warning signage; however, there is also a need during the nighttime or during periods of
decreased luminance for adequate lighting to allow vehicles sufficient time to see
pedestrians and stop in advance of the crosswalk.
In-Pavement Warning Lights System
A crosswalk with in-pavement warning lights system consists of amber lights
embedded in the pavement along both sides of the crosswalk. When a pedestrian
activates the lights either by pressing a button or through automated detection the lights
flash at a constant rate for a set period of time alerting the driver that a pedestrian is
present and therefore the driver should stop to allow the pedestrian to cross. The lights
are only activated by a pedestrian and shut off after a predetermined amount of time.
Two methods exist for activation of the lights: 1) push a button similar to a pedestrian
signal at an intersection, or 2) walk between two bollards which use break beam
technology. If technology is installed to detect a pedestrian in the crosswalk, then the
flashing time can be extended to allow for slower pedestrians to traverse the crosswalk.
5
Figure 2 In-Pavement Warning Lights System (5).
The latest edition of the MUTCD approved the use of in-pavement warning
system for use at marked crosswalks as an option over other treatments. With respect to
In-Roadway Warning Lights the MUTCD specifically states (1):
• If used, In-Roadway Warning Lights at crosswalks shall be installed only at marked crosswalks with applicable warning signs. They shall not be used at crosswalks controlled by YIELD signs, STOP signs, or traffic control signals. • If used, In-Roadway Warning Lights at crosswalks shall be installed along both
sides of the crosswalk and shall span its entire length.
• If used, In-Roadway Warning Lights at crosswalks shall initiate operation based on pedestrian actuation and shall cease operation at a predetermined time after the pedestrian actuation or, with passive detection, after the pedestrian clears the crosswalk.
• If used, In-Roadway Warning Lights at crosswalks shall display a flashing yellow signal indication when actuated. The flash rate for In-Roadway Warning Lights at crosswalks shall be at least 50, but not more than 60, flash periods per minute.
6
The flash rate shall not be between 5 and 30 flashes per second to avoid frequencies that might cause seizures.
• If used on one-lane, one-way roadways, a minimum of two In-Roadway Warning Lights shall be installed on the approach side of the crosswalk. If used on two-lane roadways, a minimum of three In-Roadway Warning Lights shall be installed along both sides of the crosswalk. If used on roadways with more than two lanes, a minimum of one In-Roadway Warning Light per lane shall be installed along both sides of the crosswalk.
• If used, In-Roadway Warning Lights shall be installed in the area between the outside edge of the crosswalk line and 3 m (10 ft) from the outside edge of the crosswalk. In-Roadway Warning Lights shall face away from the crosswalk if unidirectional, or shall face away from and across the crosswalk if bidirectional.
The intent of in-pavement lights are to provide a better warning to drivers that a
pedestrian is present in the vicinity of a crosswalk, and are especially valuable at night
when the lights are most visible. In-pavement warning lights systems use amber/yellow
lights. Within the transportation system, flashing yellow lights are typically associated
with a caution or warning message. In defining the meaning of flashing yellow traffic
indications the MUTCD states (1):
Flashing yellow—When a yellow lens is illuminated with rapid intermittent flashes, vehicular traffic is permitted to proceed through the intersection or past such signal indication only with caution.
The MUTCD definition of flashing yellow contradicts the meaning of the flashing
7
approach a crosswalk with flashing yellow/amber lights they must always yield to
pedestrians as they must at all crosswalks because pedestrians have the right of way. The
yellow is consistent with current practices before and after the pedestrian has entered the
crosswalk.
Some research has been completed but additional safety research is needed to
address multiple issues with crosswalks, specifically with regard to in-pavement lights
systems. First, a field based experiment including a before and after study of
in-pavement lights systems is necessary to add to the literature assessing the impact on
safety of in-pavement lights. Second, questions exist regarding the scan pattern of
drivers approaching a midblock crosswalk, which need to be addressed. Specifically,
there is arguably a concern that drivers who are familiar with in-pavement lights will stop
glancing to the side for pedestrians when approaching a crosswalk and will, instead, rely
solely on the flashing lights to indicate that they must slow for a pedestrian.
Research Hypotheses
Based on the existing research discussed in the previous section and the need for
improvement in pedestrian safety in the U.S., the following hypotheses have been
developed. The purpose of this research is to complete the stated objectives by testing
the following research hypotheses:
Hypothesis 1: Pedestrian treatments which include the use of in-pavement light
systems provide for increased yielding rates and greater crosswalk
8
Hypothesis 2: When drivers approach a crosswalk with in-pavement warning lights
systems a consistent scan pattern develops where drivers become
accustomed to looking at the lights instead of at the curb for a
pedestrian. This applies primarily at night as pedestrians are not as
visible as during the day so drivers may come to rely on the
in-pavement lights.
Research Objectives
A pair of objectives has been established to directly address the research needs
identified in the previous section. The two objectives for the proposed experiment are as
follows:
1. Evaluate the safety of alternative in-pavement lights systems with different
attributes including advanced dynamic signs and raised crosswalks using a case
study approach; and,
2. Evaluate the driver’s scan patterns as they approach midblock crosswalks.
Scope
The scope of this research is limited to an examination of the safety effects of
crosswalks with in-pavement warning lights systems. Beyond the scope of this research
is the added discussion of the myriad established and/or experimental crosswalk
treatments beyond those including in-pavement warning lights. The intent of this paper is
9
CHAPTER II
REVIEW OF THE LITERATURE
Pedestrian safety has been the focus of many research projects in just the past few
years with the increased implementation of many new pedestrian treatments (5, 6, 8). To
develop a framework from which to consider in-pavement lights systems and
identification of potential candidate locations for such systems it is important to consider
the following topical areas: increased safety of in-pavement lights systems over
traditional, unsignalized midblock crosswalks and drivers’ behavior at in-pavement
crosswalks, specifically where are they looking and drivers reaction to different colored
warning lights. The following sections provide a review of the literature associated with
in-pavement treatments and traffic signals and the safety research that has resulted from
implementation. Additional discussion involves driver scan patterns when faced with
different events on the roadway. Lastly, research covering the human factors,
specifically reaction (i.e. braking and scanning), of different color lights is discussed.
In-Roadway Treatments
Midblock crosswalks are not as safe as crosswalks located at intersections but
roads without any crosswalks are not necessarily any safer. Fisher et al. reported that
Shankar found 78 percent of pedestrian crashes occurred at non-intersection crossings (6)
and over 40 percent occurred on roadways without crosswalks in the U.S. (7). As sited in
Fisher et al. and Ivan et al. found urban areas accounted for 69 percent of pedestrian
10
at locations without marked crosswalks. Although most crashes and fatalities occur in
urban areas, death is more likely from a crash in rural areas (6). Another study as sited in
Huang et al. found that 93 percent of midblock crosswalk crashes occurred at
uncontrolled locations (8). One of the more controversial issues with crosswalks:
whether marked crosswalks are safer than unmarked crosswalks. Pedestrians usually
believe that marked crosswalks increase their safety because drivers will be able to see
the marked white lines and stop for them. Zeeger et al. collected data at 1,000 unmarked
crosswalks and 1,000 marked crosswalks at 30 cities across the U.S. (9). Site
characteristics and crash data were collected at each site. First, there was no significant
difference in pedestrian crashes on two-lane roads between marked and unmarked
crosswalks or on multi-lane roads with average daily traffic (ADT) of 12,000 or less.
Second, at multi-lane roads with no raised medians of ADTs greater than 12,000 and
multi-lane roads with raised medians of ADTs over 15,000, pedestrian crash rates were
higher for marked versus unmarked crosswalks. Third, marked crosswalk crash rates
increased as ADTs increased, but stayed the same for unmarked crosswalks. Zeeger et al.
does not recommend removing marked crosswalks, but suggests more improvements
such as raised medians, traffic signals, speed reducing measures, and/or other treatments
(9).
As noted many different treatments have been developed for the purpose of
increased pedestrian safety. Van Houten et al. conducted research at three midblock
crosswalks in Halifax, Nova Scotia (10). In addition to the advance yield markings were
pedestrian activated flashing yellow beacons and appropriate signage. Advance yield
11
pedestrians by yielding vehicles. Figure 3 depicts the setup of the advance yield
markings and signage in Van Houten’s research (10).
Figure 3 Advance Yield Marking in Halifax, Nova Scotia (10).
Advanced yield markings were placed 10, 15, and 25 meters in advance of the
crosswalk with a yield to pedestrians here sign. First, a significant reduction in
pedestrian-vehicle conflicts of 74 percent, 87 percent, and 57.3 percent occurred at the
three crosswalks. Second, moving the markings to 15 meters had an insignificant change
from 10 meters. Third, a slightly higher percentage of vehicles yielded to pedestrians
when advance yield markings were used and a significant increase in the distance
12
Massachusetts at Amherst (UMass) is evaluating the efficiency of advance yield
markings using a series of field and driving simulator experiments.
Of particular concern when considering the causes of pedestrian crashes and
fatalities are the lighting conditions. Sixty percent of all pedestrian fatalities in 2003
occurred between 8:00 pm and 3:59 am (1). Most pedestrian treatments do not take
account of nighttime conditions; however this is believed to be one of the major
advantages of pavement warning lights systems as previously discussed. An
in-pavement warning lights system is illustrated in Figure 4.
Figure 4 In-Pavement Warning Lights System in San Jose, CA (13).
Research has been conducted to evaluate these systems. Hakkert et al. performed
a before and after study at four sites in Israel (11). Data was collected several weeks and
then several months after installation. Although, there were no control sites, the authors
expected the two after data collections to show sustained results over time. The results
13
• The speeds near and in advance of the crosswalks at two of four sites significantly decreased;
• The percentage of drivers who yielded to pedestrians who were at beginning of crosswalk doubled at three of four sites;
• The rate of pedestrian-vehicle conflict was reduced to less than one percent at all four sites; and,
• A ten percent reduction was observed in pedestrians who crossed outside of the crosswalk at all four sites.
Hakkert et al. recommended using this system where average vehicle speeds are
over 30 kilometers per hour and the percentage of vehicles yielding the right of way is
initially low (11).
A similar system was installed in Rockville, Maryland in the spring of 2004.
Rousseau et al. conducted a before and after study on driver and pedestrian behavior (12).
First, the authors found that the system had no effect on the number of pedestrians who
used the crosswalk and led to a significant increase in the percentage of drivers who
yielded when lights were activated from 36.0 percent to 70.7 percent on the near side and
64.9 percent to 98.1 percent on the far side. Second, there was an insignificant change in
driver yielding from before installation and after installation when lights were not
activated. This shows that the warning lights system increases the likelihood that drivers
will yield. Third, the number of vehicles that passed before one yielded and the wait
times for pedestrians were reduced (12).
Malek completed a before and after study in San Jose on an in-pavement warning
14
more drivers yielded after installation, especially at night. Driver yielding rates during
the day increased from 10 percent to 44 percent in the northbound direction and from 12
percent to 54 percent in the southbound direction. The rates at night on the same road
increased from five percent to 80 percent northbound and 5 percent to 72 percent
southbound. Pedestrian and driver surveys were only conducted after installation and the
results show drivers notice the crosswalk 71 percent, a pedestrian 89 percent, and
flashing lights 42 percent of the time during the day but at night a pedestrian was noticed
100 percent and flashing lights 91 percent of the time. There was no difference from day
to night of noticing the crosswalk. The most alarming result from the pedestrian survey
was that 18 percent of pedestrians believed that the activating the lights would
automatically stop drivers approaching the crosswalk (13).
In 2001, an in-pavement warning lights system began operation in Cedar Rapids,
IA. Kannel and Jansen collected spot speed and yielding to pedestrian data as well as
pedestrian and driver surveys (14). The results included a slight increase in approach
speed and an increase in percentage of drivers yielding. By six months, 100 percent of
vehicles arriving second stopped for pedestrians (14).
Another study performed with in-pavement warning lights system was in
September 2000 in Denville, NJ (12). Van Derlofske et al. concluded that the system
increased noticeability of crosswalks to drivers and reduced the number of vehicles
passing over crosswalks while a pedestrian was present, conflicts between drivers and
pedestrians, and the mean approach speed initially (15). However, the impact on mean
15
Pedestrian Signal Treatments
Innovative strategies to improve pedestrian safety are not limited to midblock
locations and may also be practical at signalized intersections. Over the past few years,
pedestrian signals have been enhanced to increase pedestrian safety. Countdown signals
have been used to change pedestrian and driver behavior at marked crosswalks. Leonard
et al. performed a study at two locations in Monterrey, CA and concluded the following
(16):
• Countdown signals did not prevent pedestrians from beginning to cross at beginning of the DON’T WALK indication;
• Pedestrians did not attempt to cross when there was fewer than 10 to six seconds left;
• Pedestrians increased their speed as time was running out;
• Only a small percentage of pedestrians were stranded;
• Most pedestrians understood the meaning of the countdown signal, said it helped them understand the pedestrian signal, and made them feel safe; and,
• Drivers would most likely not be able to use the information on a countdown signal to anticipate signal change.
Furthermore, Huang and Zeeger compared two intersections with countdown
signals and three control intersections in Lake Buena Vista, FL (17). A countdown signal
16
Figure 5 Countdown Signal in Lake Buena Vista, FL (17).
A pedestrian does not comply with a WALK signal if the pedestrian begins
crossing during the flashing or steady DON’T WALK indication. Huang and Zeeger
found that the percentage of pedestrians who did not comply with countdown signals was
larger than the percentage of pedestrians who did not comply with control signals as seen
17
Figure 6 Compliance Levels of Pedestrians in Lake Buena Vista, FL (17).
The experiment resulted in no statistically significant difference in the number of
pedestrians who were left in the crosswalk when countdown signal ended. Lastly, Huang
and Zeeger concluded that more pedestrians started running when the flashing DON’T
WALK indication appeared in the control signals (17). Figure 7 shows the percentage of
pedestrians who started running when the flashing DON’T WALK indication appeared in
18
Figure 7 Pedestrians who started running when flashing DON’T WALK indication appeared (17).
Another innovation in pedestrian signals is the animated LED “Eyes” pedestrian
signal as seen in Figure 8.
19
This pedestrian signal consists of a traditional pedestrian signal with a WALK,
Flashing DON’T WALK, and steady DON’T WALK indication with two eyes with
eyeballs that scan left and right for the entire time or a portion of the WALK indication.
This is used to remind pedestrians to look both ways for turning vehicles (18). Houten et
al. performed a study with LED “Eyes” at two signalized intersections in Clearwater, FL
(18). Condition one was the baseline condition with traditional pedestrian signal head.
The LED “Eyes” were displayed for 2.5 seconds at the beginning of the WALK interval
then followed by the WALK symbol for condition two. The duration of the WALK
indications ranged from seven seconds to 40 seconds at the different intersection legs.
Condition three displayed the LED “Eyes” for the initial 2.5 seconds of the WALK
interval concurrently with the WALK symbol then the LED “Eyes” were turned off for
the remainder of the WALK indication. For the fourth condition the LED “Eyes” were
illuminated for the initial 2.5 seconds with the WALK symbol then the LED “Eyes” were
displayed every 9.5 seconds concurrently with the WALK indication (18) for a total cycle
time ranging from 30 to 40 seconds.
The results indicated that for condition two the percentage of pedestrians not
looking for turning vehicles was reduced from 32 percent to 10 percent and 26 percent to
five percent at the two intersections from the baseline. Condition three resulted in an
even larger reduction to three percent at both intersections and condition four did not
have any change from condition three. The percentage of pedestrians not looking for
turning vehicles after six months was two percent. The number of pedestrian-vehicle
conflicts was reduced from 2.7 before installation to 0.6 and 0.4 at the two intersections
20
al. recommend displaying the “Eyes” concurrently with the WALK indication for 2.5
seconds and repeating it every 9.5 seconds to benefit pedestrians who start walking later
during the phase (18).
Although animated LED “Eyes” and countdown signals have been employed at
signalized intersections to improve safety, they are not suited for midblock locations.
In-pavement lights are more appropriate for midblock crosswalks and will be evaluated for
this research.
Driver Scan Patterns
Substantial research has used driver scan patterns as a method of evaluation to
determine how drivers react when faced with different situations while on the roadway.
Knodler tracked driver eye movements at permissive left turns using a driving simulator
equipped with head and eye tracking equipment (19). The results showed where drivers
were looking and if they fixated on an object or just glanced at it. Furthermore, Knodler
concluded that the application of the simulator and head and eye tracking equipment were
appropriate for this type of analysis (19).
An additional study using driver scan patterns involved airport terminal signs.
Kichhanagari et al. evaluated how drivers scan for their airline to determine in which
terminal it is located (20). A standard condition was compared with an alphabetical
condition. The standard condition consisted of four terminal signs with airlines listed in
three columns but not in alphabetical order while the alphabetical condition differed by
only alphabetical listings of airlines. The results indicated that drivers scanned twice as
21
al. concluded that this type of advanced warning sign might be helpful in other situations
when a large number of destinations need to be listed on several different signs (20).
A third study using driver eye scan patterns involved comparing experienced
drivers and novice drivers as they scanned for hazardous events. Underwood et al. found
novice drivers showed less extensive scanning on demanding sections than experienced
drivers (21). Underwood et al. believe that the underlying reason was because novice
drivers have not developed an understanding for the types of events that can occur on the
highway (21).
Previous research on scan patterns is important to the research In this paper
because where drivers scan when approaching a crosswalk with in-pavement lights is
essential to the safety of these crosswalks. The locations where a driver scans will
determine whether or not the driver is looking for a pedestrian.
Reaction to Different Colored Warning Lights
Research that involves using non-amber lights for crosswalks with in-pavement
warning lights systems does not exist; however, research has been conducted involving
the use of non-amber warning lights on construction vehicles and in snowy conditions.
Ullman performed an evaluation of blue lights with amber lights on construction vehicles
on five urban freeways in Houston and San Antonio, Texas (25). The results showed that
the combination of blue and amber lights significantly reduced speeds at which drivers
passed the test locations by five to six mph as compared to solely the use of amber lights
at two of the five sites. The amber and blue warning lights resulted in a higher braking
22
only lights. Additionally, the blue/amber combinations produced a significantly higher
percentage of brake applications than the amber light alone at one site. Furthermore,
Ullman conducted a survey which resulted in drivers saying that amber lights
communicate the least amount of hazard, followed by blue, and then red (25).
Additionally, the survey results indicated that blue and amber combination indicates more
hazard then amber alone. Ullman concluded that the application of blue light with amber
offers a potential to improve safety (25).
Mima and Kajiya conducted a study in Japan to determine the visibility of
different color LED lights in snowy conditions (26). The colors tested were red, yellow,
green, blue, and white. During the daytime with a white snowy mountain in the
background, blue had the greatest visibility and yellow had the second worst visibility
with only white being worse. Again, blue had the greatest visibility, when used in
blowing and falling snow conditions. Mima and Kajiya recommend using blue with
yellow lights in snowy conditions because visibility is greater with blue and people are
not used to seeing blue, so the use of yellow as well will cause less confusion (26).
Summary
The preceding sections describe current topics in the transportation industry
related to pedestrian safety improvements and scan pattern evaluation. First, many
different pedestrian treatments at crosswalks both with the pavement markings, in
pavement lighting systems, and alternative signals have been evaluated by researchers in
recent years. Researchers have found that some treatments are more successful than
23
effects on safety of in-pavement warning lights systems versus traditional, unsignalized
midblock crosswalks. Second, driver eye scan patterns has been successful in evaluating
permissive left-turns, airport terminal signs and comparing novice and experienced
drivers when looking for hazardous events. Third, in-pavement warning lights are
typically amber, but there is a lack of research about using other colors or color
combinations. Research has been conducted involving construction vehicles with
different colors and color combinations other than the standard amber only. The use of
blue and amber lights has produced better results than amber alone, but more research is
needed. Additional research indicates blue lights had greater visibility than yellow when
shown in snowy conditions. The following sections summarize the research hypotheses
24
CHAPTER III
EXPERIMENTAL DESIGN AND RESEARCH METHODOLOGY
A series of tasks were developed to successfully complete the research objectives
and test the established hypotheses presented previously. The sections below describe in
detail the four research tasks completed.
Task 1: Literature Review
The initial task was a review of previous literature associated with pedestrian
safety. The literature review remained ongoing throughout the entire research process.
Several aspects of pedestrian safety were considered in order to identify significant
accomplishments to date. First, different types of treatments were reviewed including
both in-roadway lights and signals, specifically their effectiveness and how drivers and
pedestrians interact with them. Second, research involving driver scan patterns when
faced with different situations on the roadway is discussed. Third, research on driver
reaction to different colors and color combinations of lights was conducted. The results
of the literature review task were described previously in Chapter II.
Task 2: In-Pavement Crosswalk Field Evaluation
This task was a case study which evaluated the existing and proposed
in-pavement lights and compared them to each other as well as before and a month after
installation at the proposed site. Video camera data was collected at seven total locations,
25
• Four existing in-pavement lights; and,
• Three proposed in-pavement lights both before and after installation.
The hours of collection ranged from 8:00 am to 8:00 pm at the four locations of
crosswalks with in-pavement warning lights and 8:00 am to 6:00 pm at the other three
locations. The different collection times are a result of daylight conditions and it staying
light out longer when data was collected at the crosswalks with existing in-pavement
lights. The video cameras were used to analyze pedestrian and vehicular behavior and
interaction. Table 1 lists the seven locations where video data was collected.
Table 1 Crosswalk Location for Video Data
Town Crosswalk Treatments In-Pavement Roadway System Type Primary Rd. Secondary Rd.
Amherst Existinga Completec Route 9 Boltwood Ave. Amherst Existing Complete Route 9 Grosvenor Dr.
Amherst Existing Complete Route 9 Seelye St., Both sides Amherst Existing Complete Route 9 Dickinson St.
Amherst Proposedb Partiald Route 116 Hitchcock Rd. Amherst Proposed Partial Route 116 Walnut Rd.
Amherst Proposed Partial Route 116 Amherst College Service Rd. B
a
Existing in-pavement roadway system b
Proposed in-pavement roadway system c
Complete system includes raised crosswalk d
Partial system includes at-grade crosswalk
A map of crosswalk locations in Amherst, MA is presented in Figure 9, and the
attributes for the different crosswalks are listed in
Table 2. By comparison, Table 3 lists the comparisons that were made between
26
Figure 9 GIS Map of Amherst, MA Crosswalk (22).
Table 2 Crosswalk Attributes
Crosswalk Type Raised
Crosswalk Pavement Light Direction Pedestrian Crossing Markings Refuge Island LED Pedestrian Sign
Complete In-Pavement Lights System Yes Outa Yes No Yes Partial In-Pavement Lights System No Bothb Yes Yes No
Crosswalk Type Advanced Yield Markings Retroflective Pedestrian Crossing Signs Centerline Pedestrian Crossing Signs Speed (MPH)
Complete In-Pavement Lights System No Yes No 25 Partial In-Pavement Lights System Yes Yes Yes 40
a
Lights are directed towards vehicles only b
Lights are directed out towards vehicles and in towards crosswalk
2 1 3 4 5 6 7 Existing Proposed 1 LEGEND 5
27
Table 3 Crosswalk Comparisons
Crosswalk Type and Scenario Variables for Comparison Partial IPLS After Installation with Flashing Partial IPLS After Installation with No Flashing Complete IPLS with No Flashing
Partial IPLSa Before Installation X X
Partial IPLS After Installation with Flashingb X
Complete IPLS with Flashing X X
Complete IPLS with No Flashing X
a
In-Pavement Lights System
b
Activated Lights
Comparisons were made between, but not limited to, the following:
• Partial in-pavement lights systems
o Before installation and after installation with flashing
o Before installation and after installation with no flashing
o After installation with flashing and after installation with no flashing
• Complete in-pavement lights systems
o With flashing and with no flashing
• Complete in-pavement lights system with flashing and partial in-pavement lights system with flashing
• Complete in-pavement lights system with no flashing and partial in-pavement lights system with no flashing
The measures used to analyze these data are:
• Percentage of drivers who yield to pedestrians crossing at the crosswalk; and,
• Percentage of pedestrians who cross within the crosswalk; Figure 10 shows the setup of the video camera in the field.
28
Figure 10 Video Camera Setup in the Field.
The video camera recordings included crosswalk staging where a researcher
crosses the crosswalk once a vehicle reaches a certain distance upstream from the
crosswalk. Staging provides for a worst-case scenario of the naturalistic range to allow
for a consistent method of evaluating in-pavement warning lights. Staging was
completed by measuring a specified distance upstream from the crosswalk (based upon
approach speed) and posting a research member at that location. When a free flowing
vehicle reached that point, the posted member signified to the other member who is
standing on the side of the road at the crosswalk three feet back from the curb to start
walking at a steady pace. Safety was involved at all stages of the procedure as the
crossing researcher only did so in the event that a vehicle yields during this experiment.
This process was completed 25 times per direction at each experimental crosswalks and
the pedestrian-vehicle interaction was recorded using the video camera. The distances
for staging ranged from 100 feet to 200 feet and as noted were based upon the crosswalk
approach speed. A distance of 200 feet was chosen on Route 116 because that was the
closest distance that allowed drivers to see the pedestrian and choose whether or not to
29
close proximity of each crosswalk. The difference between the Boltwood Ave.,
Grosvenor Dr, and Seelye St., and Dickinson St. distance is Dickinson St. is located at the
bottom of a downgrade, so a larger distance was chosen. Staging was conducted at two
of the existing locations and the three proposed locations both before and after
installation.
Table 4 lists the distance upstream chosen for crosswalk staging.
Table 4 Crosswalk Staging Distances Location
Number Crosswalk Location
Distance Upstream (ft)
1 Route 9 at Boltwood Ave. 100
2 Route 9 at Grosvenor Dr. 100
3 Route 9 at Seelye St. 100
4 Route 9 at Dickinson St. 150
5 Route 116 at Hitchcock St. 200
6 Route 116 at Walnut St. 200
7 Route 116 at Amherst College Service Road B 200
Both a power analysis test of proportions was completed on the collected data
where there was an acceptable sample size. The data used for the statistical analysis was
the percentage of drivers who yielded to crossing pedestrians and percentage of
pedestrians who used crosswalk. Here the test of proportions was used to determine if
in-pavement warning lights increase safety.
Task 3: Driving Simulator Evaluation
The methodology of evaluation to identify driver scan patterns on the approach to
a crosswalk with in-pavement warning lights was done using a fixed base, fully
30
Laboratory (HPL) at UMass. The driving simulator consists of a 1995 four door Saturn
sedan. Drivers are able to control the steering, braking, and acceleration just as they
would if they were driving the vehicle on the road as the roadway adjusts accordingly to
the driver’s actions (23). The virtual scenes are displayed on three screens, one in front
and two on the side, to create a field of view that subtends 150 degrees (24). Additional
features of the simulator include three speakers, one on the left, one on the right, and a
subwoofer in front of the vehicle (24), resolution up to 1024 x 768 dots per inch and a
refresh rate of 60Hz (23). The driving simulator can also provide realistic noises
including wind, road, and other vehicles with appropriate direction, intensity, and
Doppler shift (24). The HPL driving simulator is pictured in Figure 11. Designer’s
Workbench by Coryphaeus Software, Inc. was used to create the simulated in-pavement
warning lights crosswalks. Real Drive Scenario Builder (RDSB) software created by
Monterey Technologies, Inc. was used to program the driving and interaction with
pedestrians in the roadway system (23).
The eye tracker shown in Figure 12 allows for unrestricted head movement of the
driver. The eye tracker output is a crosshair coordinated with the driver’s eye position
signifying where the driver is looking and records the driver eye position every 60
seconds. The tracker was used to determine where the driver is looking and not used for
looking at sequential scan patterns. The accuracy of where the driver is looking was
reported. The crosshair displayed over a typical simulated screen is pictured in Figure 13.
31
Figure 11 Human Performance Lab Driving Simulator at University of Massachusetts Amherst.
32
Figure 13 Simulator Screen Capture featuring Eye and Head Tracker Crosshairs.
The experiment consisted of 32 men and women ranging in age from 18 to 65
with a valid drivers’ license and an assumed 20/40 vision (corrected) or better and were
not screened for demographics. The goal was to have a balanced number of men and
women participate in the experiment, with an equal number of men and women in two
groups: an experimental and a control group. The experimental condition consisted of 18
crosswalks at night. The first 17 crosswalks consisted of either flashing or no flashing
lights. The flashing lights had a pedestrian crossing from either the right or left and the
crosswalks without flashing lights did not have a pedestrian. Four different random
patterns of flashing and no flashing lights were chosen for the experimental group and are
listed in Table 5. The last crosswalk had no flashing lights, but a pedestrian to test if
drivers had been reconditioned to look for flashing lights; rather than for pedestrians
queued on the curb. Each crosswalk had a pedestrian crossing sign to warn drivers to be
alert for potential pedestrians.
33
Table 5 Simulator Scenarios
Simulator Scenarios
Crosswalk 1 2 3 4
1 Flasha No Flash No Flash Flash 2 Flash No Flash Flash Flash 3 No Flashb Flash No Flash Flash 4 Flash Flash Flash No Flash 5 No Flash No Flash No Flash No Flash 6 No Flash Flash Flash Flash 7 Flash No Flash Flash No Flash 8 Flash Flash No Flash No Flash 9 No Flash No Flash Flash Flash 10 No Flash Flash No Flash Flash 11 Flash No Flash No Flash No Flash 12 No Flash No Flash Flash No Flash 13 Flash Flash Flash Flash 14 No Flash No Flash No Flash Flash 15 No Flash Flash Flash No Flash 16 Flash Flash Flash Flash 17 Flash Flash No Flash No Flash 18 No Flash and a Pedestrian No Flash and a Pedestrian No Flash and a Pedestrian No Flash and a Pedestrian a Lights Activated b
Lights Not Activated
The control group was similar to the experimental however, there were no
flashing lights at any of the crosswalks. A total of 16 different subjects participated in
each group.
The research identified driver scan patterns to determine if the driver was looking
at the lights, scanning for pedestrians, or looking elsewhere by comparing the
experimental group to the control group. Additionally, the researcher recorded if the
driver yielded to the pedestrian and any driver behavior.
The data collected with the driving simulator was used to determine if drivers are
looking exclusively at the flashing lights. Additionally, the data collected from this
simulator evaluation -- percentage of drivers who yield to pedestrians -- was compared to
34
statistical analysis. This comparison was used to establish whether crosswalks with
in-pavement warning lights are safer than traditional marked crosswalks.
Task 4: Documentation of Findings
The results of this research were documented in the form of a Master’s Thesis in
35
CHAPTER IV
ANALYSIS OF EXISTING AND PROPOSED IN-PAVEMENT LIGHTS
The primary objective of this analysis was to evaluate the safety of alternative
in-pavement lights systems by comparing data collected in the field of different types of
crosswalks and different scenario variables, i.e. flashing, no flashing, before installation,
and/or after installation. The two measures used in this analysis were percentage of
drivers who yield to pedestrians crossing at the crosswalk and percentage of pedestrians
who cross within the crosswalk. This analysis was comprised of three primary subtasks,
watching of the video recordings, compiling of recorded data, and analyzing and
comparing data between the different types of crosswalks and scenario variables. The
following section describes the results of field evaluation. As described in Chapter III, a
complete statistical analysis was completed on all results.
Field Evaluation Results and Analysis
A total of 1,949 non-staged pedestrians and 606 staged pedestrians were observed
crossing at the seven crosswalk locations. The percentage of drivers who yielded to
pedestrians crossing at crosswalks with the complete in-pavement lights system when
lights were activated ranged from 90.6 percent to 100.0 percent. The percentage of
drivers who yielded to pedestrians crossing at crosswalks with the complete in-pavement
lights system when lights were not activated ranged from 90.0 percent to 98.0 percent.
At the proposed sites before partial in-pavement lights systems were installed the
36
42.5 percent to 50.0 percent. The proposed sites with partial in-pavement lights system
installed had a range of 63.9 percent to 100.0 percent when lights were activated and 80.9
percent to 95.0 percent when lights were not activated. A summary of all non-staged
yielding percentages is shown in Table 6.
The percentage of drivers who yielded to staged pedestrians crossing at the
crosswalks ranged from a low of 30.5 percent to a high of 95.5 percent. A complete
summary of all staged yielding percentages can be found in Table 7.
Lastly, the percentage of pedestrians who used the crosswalks ranged from 44.6
percent to 100.0 percent. Table 8 lists the percentage of pedestrians who used the
crosswalks evaluated in this study.
Comparisons were made between individual crosswalks, but when the number of
observed pedestrians was small, observations from similar crosswalks were combined.
Using the test of proportions with a 95 percent confidence interval, a p-value was
calculated for all comparisons. A p-value greater than 0.05 indicates that the null
hypothesis can be accepted at the 95 percent level, and a p-value less than 0.05 indicates
that the null hypothesis can be rejected at the 95 percent level. For all comparisons the
null hypothesis was yielding percentages were equal and the alternative hypothesis was
yielding percentages were not equal.
When comparing yielding percentage at crosswalks before and after partial
in-pavement lights systems were installed a statistically significant difference between
before and after with lights activated (p=0.016) and before and after without lights
activated (p=0.000) occurred. There was no significant difference between after
37
yield to pedestrians crossing crosswalks when partial in-pavement lights systems are
installed than when no lights systems exist and no other differences are present. The
results show that just the presence of the lights increases yielding whether or not the
lights are activated. The effect of the medians was not accounted for in the before and
after comparisons as an isolated variable.
Table 6 Non-Staged Crosswalk Yielding Percentages
Crosswalk % Yield
Partial In-Pavement Lights Systems
Walnut Before 42.5%
Amherst College Before 50.0%
Walnut After w/ Flash 63.9%
South Amherst College After w/ Flash 100.0%
North Amherst College After w/ Flash 100.0%
Walnut After w/o Flash 81.6%
South Amherst College After w/o Flash 95.0%
North Amherst College After w/o Flash 80.9%
Complete In-Pavement Lights Systems
Boltwood w/ Flash 90.6% Grosvenor w/ Flash 100.0% Seelye w/ Flash 94.6% Dickinson w/ Flash 100.0%
Boltwood w/o Flash 94.5%
Grosvenor w/o Flash 98.0%
Seelye w/o Flash 94.4%
38
Table 7 Staged Crosswalk Yielding Percentages
Crosswalk % Yield
Partial In-Pavement Lights Systems
Hitchcock Before 30.5%
Walnut Before 30.9%
Amherst College Before 57.8%
Hitchcock After 68.1%
Walnut After 79.6%
South Amherst College After 71.6%
North Amherst College After 76.9%
Complete In-Pavement Lights Systems
Seelye 95.5%
Dickinson 93.8%
Table 8 Crosswalk Use Percentages
Crosswalk % Yield
Partial In-Pavement Lights Systems
Walnut Before 63.2%
Amherst College Before 44.6%
Hitchcock After 93.8%
Walnut After 93.8%
South Amherst College After 100.0%
North Amherst College After 94.8%
Complete In-Pavement Lights Systems
Boltwood 90.3%
Grosvenor 90.1%
Seelye 94.4%
Dickinson 77.2%
Only one crosswalk with complete in-pavement lights systems had a statistically
p-39
values for two of the other three crosswalks with complete in-pavement lights systems
are 0.305 and .9140. Not enough observations were made for the fourth crosswalk.
The comparisons between complete and partial in-pavement lights systems were
broken down into light activation and no light activation. Each individual crosswalk
when lights were activated did not produce enough observations for individual
comparisons so the observations were combined for all complete systems and for all
partial systems. There was a statistically significant difference between complete
systems with lights activation and partial systems with lights systems (p=0.000). Due to
the large amount of data collected when lights were not activated each crosswalk with
complete pavement lights systems was compared with each crosswalk with partial
in-pavement lights systems. A total of 16 comparisons were made between complete and
partial systems and nine produced statistically significant differences. The comparisons
and respective p-values are presented in Table 9. The results show that complete
in-pavement lights systems are safer than partial in-in-pavement lights systems due to the
larger percentage of drivers yielding to pedestrians crossing the crosswalks. These
results can be attributed to the main differences between the complete and partial systems
including raised crosswalks for the complete systems.
Staging produced significant results as well. Three before and after installation of
partial in-pavement lights systems comparisons were made and all three resulted in
statistically significant differences (p=0.000, 0.000, and .0240). Again, the effect of the
median was not accounted for as an isolated variable in the staged comparison between
before and after installation. A significant increase in yielding percentage of drivers to
40
comparisons were made between complete and partial in-pavement lights systems with
staging. All eight resulted in statistically significant differences with higher yielding
percentages for complete systems. Table 10 summarizes the results from staged
complete and partial systems comparisons.
Table 9 Yielding Percentage Comparisons between Complete and Partial In-Pavement Lights Systems
Complete Crosswalk Partial Crosswalk P-Value
Boltwood w/o Flash Hitchcock After w/o Flash 0.0470
Boltwood w/o Flash Walnut After w/o Flash 0.0420
Boltwood w/o Flash South Amherst College After w/o Flash 0.9220
Boltwood w/o Flash North Amherst College After w/o Flash 0.0000
Grosvenor w/o Flash Hitchcock After w/o Flash 0.0070
Grosvenor w/o Flash Walnut After w/o Flash 0.0090
Grosvenor w/o Flash South Amherst College After w/o Flash 0.5410
Grosvenor w/o Flash North Amherst College After w/o Flash 0.0000
Seelye w/o Flash Hitchcock After w/o Flash 0.0500
Seelye w/o Flash Walnut After w/o Flash 0.0450
Seelye w/o Flash South Amherst College After w/o Flash 0.9020
Seelye w/o Flash North Amherst College After w/o Flash 0.0000
Dickinson w/o Flash Hitchcock After w/o Flash 0.3540
Dickinson w/o Flash Walnut After w/o Flash 0.2540
Dickinson w/o Flash South Amherst College After w/o Flash 0.4220
Dickinson w/o Flash North Amherst College After w/o Flash 0.0870
Table 10 Yielding Percentage Comparisons between Staged Complete and Partial In-Pavement Lights Systems
Complete Crosswalk Partial Crosswalk P-Value
Seelye Hitchcock After 0.0000
Seelye Walnut After 0.0090
Seelye South Amherst College After 0.0000
Seelye North Amherst College After 0.0010
Dickinson Hitchcock After 0.0000
Dickinson Walnut After 0.0240
Dickinson South Amherst College After 0.0000
Dickinson North Amherst College After 0.0050
Crosswalk use data produced different results from yielding percentage data.
41
installation with all three p-values equal to 0.000, the results from comparisons between
complete and partial systems were the opposite of the previous results with yielding
percentages. Comparisons of each crosswalk with complete systems and combined data
from the four crosswalks with partial systems resulted in statistically significant
differences in three of the four complete crosswalks which are presented in Table 11.
Possible explanation for the difference between crosswalk usage at the partial and
complete crosswalks are the sidewalks are adjacent to the roadway and the speed limit
was less at the complete crosswalks. The difference between crosswalk use and yielding
percentages by drivers is crosswalk use was higher at the partial systems than the
complete systems, the opposite of yielding percentage data. Combined data from partial
systems was used due to the difference in the amount of data collected between complete
and partial systems.
Table 11 Crosswalk Use Comparisons between Complete and Partial In-Pavement Lights Systems
Complete Crosswalk Partial Crosswalk P-Value
Boltwood Combined Partial Crosswalks 0.0050
Grosvenor Combined Partial Crosswalks 0.0070
Seelye Combined Partial Crosswalks 0.8260
Dickinson Combined Partial Crosswalks 0.0000
Summary
The findings of the field based in-pavement roadways lights experiment include:
• The installation of partial in-pavement roadway lights statistically improves the percentage of drivers who yield to pedestrians crossing in crosswalks over
42
• Activation of the lights at both partial and complete systems does not statistically improve driver yielding percentage over no light activation leading to the belief
that the existence of in-pavement roadway lights increases safety for pedestrians.
• Complete in-pavement lights systems are safer than partial in-pavement lights systems due to the statistically significant differences between yielding
percentages.
• Crosswalk use among pedestrians is statistically higher at crosswalks with partial in-pavement roadway lights than crosswalks with complete systems.
Overall the use of in-pavement roadway lights significantly improves the safety of
pedestrians at midblock crosswalks. When possible complete in-pavement lights systems
should be installed at midblock crosswalks, but partial in-pavement lights systems are
better than no lights at all. Results from this study and previous experiments present the