Thermal Stability and Devitrification Behavior of Ternary Ni-Nb-Ti
and Quaternary Glassy Alloys Containing Noble Metals
Takeyuki Shimada
1;*, Dmitri V. Louzguine
1, Junji Saida
2and Akihisa Inoue
1 1Institute for Materials Research, Tohoku University, Sendai 980-8577, Japan 2Center for Interdisciplinary Research, Tohoku University, Sendai 980-8578, Japan
The devitrification of Ni60Nb25Ti15glassy alloy has been investigated by X-ray diffraction (XRD), differential scanning and isothermal
calorimetry and transmission electron microscopy (TEM). The primarily crystallized phase was a cubic Ni(Ti,Nb) phase with a lattice parameter of 0.293 nm. A Ni3Nb phase follows precipitation of the Ni(Ti,Nb) phase. The cubic Ni(Ti,Nb) phase undergoes partial transformation to Ni4Ti3
phase. These cubic Ni(Ti,Nb) phases disappear at the equilibrium conditions.
The supercooled liquid region (Tx) of the Ni60Nb25Ti15glassy alloy was extended to 64 K with the addition of Pt. The Ni55Nb25Ti15Pt5
glassy alloy rods with diameters up to 2 mm were formed by mold casting. Pt and the other noble metals additions do not alter devitrification of Ni60Nb25Ti15glassy alloy.
(Received October 25, 2004; Accepted January 6, 2005)
Keywords: nickel-niobium-titanium alloy, noble metals, glass-forming ability, thermal stability, bulk glassy alloy, devitrification behavior
1. Introduction
Bulk glassy alloys were obtained by stabilization of the supercooled liquid against crystallization in a various multi-component metallic alloys, at the relatively slow cooling rate of less than 100 K/s from liquid state.1–4)The stabilization has enabled the production of bulk glassy alloys in the thickness range of 1–100 mm by using various casting processes. These alloys are promising materials for structural applications as they exhibit high mechanical strength, high fracture toughness and good corrosion resistance.2)
Ni-based bulk glassy alloys were obtained in Ni-Zr-Ti-Si,5,6) Ni-Zr-Ti-Sn,7) Ni-Nb-Ti,8) Ni-Nb-Zr-Ti9) systems.
Ni60Nb25Ti15 bulk glassy alloy has an ultimate compressive
strength of 3085 MPa and exhibits plastic deformation of about 2%. Bulk glassy alloy with high tensile fracture strength of 2700 MPa a critical diameter of 3 mm has been produced in a multicomponent Ni-Nb-Ti-Zr-Co-Cu sys-tem.10)
At the same time, the devitrification process of Ni-based glassy alloys has been poorly studied. The clarification of thermal stability and devitrification processes is of great importance for the glassy alloys which are expected to be used as structural materials. On the other hand, the increase of the thermal stability can be achieved by the proper alloying additions. However, an addition of an ordinary metal or a half-metal has already been performed.
Recently, it has been reported that noble metals (M) addition (Pd,Ag,Pt,Au) have changed thermal stability and altered devitrification pathway of Cu11,12)and Zr-based13,14)
glassy alloys forming an icosahedral quasicrystalline phase. In this paper, we present the results on the devitrification process of the Ni60Nb25Ti15glassy alloy (with a supercooled
liquid region Tx of 54 K and a reduced glass transition
temperature (Tg=Tl) of 0.622), as well as the influence of M
(Pd,Ag,Pt,Au) addition on the thermal stability and glass-forming ability of the Ni60xNb25Ti15Mxglassy alloys.
2. Experimental Procedure
The alloy ingots were prepared by arc-melting a mixture of pure metals in an argon atmosphere. From these alloy ingots, ribbon samples with a cross-section of about 0:021mm2
were prepared by a single roller melt-spinning method in an argon atmosphere. Bulk cylindrical samples of 2 mm or 3 mm in diameter were prepared by copper mold casting in an argon atmosphere. The thermal stability was investigated by differential scanning calorimetry (DSC) at a heating rate of 0.67 K/s and the liquidus temperature (Tl) was measured by
differential thermal analysis (DTA) at a cooling late of 0.067 K/s. Isothermal differential calorimetry tests were also performed. The structure was examined by X-ray diffraction (XRD) and transmission electron microscopy (TEM). Me-chanical properties were measured with an Instron testing machine at a strain rate of 5104s1. The gauge
dimension for the compressive test was 2 mm in diameter and 5 mm in height.
3. Results
3.1 Devitrification of Ni60Nb25Ti15 glassy alloy
Figure 1 shows DSC and isothermal calorimetry curves of the melt-spun Ni60Nb25Ti15glassy ribbon samples scanned at
864 K and 874 K. The DSC trace in Fig. 1(a) shows a variation of the baseline at about 864 K related to a glass-transition and two exothermic peaks.
Two overlapped peaks are observed in the isothermal calorimetry curves (Fig. 1(b)) corresponding to the first DSC peak (Fig. 1(a)). This indicates that two phase transitions might have happened simultaneously. We applied the heat treatment regime 1 (HT1) (see Fig. 1(b)) to the sample. It was subjected to argon-flow cooling after the achieving of the top of the first exothermic peak of the isothermal calorimetry curve (see Fig. 1(b)).
Figure 2 shows the XRD data of the glassy alloy heat-treated at some temperatures. Cubic Ni(Ti,Nb) phase with a lattice parameter ofa¼0:293nm and orthorhombic Ni3Nb phase with the lattice parameter ofa¼0:511nm,b¼
*Graduate Student, Tohoku University,
0:424 and c¼0:454nm are observed in the sample heat treated in the HT1 regime. These phases also exist after the completion of the first exothermic peak. However, these phases disappeared after heating for 30 min at 1173 K and one can observe two equilibrium phases, i.e., hexagonal Ni6Nb7 phase with lattice parameters of a¼0:489andc¼ 2:66and hexagonal Ni9NbTi2 phase with lattice parameters
of a¼0:513nm and c¼0:421nm. The Ni9NbTi2 phase
appears to precipitate prior to Ni6Nb7 one. Moreover, the
equilibrium orthorhombic Ni11Nb3Ti6 phase with the lattice
parameters of a¼0:879nm, b¼1:187nm and c¼0:881
nm also precipitates at 1173 K.
Figure 3 shows the TEM structures of the HT1 sample and the sample annealed at 918 K for 15 min. The cubic Ni(Ti,Nb) particles have an equiaxed morphology with a diameter of about 100 nm while the Ni3Nb particles have a
rod-shaped morphology with a diameter of about 30 nm and a length of about 100 nm. The energy-dispersive X-ray (EDX) analysis of these particles gave a composition of Ni64Nb19Ti16 which can be regarded as a solid solution of
Nb in the NiTi phase substituting Ti.
Figure 4 shows the selected-area electron diffraction patterns (SAEDP)s of the equiaxed phase. The equiaxed phase in partially transformed to R33Ni4Ti3phase. SAEDPs
of the Ni3Nb rod-shaped phase is shown in Fig. 5. Formation
of R-phase is also possible.
3.2 Change of the thermal stability by the addition of noble-metals
Figure 6 shows the DSC curves of the amorphous Ni-based alloys containing 5 at% of Pd, Ag, Pt or Au. The glass transition temperature (Tg), crystallization temperature (Tx)
and supercooled liquid region (Tx¼TxTg) are shown in
Fig. 7. TheTxincreased to 64 K when the sample contains
5 at% Pt. In order to investigate the effect of Pt onTx, the Pt
[image:2.595.307.547.72.232.2]content was changed. Figure 8 shows DSC curves of the melt-spun Ni60xNb25Ti15Ptx(x¼07:5) glassy alloys. The Tg, Tx and Tx as a function of Pt content are shown in
Fig. 9. It is seen that the rise inTgandTxis proportional to Pt
content but the maximum ofTxof 64 K is attained at 5 at%
Pt. This alloy has slightly lowerTgand higherTx(see Fig. 9).
Exothermic(arbit.units)
Temperature,T/K
800 900 1000 1100
700 0.67K/s
(a)
25 40
15 30 45
Time, t/min
Exothermic(arbit.units)
874K
864K
20 35
(b)
Air cooling (HT1)
Ni60Nb25Ti15
Fig. 1 (a) DSC curve of Ni60Nb25Ti15 glassy alloy and (b) isothermal
calorimatry curves of Ni60Nb25Ti15glassy alloy at 874 K and 864 K.
as-q HT1 918K,15min 1000K,30min
30° 40° 50° 60° 70°
2θ
Intensity(arb.unit)
Ni60Nb25Ti15
80° 1173K,30min
Ni6Nb7
Ni9NbTi2
Ni3Nb Ni(Ti,Nb)
Fig. 2 XRD patterns of Ni60Nb25Ti15 glassy alloy heat-treated at some
temperatures. ‘‘as-q’’ means as-quenched, HT1 is heat treatment regime 1.
100nm
(a) (b)
Ni(Ti,Nb)
Ni3Nb
100nm
Fig. 3 Bright-field TEM image of the Ni60Nb25Ti15alloy. annealed by at
[image:2.595.74.263.72.403.2] [image:2.595.55.282.478.746.2]3.3 Formation of bulk glassy alloys
Figure 10 shows XRD patterns of Ni60xNb25Ti15Ptx
(x¼2:57:5) bulk samples with a diameter of 2 mm produced by copper mold casting. The XRD pattern of the sample containing 5 at%Pt consists only of a broad
diffrac-tion peaks indicating the formadiffrac-tion of an amorphous single phase. The peaks of Ni(Ti,Nb) phase are observed in the as-solidified rods containing 2.5 at%Pt and 4 at%Pt. A Ni55Nb25Ti15Pt5 bulk alloy rod of 3 mm in diameter was
[image:3.595.70.267.68.672.2]also produced but the structure was crystalline.
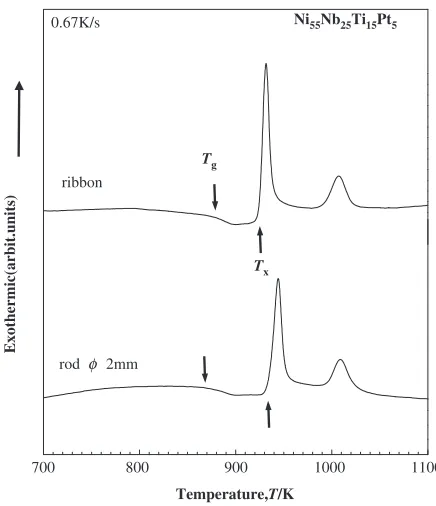
Figure 11 shows DSC curves of the Ni55Nb25Ti15Pt5alloy
rod with a diameter of 2 mm. TheTg,TxandTxare 875 K,
925 K and 50 K, respectively, and the total heat release upon devitrification of 55J/g is close to that of the ribbon sample.
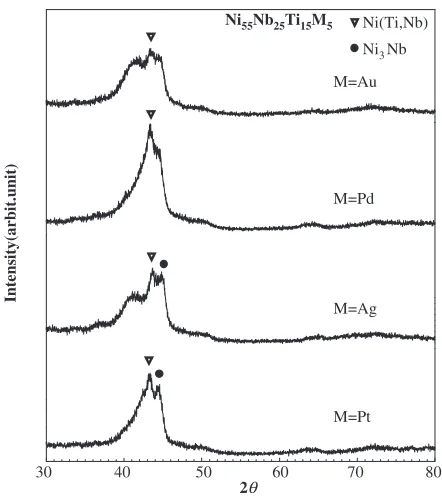
3.4 Devitrification of Ni-Nb-Ti-M alloys
The Ni55Nb25Ti15M5glassy alloys showed essentially the
same devitrification behavior as that of the Ni60Nb25Ti15
alloy, i.e. primary formation of the Ni(Ti,Nb) and Ni3Nb
phases (Fig. 12).
Thus, contrary to Cu-based alloys the addition of noble metals does not alter the devitrification behavior of the Ni-based alloys.
(000) (110) (a)
(101) _
(011) _
_
(c) (b)
(011)
(000) (011)
_ (020)
(120)
(000) _ (210)
(110) _
Fig. 4 Selected-area electron diffraction patterns of Ni (Ti,Nb) phase (a) [111], (b) [100], and Ni4Ti3phase (c) [001].
(000) (201)
(222) (021)
(000) (100) (102) (002) (a)
(b)
_
_ _
Fig. 5 Selected-area electron diffraction pattern of Ni3Nb phase. Zone
[image:3.595.323.529.72.479.2]4. Discussions
Both Ni(Ti,Nb) phase and Ni3Nb phase are observed in the
sample heat treated by HT1 regime (Fig. 2). These phases also exist after the completion of the first exothermic peak. It follows that the competitive nucleation and growth of these
two phases takes place from the supercooled liquid at the first exothermic reaction and the Ni(Ti,Nb) phase precipitates first.
Here one should notice that the Ni60Nb25Ti15glassy alloy
in as-solidified state does not have pre-existing nuclei (Fig. 13) Ni(Ti,Nb) and Ni3Nb phases transform to the
equilibrium Ni6Nb7, Ni9NbTi2 and Ni11Nb3Ti6 phases on
further heating. Cubic Ni(Ti,Nb) phase completely disap-peared upon heating for 30 min at 1173 K.
The Pt addition improves glass-forming ability (GFA) of the Ni60Nb25Ti15alloy. The bulk glassy samples obtained for
Ni55Nb25Ti15Pt5 alloy have a critical diameter of about
2.5 mm. This result is in good correlation with the largest
Tx which is obtained for the sample with the highest GFA
among the studied alloys. The reason may be connected with highly negative mixing enthalpy in liquid in Ti-Pt and Nb-Pt atomic pairs of 74 and 67kJ/mol, respectively. Ni-Pt atomic pair also has a negative mixing enthalpy of 5kJ/ mol. Moreover, Pt has an atomic size (0.137 nm) larger than that of Ni (0.125 nm). All these factors are favorable for improving glass-forming ability. Surprisingly Ni55Nb25
-Ti15Pt5alloy has slightly lowerTg=Tlratio (Fig. 9) compared
to some other Ni-Nb-Ti-Pt alloys. It indicates that for these alloys Tx is a better index of glass-forming ability than
Tg=Tlratio.
Contrary to the Cu-based alloys studied earlier15,16,18,19)the
addition of noble metals does not alter devitrification behavior of Ni-Nb-Ti alloys. Moreover, the addition of Ni to Cu-Zr-Ti system causes precipitation of the equilibrium (Ni,Cu)10Zr7 phase directly from the supercooled liquid at
more than 5 at% of Ni content17,18) (Ni10Zr7 phase forms
primarily in the Ni-Zr-Ti alloy on devitrification)19)and no
M=Ag
M=Ni M=Au
M=Pd M=Pt
700 800 900 1000 1100
Ni55Nb25Ti15M5
Exothermic(arbit.units)
Tx Tg 0.67K/s
Temperature, T/K
Fig. 6 DSC curves of Ni55Nb25Ti15M5(M=Pd, Ag, Pt, Au) glassy alloys.
Ni55Nb25Ti15M5
∆Tx=Tx-Tg
∆
Tx
/K
Ni Pd Ag Pt Au
M
0 20 40 60 80 800 840 880 920
Temperature,
T
/K
Tx
Tg 960
Fig. 7 Glass transition temperature (Tg), crystallization temperature (Tx) and supercooled liquid region (Tx¼TxTg) of Ni55Nb25Ti15M5
(M=Pd,Ag,Pt,Au) glassy alloys.
x=7.5
700 800 900 1000 1100
Ni60-xNb25Ti15Ptx
Temperature,T/K
Exothermic(arbit.units)
Tx Tg
x=6
x=5
x=4
x=2.5
x=0 0.67K/s
[image:4.595.60.278.70.318.2] [image:4.595.315.535.73.353.2] [image:4.595.64.277.372.649.2]formation of the icosahedral phase is observed in the Ni-Zr-Ti-Pd alloy.20)This is in consistent with the previous data that
the icosahedral phase is formed more readily in Zr-Cu alloys than in Zr-Ni ones.20,21)
5. Conclusions
(1) In the Ni60Nb25Ti15alloy, Ni(Ti,Nb) and Ni3Nb phases
precipitate primarily from the supercooled liquid by the competitive nucleation and growth. The former phase has a primitive cubic lattice with a lattice parameter of a¼ 0:293nm. It is a solid solution of Nb in a cubic NiTi phase. (2) Ni(Ti,Nb) and Ni3Nb phases are transform upon
further heating to the Ni6Nb7, Ni9NbTi2 and Ni11Nb3Ti6
phases. Ni4Ti3 phase was also formed as a result of
transformation of the Ni(Ti,Nb) cubic phase.
(3) The Pt addition improves glass-forming ability (GFA) of the Ni60Nb25Ti15 alloy. The Ni55Nb25Ti15Pt5 amorphous
alloy with the largest Tx has a critical diameter of about
2.5 mm. The reason may be connected with the highly negative mixing enthalpy in Ti-Pt and Nb-Pt atomic pairs.
Txis better index of the glass-firming ability of the
Ni-Nb-Ti-Pt alloys thanTg=Tlratio.
840 860 880 900 920 940 960
0 2 4 6 8 20
40 60 80
Pt content x/at%
∆
Tx
/K
Temperature /K
Ni60-xNb25Ti15Ptx Tg
0.55 0.60 0.65 0.70
Tg
/
Tl
(a)
(b)
(c)
Tx
Fig. 9 (a)Tg,Tx, (b)Txand (c)Tg=Tlas a function of Pt content for the Ni60xNb25Ti15Ptx(x¼0to 7.5) glassy alloys.
x=2.5
x=4
x=5
x=7.5
x=6
30° 40° 50° 60° 70°
2θ
Intensity(arb.unit)
Ni60-xNb25Ti15Ptx
φ=2mm
80° (a)
φ=3mm (b)
Ni(Ti,Nb)
?
?
?
?
? Ni3Nb
[image:5.595.72.269.73.445.2]Ni55Nb25Ti15Pt5
Fig. 10 X-ray diffraction patterns of Ni60xNb25Ti15Ptx (x¼2:5to 7.5) bulk samples with a diameters of 2 mm (a), and Ni55Nb25Ti15Pt5alloy rod
with a diameter of 3 mm (b).
ribbon
rod φ 2mm
Tx Tg
700 800 900 1000 1100
Exothermic(arbit.units)
Ni55Nb25Ti15Pt5 0.67K/s
Temperature,T/K
Fig. 11 DSC curves for Ni55Nb25Ti15Pt5 bulk alloy with a diameter of
[image:5.595.316.535.73.405.2] [image:5.595.316.534.494.747.2]Acknowledgements
This work was partially supported by the Grant-in-Aid of Ministry of Education, Sports, Culture, Science and Tech-nology, Japan, Priority Area on ‘‘Materials Science on Bulk Metallic Glasses’’.
REFERENCES
1) A. Inoue: Mater. Trans., JIM36(1995) 866. 2) A. Inoue: Acta Mater.48(2000) 279–306. 3) W. L. Johnson:MRS Bull24(1999) 42.
4) Y. C. Kim, W. T. Kim and D. H. Kim: Mater. Sci. Eng. A375–377 (2004) 127.
5) S. Yi, T. G. Park and D. H. Kim: J. Mater. Res.15(2000) 2425–2430. 6) J. K. Lee, S. H. Kim, S. Yi, W. T. Kim and D. H. Kim: J Non-Cryst
Solids291(2001) 132–136.
7) H. Choi-Yim, D. Xu and W. L. Johnson: Appl: Phys. Lett.82(2003) 1030.
8) T. Zhang and A. Inoue: Mater. Trans.43(2002) 708.
9) A. Inoue, W. Zhang and T. Zhang: Mater. Trans.43(2002) 1952. 10) W. Zhang and A. Inoue: Mater. Trans.43(2002) 2342–2345. 11) D. V. Louzguine and A. Inoue: Scr. Mater.48(2003) 1325. 12) D. V. Louzguine and A. Inoue: J. Alloys Compd.361(2003) 153. 13) A. Inoue, J. Saida, M. Matsushita and T. Sakurai: Mater. Trans.41
(2000) 362–365.
14) A. Inoue, T. Zhang, M. Matsushita, M. W. Chen and T. Sakurai: Mater. Trans., JIM40(1999) 1137–1143.
15) A. Inoue, T. Zhang, M. Matsushita, M. W. Chen and T. Sakurai: Mater. Trans., JIM40(1999) 1181–1184.
16) T. Zhang, T. Yamamoto and A. Inoue: Mater. Trans.43(2002) 3222. 17) D. V. Louzguine and A. Inoue: Mater. Sci. Forum/Journal of
Metastable & Nanocrystalline Materials,31(2003) 15–16. 18) D. V. Louzguine and A. Inoue: J. Non-Cryst. Solids325(2003) 187. 19) D. V. Louzguine and A. Inoue: J. Non-Cryst. Solids, in Press. 20) J. Saida, M. Matsushita and A. Inoue: Intermetallics10(2002) 1089–
1098.
21) M. Leonhardt, W. Lo¨ser and H.-G. Lindenkreuz: Acta Mater.47(1999) 2961–2968.
2θ
30 40 50 60 70
Intensity(arbit.unit)
M=Pt M=Ag M=Pd M=Au
80 Ni(Ti,Nb)
Ni3Nb
[image:6.595.58.279.69.317.2]Ni55Nb25Ti15M5
Fig. 12 XRD results of Ni55Nb25Ti15M5(M=Pt,Ag,Pd,Au) alloy annealed
at the first peak temperature (Tp) for 300 ks.
Fig. 13 High-resolution TEM image of the Ni60Nb25Ti15glassy alloy in
[image:6.595.342.512.72.293.2]
![Fig. 5Selected-area electron diffraction pattern of Ni3Nb phase. Zoneaxes (a) [010] and (b) [112].](https://thumb-us.123doks.com/thumbv2/123dok_us/356273.533448/3.595.323.529.72.479/fig-selected-area-electron-diraction-pattern-phase-zoneaxes.webp)