OPTIMIZATION OF BIODEGRADATION PROCESS OF RIVER WATER CONTAINING PHENOL USING
RESPONSE SURFACE METHODOLOGY BY
1,2
Ramendra Nautiyal,
1
Department of Biochemistry and Biotechnology, SBSPGI, Balawala, Dehradun
2Department of Chemistry, DAV (PG) College, Dehradun
ARTICLE INFO ABSTRACT
The biodegradation process was investigated using an isolated single bacterial culture of P
The P. putida
term of Chemical Oxygen Demand (COD showed that
parameters such as temperature (20 rate of biodegradation extent.
surface methodology (RSM), was used to create a set of 36 experimental runs needed for optimizing operating conditions.
methodology based on three
determine the significance and interaction effect of the variables on degradation. The optimal conditions of response were fo
giving an experimental degradation value of 80.07%. Very high regression coefficient between the variables and the response (R2 =
polynomial regression model.
Copyright©2016, Ramender Nautiyal.This is an open access article distributed under the Creative Commons Att distribution, and reproduction in any medium, provided the original work is properly cited.
INTRODUCTION
River water containing phenol (RWP) is considered as an emerging environmental problem due to their toxicity and chemical persistence in the environment. They can remain in the environment for a long time and their residence time is considered as dangerous at both low and high concentrations. It has been estimated that up to half of the wastewater produced worldwide is released without any treatment and components are difficult to destroy or decompose by common treatment in conventional wastewater treatment plants and discharged in to the river streams (Baughman and Weber
O’Neill et al., 2000). Hence, the treatment strategy
type of wastewater is under considerable pressure to efficiently and effectively treat the effluents discharged to the environment to comply with environmental legislation restricting the discharge of wastewater and to prevent deterioration of ecosystems. However, these techniques have shown limited success for the treatment of
the nature and composition of effluents. Therefore, other technologies have been explored with the aim to further reduce
*Corresponding author: Sanjay Gupta
Department of Biochemistry and Biotechnology, SBSPGI, Balawala, Dehradun.
ISSN: 0975-833X
Article History:
Received 14th September, 2016
Received in revised form 10th October, 2016
Accepted 17th November, 2016
Published online 30th December, 2016
Key words:
Biodegradation,
Psuedomonasputida, RSM,
CCD, Phenol.
Citation: Ramender Nautiyal, Prashant Singh and Sanjay Gupta
response surface methodology by psuedomonas putida (p. putida)
RESEARCH ARTICLE
OPTIMIZATION OF BIODEGRADATION PROCESS OF RIVER WATER CONTAINING PHENOL USING
RESPONSE SURFACE METHODOLOGY BY
PSUEDOMONAS PUTIDA (P. PUTIDA)
Ramendra Nautiyal,
2Prashant Singh and *
,1Sanjay Gupta
Department of Biochemistry and Biotechnology, SBSPGI, Balawala, Dehradun
Department of Chemistry, DAV (PG) College, Dehradun
ABSTRACT
The biodegradation process was investigated using an isolated single bacterial culture of P
P. putida was able to reduced 75-80% pollution load within 48 hrs under aerobic condition as
term of Chemical Oxygen Demand (COD) in River Water containing Phenol (RWP)). Obtained data showed that P. putida was potent bacterial culture for RWP treatment. The influence of three process parameters such as temperature (20-500C), pH (4-9) and agitation speed (30
rate of biodegradation extent. Central composite design (CCD), an experimental design for response surface methodology (RSM), was used to create a set of 36 experimental runs needed for optimizing operating conditions. The optimal degradation conditions were determined by response surface methodology based on three-variable central composite design to obtain maximum reduction and to determine the significance and interaction effect of the variables on degradation. The optimal conditions of response were found to be 35 0C, pH 8.05 and 120 rpm agitation speed, respectively, giving an experimental degradation value of 80.07%. Very high regression coefficient between the variables and the response (R2 = 0.6447) indicated a good evaluation of experimental data b polynomial regression model.
is an open access article distributed under the Creative Commons Attribution License, which distribution, and reproduction in any medium, provided the original work is properly cited.
is considered as an emerging environmental problem due to their toxicity and chemical persistence in the environment. They can remain in the environment for a long time and their residence time is idered as dangerous at both low and high concentrations. It wastewater produced worldwide is released without any treatment and the components are difficult to destroy or decompose by common al wastewater treatment plants and discharged in to the river streams (Baughman and Weber 1994; Hence, the treatment strategy for such type of wastewater is under considerable pressure to efficiently and effectively treat the effluents discharged to the environment to comply with environmental legislation restricting the discharge of wastewater and to prevent However, these techniques have d success for the treatment of wastewater due to the nature and composition of effluents. Therefore, other technologies have been explored with the aim to further reduce
Department of Biochemistry and Biotechnology, SBSPGI, Balawala,
the concentration of phenolic
These technologies include membrane separation, advanced oxidation technology, and electrochemical techniques such as electro-flotation and electro-coagulation. Electro
has shown the potential to largely overcome t conventional processing techniques.
environmental factors on microbial degradation of complex wastewater are usually examined with the conventional single
factor optimization (Parshetti et al
in which experiments were conducted by varying
systematically the studied parameter while keeping other parameters constant (Sedighi
repeated for all the parameters influencing degradation thus, resulting in an unreliable number of experiments. In addition, the combined effect of the effective influence parameters cannot be determined using this exhaustive procedure. Hence, a novel experimental design method such as the response surface methodology (RSM) which can est
linear interaction of the factors and predict a model for the response with a minimum number of experiments could be a useful tool for optimization of effective parameters of water containing phenol degradation. Here, we report
and identification of a phenol degrading bacterial culture. P. putida, capable of degradation of generated high pollution load
International Journal of Current Research Vol. 8, Issue, 12, pp.44217-44222, December, 2016
INTERNATIONAL
Ramender Nautiyal, Prashant Singh and Sanjay Gupta.2016. “Optimization of biodegradation process of river water containing phenol using
suedomonas putida (p. putida)”, International Journal of Current Research, 8, (12), 44217
OPTIMIZATION OF BIODEGRADATION PROCESS OF RIVER WATER CONTAINING PHENOL USING
PUTIDA (P. PUTIDA)
Sanjay Gupta
Department of Biochemistry and Biotechnology, SBSPGI, Balawala, Dehradun
Department of Chemistry, DAV (PG) College, Dehradun
The biodegradation process was investigated using an isolated single bacterial culture of P. putida. 80% pollution load within 48 hrs under aerobic condition as ) in River Water containing Phenol (RWP)). Obtained data treatment. The influence of three process 9) and agitation speed (30-150 rpm) influenced the
Central composite design (CCD), an experimental design for response surface methodology (RSM), was used to create a set of 36 experimental runs needed for optimizing
ere determined by response surface variable central composite design to obtain maximum reduction and to determine the significance and interaction effect of the variables on degradation. The optimal C, pH 8.05 and 120 rpm agitation speed, respectively, giving an experimental degradation value of 80.07%. Very high regression coefficient between the ) indicated a good evaluation of experimental data by
ribution License, which permits unrestricted use,
the concentration of phenolic contaminants in wastewaters. These technologies include membrane separation, advanced oxidation technology, and electrochemical techniques such as coagulation. Electro-coagulation has shown the potential to largely overcome the drawbacks of conventional processing techniques. Until now, the effects of environmental factors on microbial degradation of complex ually examined with the conventional
single-et al., 2006; Khataee et al., 2009)
in which experiments were conducted by varying
systematically the studied parameter while keeping other
parameters constant (Sedighi et al . 2009). This is usually
repeated for all the parameters influencing degradation thus, number of experiments. In addition, the combined effect of the effective influence parameters cannot be determined using this exhaustive procedure. Hence, a novel experimental design method such as the response surface methodology (RSM) which can estimate quadratic effects and linear interaction of the factors and predict a model for the response with a minimum number of experiments could be a useful tool for optimization of effective parameters of water containing phenol degradation. Here, we report the isolation and identification of a phenol degrading bacterial culture. P. putida, capable of degradation of generated high pollution load
INTERNATIONAL JOURNAL OF CURRENT RESEARCH
in a aerobic process. There are almost no reports on the
biodegradation of phenol by P. putida and hence, it was
significant to develop this new microbial procees in bioremediation. The effect of process parameters for degradation was determined by an optimized condition using the Response surface methodology (RSM) based on central composite design (CCD).
MATERIALS AND METHODS
Sample collection area and its preservation
Water samples of river Gola were collected in Tarson bottles previously rinsed with non-ionic detergent, rinsed with tap water and later leached with 10% nitric acid for 24 hours and finally rinsed with deionised water prior to use. This process has importance because certain metal ions like chromium, cadmium, lead are subject to loss or adsorption or ion exchange with walls of container. Before sample collection these bottles were rinsed with the sample. All the samples after maintaining in cold chain were brought to the laboratory to store in sampling box at 4°C.
Culture media, strain isolation and characterization
Nutrient Agar Media and Tris Minimal Salt Media were used for the isolation. Further, the shake flask studies were conducted using river wastewater supplemented with minimal mineral media. The soil samples for the isolation of the microorganisms were collected in the sterilized zip lock polybags to prevent environmental contamination. The samples were immediately transported to the lab and maintained below
4oC, till their utilization. For isolation of microbes serial
dilution method was adopted; 1 g of contaminated soil sample was inoculated in a 250 mL Erlenmeyer flask containing 100 mL of nutrient broth medium and spread in Nutrient Agar
Media at 370C in 24 hrs. isolates were identified by
biochemical characterization and bacterial growth kinetics. The organism was used for subsequent treatment and optimization studies.
Treatment of river water by Psuedomonas putida (P. putida)
The treatment capability of P. putida was determined using
river water (100 ml/l) in minimal salt media. Bacterial culture
was inoculated in pre-autoclaved minimal salt media (107
cfu/ml approximate cell density, pH-7.2) and incubated 350C
for 48 hours under shaking condition. Using the above performance parameters aerobic bacteria was encourage to decrease the high pollution load in 48 hours incubation time and determine the equilibrium time required for maximum treatment of RWP. Control consists of river water and minimal salt media without bacterial culture. Further experiment were performed to determine the effect of incubation temperature, pH and agitation speed condition on river water treatment by
varying the incubation temperature (20–450C), medium pH (5–
9) and shaking condition (50–150 rpm), while keeping other conditions constant. The pH of the MSM solution was adjusted using 0.1 M HCl or 0.1 M NaOH. All the experiments were performed in triplicates.
Optimization of treatment conditions by response surface methodology
RSM is a collection of mathematical and numerical techniques that are useful for modelling and analysis of the processes
having numerous variables influencing the response and the objective is to optimize process settings in an efficient use of
the resources (Sharma et al., 2009). It can be used for
predicting the functional relationship between a set of experimental design variables and a response variable. The RSM approach was applied to determine the optimal levels of three input variables, namely temperature (factor A), pH (factor B), incubation time (factor C) and agitation speed (factor D) and to identify the relationship between the response functions and process variables. Design Expert 8.0.2 software was used to analyze the obtained results. The values used were based on results of preliminary experiments carried out to determine range of values of parameters for effective treatment. For four variables (n = 3) and five levels [low (-) and high (+)], the total number of experiments was 36 determined by the expression:
2n (23 = 8 factorial points in triplicates) + 2n (2×3 = 6 axial
[image:2.595.312.551.287.635.2]points) + 6 (center points: six replications) as given in Table 1.
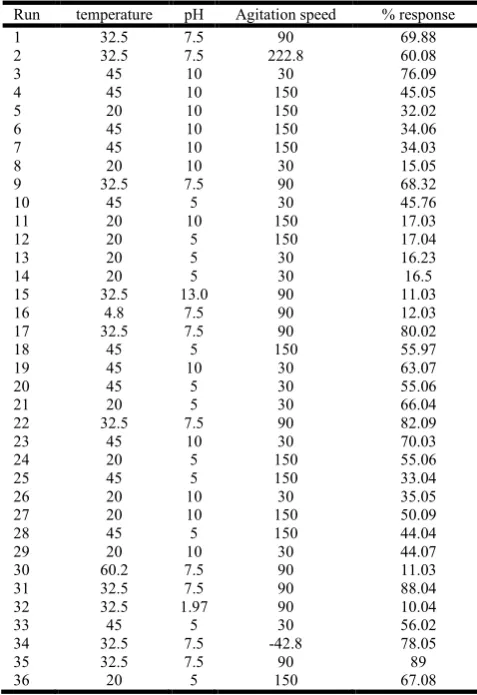
Table 1. Observed and predicted values of RWP treatment by P.
putida using of RSM
Run temperature pH Agitation speed % response
1 32.5 7.5 90 69.88
2 32.5 7.5 222.8 60.08
3 45 10 30 76.09
4 45 10 150 45.05
5 20 10 150 32.02
6 45 10 150 34.06
7 45 10 150 34.03
8 20 10 30 15.05
9 32.5 7.5 90 68.32
10 45 5 30 45.76
11 20 10 150 17.03
12 20 5 150 17.04
13 20 5 30 16.23
14 20 5 30 16.5
15 32.5 13.0 90 11.03
16 4.8 7.5 90 12.03
17 32.5 7.5 90 80.02
18 45 5 150 55.97
19 45 10 30 63.07
20 45 5 30 55.06
21 20 5 30 66.04
22 32.5 7.5 90 82.09
23 45 10 30 70.03
24 20 5 150 55.06
25 45 5 150 33.04
26 20 10 30 35.05
27 20 10 150 50.09
28 45 5 150 44.04
29 20 10 30 44.07
30 60.2 7.5 90 11.03
31 32.5 7.5 90 88.04
32 32.5 1.97 90 10.04
33 45 5 30 56.02
34 32.5 7.5 -42.8 78.05
35 32.5 7.5 90 89
36 20 5 150 67.08
RWP treatment was selected as the response for the combination of the independent variables. Randomised experimental runs were performed to reduce to the barest minimum the effects of unexpected variability in the observed responses (Montgomery 2004). Design Expert 8.0.7.1 software was used to analyze the obtained results. For statistical analysis, a quadratic polynomial equation by central composite design was developed to predict the response as a function of independent variables and their interaction. In general, the response for the quadratic polynomials is described below:
Y = β0 + £βixi + £βiixi2 + ££ βijxijxj ... (1)
where Y is the response (COD reduction); β0 is the intercept
βij is the interaction terms, and xi and xj are the uncoded independent variables (Ghadge and Raheman 2006). Data from the central composite experimental design were subjected to regression analysis using least square regression methodology to obtain the parameters of the mathematical models.
The F test was then used to evaluate the significance of the model equation and model terms. The statistical significance of the model was evaluated using the analysis of variance (ANOVA) while, the optimal values were obtained by solving the regression equation and analyzing the response surface plot.
Analytical method for Chemical Oxygen Demand
Determination
Original and treated samples were measured by monitoring as per APHA guidelines for waste water. COD vials and caps
were rinsed with 20% H2SO4 to prevent contamination. 2.5 ml
of the sample was added to the COD vial and for blank 2.5 ml distilled water was added to the COD vial and then 1.5 ml of digestion solution was added to each COD vials. 3.5 ml sulphuric acid reagent was added in the same manner. At this time caution should be taken because COD vials are hot now. COD vials was then placed in COD digester and heated at 150°C for 2 hrs. After digestion the vials was allowed to cool at the room temperature in test tube rack. After cooling, the content of the vials was transferred to conical flask. 1 to 2 drops ferroin indicator was then added in conical flask containing sample. The solution was titrated against the Mohr’s salt and the titer volume required for the color change from blue-green to reddish brown was noted. The procedure was repeated for blank titration.
Calculation
COD (mg/L) = [(B-A) ×N×8000] / V ... (2)
Where: B = volume of titrant used against blank, A = volume of titrant used against sample
N = normality of FAS, V= volume of the sample
RESULT AND DISCUSSION
Reduction Capabilities and growth kinetic study of Bacterial Strains for River water containing phenol
The six bacterial cultures showing maximum growth capability in river water was selected.
Time course study was done for the isolated strains among
them, Psuedomonas putida (P. putida) showed the maximum
degradation capability. Further, to determine the growth and multiplication of bacterial cells, the highest cell numbers were observed after 24h of incubation and this corresponds to the
late log phase/early stationary phase of Psuedomonas putida
[image:3.595.308.559.148.286.2]growth cycle.
[image:3.595.326.543.319.483.2]Fig. 1. Time interval study of growth kinetics of different isolated bacterial culture in Minimal salt media (MSM)
Figure 2. Effect of process parameters (pH, incubation temperature and agitation speed) on percentage reduction of
RWP by P. putida under 48 h incubation time
It has been observed that maximum degradation capability occurs in the initial stage of the stationary phase which corresponds to the maximum numbers of the viable cells of bacteria in growth media. Fig.1 showed the adaptation period
of 15 hours for the bacterial strain Psuedomonas putida with
the wastewater supplemented media, followed by a rapid
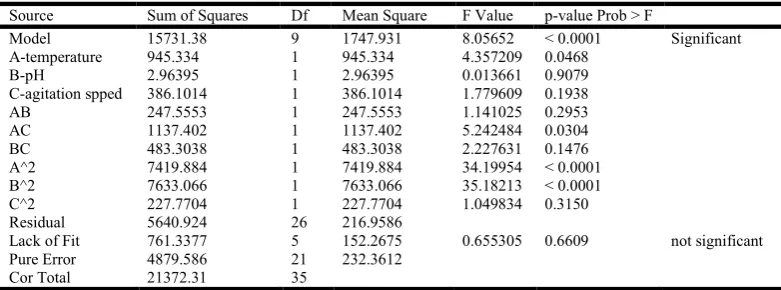
Table 2. ANOVA analyses for the response surface quadratic model
Source Sum of Squares Df Mean Square F Value p-value Prob > F
Model 15731.38 9 1747.931 8.05652 < 0.0001 Significant
A-temperature 945.334 1 945.334 4.357209 0.0468
B-pH 2.96395 1 2.96395 0.013661 0.9079
C-agitation spped 386.1014 1 386.1014 1.779609 0.1938
AB 247.5553 1 247.5553 1.141025 0.2953
AC 1137.402 1 1137.402 5.242484 0.0304
BC 483.3038 1 483.3038 2.227631 0.1476
A^2 7419.884 1 7419.884 34.19954 < 0.0001
B^2 7633.066 1 7633.066 35.18213 < 0.0001
C^2 227.7704 1 227.7704 1.049834 0.3150
Residual 5640.924 26 216.9586
Lack of Fit 761.3377 5 152.2675 0.655305 0.6609 not significant
Pure Error 4879.586 21 232.3612
[image:3.595.104.495.635.780.2]growth period of 15-22 hours and consequently showed the decline phase after 35 hours of culture growth. The results showed a typical bacterial growth curve corresponding to the physiology of the bacterial growth kinetics. The
Psuedomonas putida along with the other strains procured
from MTCC was further subjected to the optimization studies under different nutritional parameters to observe the enhanced
reduction capability of the strains.
Optimization of process parameter for Reduction of River
water containing phenol by Psuedomonas putida
Data obtained on effect of three process parameters on
degradation potential of Psuedomonas putida are as presented
[image:4.595.54.546.59.642.2]in Fig. 2
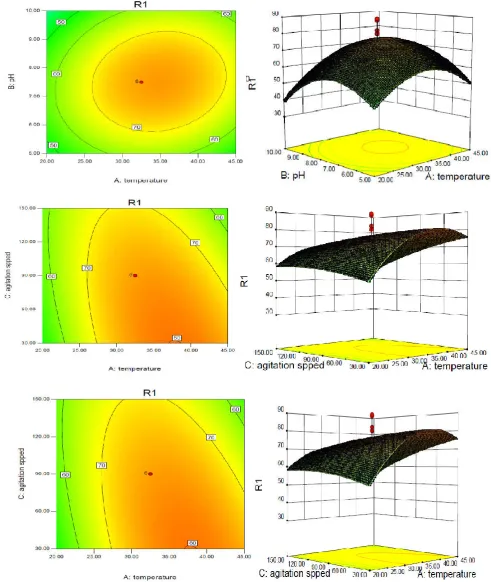
Fig 3. a Contour plot and 3-D surface showing degerdation extent as a function of temperature and pH (Actual factor B: pH = 8.02). b Contour plot and 3-D surface showing degerdation extent as a function of temperature and agitation speed (Actual factor C: agitation
Optimization of River Water containing Phenol treatment Process using Response Surface Methodology
A total of 36 experiments with different combinations of
temperature (factor A, 20–450C), pH (factor B, 7.5–10) and
(factor C, 90-150 rpm) were performed within 48 h using the CCD method. RWP treatment was used as the response (R, %) and the results obtained from the experiments (observed and predicted) are summarized in Table. By applying multiple regression analysis, the following second-order polynomial equation (in coded units) that could relate degradation of RWP to the parameters studied was obtained as Eq. (3).
R1 = +76.58 +5.29 A -0.30B -3.38 C +3.21 AB -6.88 AC - 4.49 BC-14.24 A2 -14.44 B2 -2.49 C2 ……….(3)
From the Eq. (2) above, the second-order response functions are represented by: R, the response for RWP treatment; A, the coded value of variable incubation temperature; B, the coded value of variable pH and C, the coded value of variable agitation speed (rpm). Data obtained on predicted values and observed values show the empirical models actually fit the
actual data with R2 of 0.9624. When R2 is closer to unity as
obtained in this study, the empirical models fit the actual data better whereas, the relevance of the dependent variables in the model in explaining the behaviour of variations cannot be
ascertained by a smaller value of R2 (Cao et al., 2008). Table 2
shows the data obtained from the analysis of variance (ANOVA) for the response surface reduced quadratic model. The Model F-value of 8.06 implies the model is significant. There is only a 0.01% chance that a "Model F-Value" this large could occur due to noise Values of "Prob > F" less than 0.0500 indicate In Values greater than 0.1000 indicate the model terms
are not significant this case A, AC, A2, B2 are significant model
terms If model reduction may improve your model. there are many insignificant model terms (not counting those required to support hierarchy), model terms are significant The "Lack of Fit F-value" of 0.66 implies the Lack of Fit is not significant relative to the pure error. There is a 66.09% chance that a "Lack of Fit F-value" this large could occur due to noise. Non-significant lack of fit is good -- we want the model to fit. The "Pred R-Squared" of 0.4767 is in reasonable agreement with the "Adj R-Squared" of 0.6447. "Adeq Precision" measures the signal to noise ratio. A ratio greater than 4 is desirable. Your ratio of 10.494 indicates an adequate signal.
This model can be used to navigate the design space. The choices for level combinations of the three variables such as, temperature, pH and agitation speed were made into contour plots (Fig. 3 a–c) which indicated the percentages of reduction within 48 h of incubation. The behavior of percentage reduction with respect to changes in temperature and pH is shown in Fig. a. These two parameters showed positive influence on RWP treatment. The percentage reduction increased with increase in temperature and pH until a certain level where further increases in both parameters led to a decrease in percentage reduction. In Fig. b, the variation of percentage degredation as specified by the variables, pH and temperature shows that with the increase in pH, the percentage reduction decreased. The result shows that optimal percentage
reduction of RWP was between 35 and 400C and slightly above
basicity of pH. Three dimensional and contour plots for interaction effect of reaction pH and agitation speed toward RWP reduction are shown in Fig. C. RWP reduction increased as the pH increased to its medium level (pH 8) and agitation
speed increased to its central level (100 rpm). Optimal reduction of RWP was obtained in culture broth of pH 8 and 100 rpm agitation speed. Generally, a stronger influence of pH and agitation speed occurred when both parameters were at their median level. The decreasing the reduction of RWP at higher agitation and pH were probably as a result of increasing toxicity of the RWP to the microbial cells inactivation at such
high concentrations (Ogawa et al., 1989). In each contour plot,
the other one variable was held constant. Generally, increase in the three process parameters to a certain threshold value resulted in increase in percentage reduction of RWP by
Psuedomonas putida. This is due to the positive quadratic
model as shown in Eq. 2. It also indicates that the experimental value must consider the running effect of these significant factors at the stipulated levels to maximize reduction of RWP
by Psuedomonas putida (Mohana et al., 2008; Lau and Ismail
2010).
Conclusion
In this research work, treatment of RWP by Psuedomonas
putida was investigated by CCD using RSM by varying three
control factor such as temperature, pH and agitation speed. The function of these factors in terms of optiPmization of process parameter and its treatment operation was well explained by the results obtained from RSM. By applying the RSM design to the optimization experiments, the process variables were well studied and reduction effciency extent up to 88 % was achieved in a shorter time (24 h). The experimental and the predicted values were very similar which reflected the accuracy and the applicability of RSM. Efficient
RWP treatment by Psuedomonas putida suggests its potential
for real industrial applications in treatment of RWP.
REFERENCES
Amin A, Naik ATR, Azhar M, Nayak H. 2013. Bioremediation of different waste waters – a review. Cont J Fish Aquat Sci 7(2):7-17.
Baughman GL, Weber EJ. 1994. Transformation of dyes and related compounds in anoxic sediment: kinetics and products. Environ Sci Technol 28:267–276.
Cao W, Zhang C, Hong P, Ji H. 2008. Response surface methodology for autolysis parameters optimization of shrimp head and amino acids released during autolysis. Food Chem 109:176–183.
Choudhary S, Parmar N 2013. Hazard assessment of liquid effluent treatment plant in pharmaceutical industry. VSRD Int J Technol NonTechnol Res 4(9):209-214.
Damodhar U, Reddy MV 2013. Impact of pharmaceutical industry treated effluents on the water quality of river Uppanar, South east coast of India: a case study. Appl Water Sci 3(2):501-514.
Das MP, Bashwant M, Kumar K, Das J (2012) Control of
pharmaceutical effluent parameters through
bioremediation. J Chem Pharm Res 4(2):1061-1065. Deegan AM, Shaik B, Nolan K, Urell K, Oelgemöller M,
Tobin J, Morrissey A (2011) Treatment options for wastewater effluents from pharmaceutical companies. Int J Environ Sci Technol 8(3):649-666.
El-Gohary FA, Abou-Elela SI, Aly HI (1995) Evaluation of biological technologies for wastewater treatment in the pharmaceutical industry Water Sci Technol 32(11):13-20. Enright AM, McHugh S, Collins G, O’Flaherty V (2005)
Low-temperature anaerobic biological treatment of solvent
containing pharmaceutical wastewater. Water Res
39(19):4587-96.
Farhadi S, Aminzadeh B, Torabian A, Khatibikamal V, Fard MA (2012) Comparison of COD removal from
pharmaceutical wastewater by electrocoagulation,
photoelectrocoagulation, peroxi-electrocoagulation and
peroxi-photoelectrocoagulation processes. J Hazard Mater 219- 220:35-42.
Ghadge SV, Raheman H (2006) Process optimization for biodiesel production from mahua (Madhuca indica) oil using response surface methodology. Bioresour Technol 97:379–384.
Ghosh M, Verma SC, Mengoni A, Tripathi AK (2004) Enrichment and identification of bacteria capable of reducing chemical oxygen demand of anaerobically treated spent wash. J Appl Microbiol 6:241-78.
Gome A, Upadhyay K (2013) Biodegradability assessment of pharmaceutical wastewater treated by ozone. Int Res J Environ Sci 2(4):21-25.
Heberer T (2002) Occurrence, fate and removal of pharmaceutical residues in the aquatic environment: a review of recent research data. Toxicol Lett 131(1-2):5-17. Idris MA, Kolo BG, Garba ST, Ismail MA (2013)
Physico-chemical analysis of
Ileri R, Sengil IA, Kulac S, Damar Y (2003) Treatment of mixed pharmaceutical industry and domestic wastewater by sequencing batch reactor. J Environ Sci Health A38(10):2101-2111.
Imran H (2005) Wastewater monitoring of pharmaceutical industry: treatment and reuse options. Electron J Environ Agric Food Chem 4(4):994-1004.
Kaushik KA, Dalal SJ, Panwar S (2012) Impact of industrialization on culture of Uttarakhand and its role on career enhancement. VSRD Int J Bus Manage Res 2(4):123-132.
Kavitha RV, Murthy VK, Makam R, Asith KA (2012)
Physico-Chemical analysis of effluents from
pharmaceutical industry and its efficiency study. Int J Eng Res Appl 2(2):103- 110.
Khan MZH, Mostafa MG (2011) Aerobic treatment of pharmaceutical wastewater in a biological reactor. Int J Environ Sci 1(7):1797-1805.
Khataee AR, Ayazloo M, Pourhassan M (2009) Biological decolorization of C.I. Basic Green 4 solution by Chlorella sp.: effect of operational parameters. Chin J Appl Environ Biol 15:110–114.
Lau W, Ismail A (2010) Application of response surface methodology in pes/speek blend NF membrane for dyeing solution treatment. Membr Water Treat 1:49–60
Mohana S, Shrivastava S, Divecha J, Madamwar D (2008) Response surface methodology for optimization of medium for decolorization of textile dye Direct Black 22 by a novel bacterial consortium. Bioresour Technol 99:562–569. Montgomery DC (2004) Design and analysis of experiments,
5th edn. Wiley and Sons, Singapore.
O’Neill C, Lopez A, Esteves S, Hawkes FR, Hawkes DL, Wilcox S (2000) Azo-dye degradation in an anaerobic-aerobic treatment system operating on simulated textile effluent. Appl Environ Microbiol 53:249–254
Parshetti G, Kalme S, Saratale G, Govindwar S (2006) Biodegradation of Malachite Green by Kocuria rosea MTCC 1532. Acta Chim Slov 53:492–498
pharmaceutical effluent and surface water of river Gorax in Minna, Niger State, Nigeria. Bull Env Pharmacol Life Sci 2(3):45-49.
Sedighi M, Karimi A, Vahabzadeh F (2009) Involvement of Ligninolytic Enzymes of Phanerochaete chrysosporium in treating the textile effluent containing Astrazon Red FBL in a packed-bed bioreactor. J Hazard Mater 169:88–93. Sharma P, Singh L, Dilbaghi N (2009) Optimization of
process variables for decolorization of Disperse Yellow 211 by Bacillus subtilis using Box–Behnken design. J Hazard Mater 164:1024–1029.