This content has been downloaded from IOPscience. Please scroll down to see the full text.
Download details:
IP Address: 138.251.14.57
This content was downloaded on 17/01/2014 at 15:06
Please note that terms and conditions apply.
Coherence dynamics and quantum-to-classical crossover in an exciton–cavity system in the
quantum strong coupling regime
View the table of contents for this issue, or go to the journal homepage for more 2013 New J. Phys. 15 045013
crossover in an exciton–cavity system in the
quantum strong coupling regime
J Kasprzak1,5, K Sivalertporn2, F Albert3, C Schneider3, S H ¨ofling3, M Kamp3, A Forchel3, S Reitzenstein3,4, E A Muljarov2,6 and W Langbein2
1Institut N´eel, CNRS, BP 166, F-38042 Grenoble Cedex 9, France 2School of Physics and Astronomy, Cardiff University, The Parade, CF24 3AA Cardiff, UK
3Technische Physik, Physikalisches Institut, and Wilhelm Conrad R¨ontgen Research Center for Complex Material Systems, Universit¨at W¨urzburg, Am Hubland, D-97074 W¨urzburg, Germany
4Institut f¨ur Festk¨orperphysik, Technische Universit¨at Berlin, Hardenbergstrasse 36, D-10623 Berlin, Germany
E-mail:[email protected]
New Journal of Physics15(2013) 045013 (16pp)
Received 17 December 2012 Published 22 April 2013 Online athttp://www.njp.org/ doi:10.1088/1367-2630/15/4/045013
Abstract. Interaction between light and matter generates optical nonlinearities, which are particularly pronounced in the quantum strong coupling regime. When a single bosonic mode couples to a single fermionic mode, a Jaynes–Cummings (JC) ladder is formed, which we realize here using cavity photons and quantum dot excitons. We measure and model the coherent anharmonic response of this strongly coupled exciton–cavity system at resonance. Injecting two photons into the cavity, we demonstrate a √2 larger polariton splitting with respect to the vacuum Rabi splitting. This is achieved using coherent nonlinear spectroscopy, specifically four-wave mixing, where the coherence between the ground state and the first (second) rung of the JC ladder can be interrogated for positive
5Author to whom any correspondence should be addressed. 6On leave from General Physics Institute RAS, Moscow, Russia.
Content from this work may be used under the terms of theCreative Commons Attribution 3.0 licence. Any further distribution of this work must maintain attribution to the author(s) and the title of the work, journal citation and DOI.
(negative) delays. With increasing excitation intensity and thus rising average number of injected photons, we observe spectral signatures of the quantum-to-classical crossover of the strong coupling regime.
Contents
1. Introduction 2
2. The investigated sample and photoluminescence characterization 3
3. Accessing the first two rungs of the Jaynes–Cummings ladder via four-wave mixing 6
4. Four-wave mixing results 8
4.1. Detuning dependence of four-wave mixing. . . 8 4.2. Coherent dynamics on the first and the second rung of the Jaynes–Cummings
ladder . . . 9 4.3. Quantum-to-classical crossover of the strong coupling. . . 11
5. Conclusion 14
Acknowledgments 15
References 15
1. Introduction
Milestone achievements in cavity quantum electrodynamics (cQED) have just been awarded with the Nobel Prize in Physics 2012 (Serge Haroche and David J Wineland, ‘for ground-breaking experimental methods that enable measuring and manipulation of individual quantum systems’). The underlying experiments were performed on individual atomic systems exploring light–matter interaction on a quantum level [1], and pushed the boundaries of our understanding of quantum mechanics, for instance by introducing quantum non-demolition measurements [2, 3]. cQED effects can now be observed also in solid state systems, which owing to their intrinsic stability are better suited for scalable technology and commercialization. The highest cooperativity is achieved in superconductive circuits working at microwave frequencies and milli-kelvin temperatures, consisting of Josephson junctions coupled to a waveguide resonator [4]. To work at optical frequencies compatible with optical fibre communication, one can employ individual optical transitions in semiconductor nanostructures—such as excitons in quantum dots (QDs)—which are coupled to the electromagnetic field of a micro-cavity. These systems operate at present in a temperature range of 10 K and have 3–6 orders of magnitude lower volume than superconductive circuits.
In the strong coupling regime of light and matter, excitation is reversibly and coherently exchanged between photonic modes and matter. Such a temporal ‘ping-pong’ corresponds to the formation of hybrid eigenstates called polaritons [5]. Strong coupling was first observed for large ensembles of matter states [6–8] within an optical resonator. The experimental evidence for strong coupling and polariton formation is a spectral anti-crossing when the relative frequencies of light and matter modes are tuned, with a vacuum Rabi splittingat resonance, related to the oscillation period of exchange between light and matter of 2π/.
dissipation, it constitutes an effective fermionic mode. In this case a Jaynes–Cummings (JC) ladder of states forms, with a splitting of√nof thenth rung of the ladder carryingnexcitation quanta. The period of the temporal oscillation is accordingly 2π/(√n)and shortens in discrete steps, so that going fromn=1 to 2 the period is reduced by a factor of√2. The discrete change of the splitting is a principal and profound result of cQED described by the JC Hamiltonian [9] and is a signature of the quantum strong coupling regime (QSC). This manifestation of QSC was first observed in atomic physics [1] and recently demonstrated in superconducting qubits strongly coupled to waveguide resonators [4, 10], where a large splitting to linewidth ratio of 260 allowed to observe up to six rungs of the ladder. Both the experiments used photonic modes in the microwave frequency range.
Solid state systems in the optical frequency regime showing QSC are at present employing semiconductor quantum dots embedded in optical cavities formed by the host semiconductor, such as photonic crystal cavities [11–13], microdiscs [14] or micropillars [15, 16]. These systems exhibit at present a modest splitting to linewidth ratio of around 2, and the spectroscopic discrimination of the discrete splitting steps is not obvious. The QSC regime was therefore indirectly demonstrated using the intensity correlation of the resonant reflection, showing a photon blockade or photon bunching [12] and single-photon switching [13]. The spectral splitting was measured directly using coherent nonlinear spectroscopy [17], specifically four-wave mixing (FWM) to probe the coherence dynamics in the first two rungs of the JC ladder [16, 18]. Recently, this technique also enabled to demonstrate the photon-mediated coherent coupling of several quantum dots in the framework of the Tavis–Cummings model [19].
In this work, we extend the investigation of the coherent response of a micropillar cavity in the QSC regime with an embedded QD reported in [16, 18]. An improved dynamic range of the data as well as a slightly better splitting to linewidth ratio of the investigated structure allowed us to retrieve the entire beat of the second rung coherence, displaying a √2 shorter period—hence√2 larger polariton splitting—with respect to the first rung. The measurements are in quantitative agreement with predictions of the FWM response based on the master equation for the density matrix of the JC ladder truncated at the second rung. Further to this, we show a continuous detuning dependence of the FWM. In the temporal domain, a continuous evolution of the beat period with a maximum at zero detuning is found. In the spectral domain, the second rung contributions lead to an apparent crossing and mixing of the transitions, while after temporal filtering, which is used in order to suppress the second rung contributions, the underlying anti-crossing can be observed. We also report on the evolution of the response with increasing average photon numberninjected into the cavity mode, showing a transition from the vacuum Rabi splitting towards a semi-classical regime. In particular, with growing excitation intensity, the FWM spectra display progressively increasing influence of transitions between higher rungs of the JC ladder, yielding for large na spectral FWM lineshape akin to a Mollow triplet.
2. The investigated sample and photoluminescence characterization
X C
M1+
M
M1+
M
1-1330.6 1330.8 1331.0 30
20 10
fitted energy (meV)
detuning
δ
(
μ
eV)
c)
fitted linewidth (μeV)
photon energy (meV)
T
(K)
a)
0 10 20 30 40 50
-147
-96
+3
+147
b)
+297
1330.6 1330.8 1331.0
[image:5.595.81.530.87.297.2]~ ~
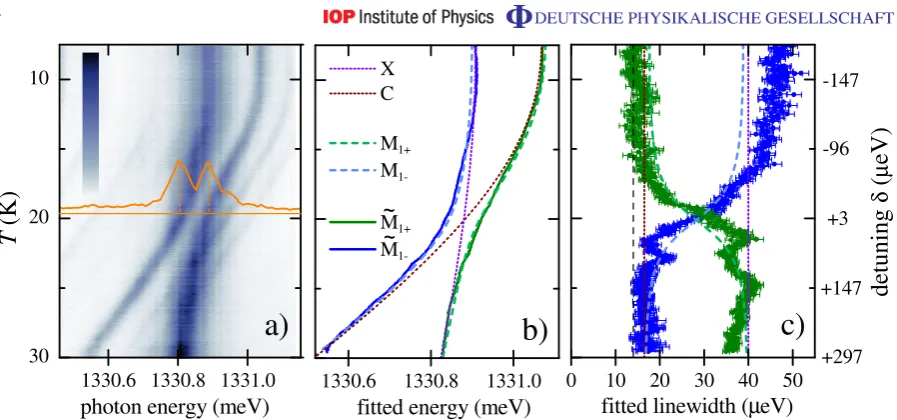
Figure 1.(a)µPL excited and collected through the top facet of the micropillar, as a function of the sample temperature. Spectral intensity on a linear colour scale from white (zero) to blue, as given. An avoided crossing between the cavity mode C and the exciton X in a QD with a Rabi splitting of=78µeV is observed at T ∼19 K. TheµPL spectrum at this temperature is shown with baseline (orange lines). (b) Fitted spectral positions of polaritons in the first rung of the JC ladder
˜
M1+ and M˜1− (solid green and blue lines), the resulting uncoupled states C and X (dotted violet and brown lines) and coupled states M1+and M1−(dashed blue and green lines). (c) Fitted linewidth (HWHM) of M˜1+ (green) and M˜1− (blue) and the resulting linewidths of M1+, M1−, C and X using line colours and styles as in (b). The black dashed line shows spectral resolution of the measurements.
high-resolution electron beam lithography and electron cyclotron etching [20]. Fields of 6×6 micropillars of nominally equal diameter varying between 1.5 and 2.0µm were realized. Such fields are separated by 50µm in the x- and y-directions, corresponding to the [ 1 1 0 ] and [11 0] crystallographic directions of the GaAs substrate, respectively. Each micropillar was¯ accompanied by a reference pillar of 10µm diameter at 10µm distance, which was used to reflect the reference beam in the FWM experiment.
The sample was mounted on an x–y stage in a helium bath cryostat, together with a microscope objective of 0.85 numerical aperture which was adjustable in all three dimensions by a home-built stage with piezoelectric bender actuators. To identify micropillars in the strong coupling regime, we characterized them with confocal micro-photoluminescence (µPL) excited by a continuous wave laser of 532 nm wavelength, focused to a spot of about 0.5µm full-width at half maximum (FWHM) on the top surface of the micropillar. The micropillar presented in this work was selected for high cooperativity given by the Rabi splitting to linewidth ratio. The latter crucially depends on aQ-factor of the fundamental cavity mode, which was around 21 000, corresponding to a photon lifetime of aboutτC=10.5 ps in its mode volume of approximately 0.3µm3. The polariton polarization decay time is therefore governed by the radiative emission and at resonance isT2=2T1=4τC=42 ps.
Table 1. Parameters of the exciton-cavity system deduced from a fit to the temperature-dependent photoluminescence spectra.
Parameter Value Unit ¯
hωX(0) 1331.070 meV
¯
hωC(0) 1330.909 meV
¯
hg 39 µeV
¯
hγX 16.5 µeV
¯
hγC 40 µeV
α 58.05±0.6 µeV K−1
θ 59.31±0.4 K
η 0.153297
power at the micropillar was about 100 nW. At lower powers the PL spectrum remained essentially unchanged, while at higher powers line broadening and reduction of the Rabi splitting were observed. The PL spectrum at each temperature was fitted by a sum of two Lorentzian lines. The resulting line positions as a function of temperature show an anti-crossing (figure1(b)) and exchange of linewidths (figure1(c)). The pillar contains other QDs with weakly coupled excitons, which show a crossing with the strongly coupled doublet, perturbing the lineshape of the doublet by the Purcell-enhanced emission into the doublet, which for example around 23 K gives a perturbation in the fitted peak position and linewidth. The non-resonant weakly coupled QD excitons show a common temperature-dependent shift F(T)which can be fitted within an explicit model of the band-gap shift of semiconductors [21]
F(T)= −αθ 2
coth
θ
2T
−1
(1) using the parameters given in table1. We assume that the cavity modeωChas the same shift as the excitonωXbut scaled by a factorη,
ωX(T)=ωX(0)+F(T), ωC(T)=ωC(0)+ηF(T) . (2) It is known that the PL in the strong coupling is, in general, not simply an incoherent sum of the two transitions, due to the excitation via exciton or cavity components [22,23]. Therefore, we first determinedfrom the maximum time (corresponding to the minimum Rabi splitting at zero detuning) of the first dip in the temporal beat of the FWM response shown in figure3(c), yielding the exciton–cavity coupling in the theoretical model of ¯hg=39µeV. We then fitted the energies of the PL peaks with the calculated polariton energies of the first rung of the JC ladder, leaving as free parameters only the zero-temperature exciton ωX(0) and cavity ωC(0) energies andη. The resulting parameters are given in table1, and the fit curves for the energies and linewidths are given in figures1(b) and (c).
Spectral anti-crossing and exchange of linewidths versus detuning δ=ωC−ωX, as observed in figure1, are generic features of any system representing coupled oscillators and do not identify QSC. To observe QSC one needs to access transitions involving higher manifolds (n>2) of the JC ladder. While non-resonantly excitedµPL was predicted to show some features of the QSC regime in the formation of a Mollow triplet [25], in experiments this has not been observed. This is related to the influence of the relaxation of non-resonantly excited carriers towards the QD ground state, which is often much slower than the lifetime in state-of-the-art cavities, precluding access to higher rungs and creating additional dephasing, moving the system into the weak coupling regime [26].
3. Accessing the first two rungs of the Jaynes–Cummings ladder via four-wave mixing
Exciting resonantly with an optical pulse, one can instantaneously inject n photons into the cavity mode, reaching the nth manifold of the JC ladder, with precise timing and without introducing additional dephasing mechanisms. Hence, in order to reveal the QSC regime we have chosen a resonant excitation scheme. To distinguish the response of the cavity from non-resonant reflection and to access one- and two-photon coherences, we employ FWM detected by the heterodyne spectral interferometry technique [17]. We use two trains of laser pulsesE1 and E2 with a repetition rate of τr−1=76 MHz, which are spectrally centred at the transition energies of the polaritons around 1331 meV. The pulse spectral width was 2 meV (FWHM) and the pulse duration was 0.9 ps. E1 and E2 are collinear and propagate in the same spatial mode, and are focused onto the top of the micropillar using the same optics as described above for theµPL experiment. An efficient coupling to the intra-cavity field is achieved by matching the waist of the focus with the cavity mode at the top facet of the micropillar. We up-shift the frequencies of E1 and E2 by acousto-optic modulators driven at 1/(2π)=79 MHz and 2/(2π)=80.77 MHz. This introduces the phase shifts ei1mτr and ei2mτr for themth pulse in E1andE2, respectively. The induced degenerate FWM signal, specifically the third-order optical polarization P ∝E1∗E22, is retrieved using the time invariance in the repetitive experiment by selecting the field with the phase shift ei(22−1)mτr from light reflected from the pillar. This is realized by measuring the spectrally resolved interference between a frequency shifted reference field with the phase(22−1)mτrand the signal from the sample. The delay between the pulse arrival times at the sample is denoted as τ, which is positive forE1 leadingE2. The amplitude and phase of the FWM field are obtained via spectral interferometry [27]. More details of the experimental methodology and the corresponding notation are given in [16,17,28–30].
A major advantage of the FWM spectroscopy in measuring QSC is that in its lowest order it enables investigating the first two rungs of the JC ladder on an equal footing, accessing both the doublet of vacuum to first rung 0↔M1± transitions and the quadruplet of first to second rung M1±↔M2± transitions, as depicted in figure2. Moreover, the coherent evolution of the 0↔M1± and 0↔M2± transitions can be separately probed, employing distinct FWM creation pathways upon positive and negative delay τ. Details are given in the supplementary material of [16].
M1+
M 1-M2+
M
2-τ
>0
evolution of M1+and M1-evolution of
M2+and M
2-τ
<0
t>0
FWM out
t>0
FWM out
[image:8.595.77.527.88.269.2]a)
b)
Figure 2. FWM creation pathways of order E1∗E22 within the JC ladder for different time ordering of the excitation pulses: (a) pulseE1arrives first forτ >0 and (b) pulseE2arrives first forτ <0.
delay-time dependence is measuring the coherent dynamics of the states M1±. Heret is the real time, zero at the arrival of the second pulse. Forτ <0 instead (figure2(b)), pulseE2arrives first, creating a two-photon coherenceE2E2on the transitions to the second rung 0↔M2±which after an evolution interval of−τis converted by the pulseE1in first order to FWM on both the doublet 0↔M1± and quadruplet M1±↔M2±. The FWM polarization P(t, τ) is proportional to the two-photon coherence on 0↔M2±; thus the delay-time dependence is measuring the coherent evolution of the statesM2±. Therefore,P(t, τ)decays and beats versusτaccording to dephasing time and spectral splitting of M1± (M2±), for τ >0 (τ <0), respectively. The time-resolved FWMP(t, τ)can also be represented as spectrally resolved FWM P˜(ω, τ)=R0∞P(t, τ)eiωtdt,
by transforming the real timet into the angular frequencyω.
We compare the measured FWM response with a theoretically modelled third-order polarization, calculated following our previous work [16]. The model is based on the Hamiltonian of the exciton–cavity system given by (in units ofh¯)
H =ωCa†a+ωX|1ih1|+g(a†|0ih1|+a|1ih0|) (3) witha†anda denoting the creation and annihilation operators of the cavity photon and|0iand |1ithe ground and excited states of the excitonic system, respectively. The density matrixρ(t) of such a system satisfies the master equation
idρ
dt = ˆLρ=[H, ρ]−iγC(a
†aρ
+ρa†a−2aρa†)−iγX(|1ih1|ρ+ρ|1ih1| −2|0ih1|ρ|1ih0|)
(4) in which both cavity and exciton dissipation are taken into account in the standard Lindblad approach. We assume that the optical excitation and emission occur via the cavity photon mode. For ultrashort excitation pulses, the FWM polarization, i.e. the lowest-order term proportional toE∗
1E22in the total polarization of the system, is given by [31]
P(t, τ)=
Tr n
e−iLtˆ h
a†, h
a†,e−iLˆτ[a, ρ(−∞)] ii
a o
for τ >0,
Trne−iLtˆ ha,eiLˆτ
a†,[a†, ρ(
−∞)]iao for τ <0.
In the above formulae the superoperator Lˆ defined in equation (4) is used, andρ(−∞)denotes the density matrix before the optical excitation.
The FWM polarization is calculated by representing the Lindblad superoperator Lˆ as a matrix in the basis of uncoupled exciton and cavity states. For a system initially in the ground state, only the ground state and the first two rungs of the JC ladder, M1± and M2±, are relevant in the lowest order of FWM. The FWM polarization is then given by
P(t, τ)=X
k=± 6 X
j=1
cj ke−iω˜jteiλ˜kτ (6)
in whichcj kare constants calculated by matrix algebra, different for positive and negative delay
times. The delay dynamics in equation (6) is given by the frequencies of the first rungλ±˜ =λ∗1± (second rungλ±˜ =λ2±) for positive (negative) delay, where
λn±=
(2n−1)(ωC−iγC)+ωX−iγX
2 ±
s ω
C−ωX−iγC+ iγX 2
2
+ng2 (7)
are the complex eigenfrequencies of the coupled exciton–cavity system. The real-time dynamics is given by complex frequencies of the six transitions
˜
ω1=λ1+, ω˜3=λ2+−λ∗1+, ω˜5=λ2+−λ∗1−,
˜
ω2=λ1−, ω˜4=λ2−−λ∗1−, ω˜6=λ2−−λ∗1+,
(8)
between the ground state and the first rung (ω˜1,2), and the first and second rungs (ω˜3,4andω˜5,6) of the JC ladder. The parameters of the model used in this work have been determined from the photoluminescence characterization, as given in table1and described in section2. Note that in the FWM calculation, the Lorentzian part of the spectrometer resolution of 4µeV was included in real time but not in the delay-time dynamics.
4. Four-wave mixing results
4.1. Detuning dependence of four-wave mixing
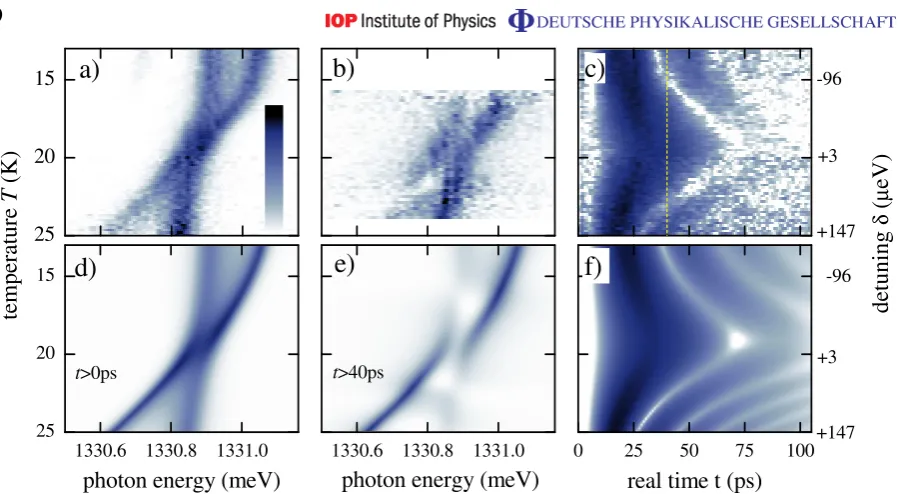
The measured spectrally resolved FWM power | ˜P(ω, 0)|2 as a function of the sample temperature T and the related detuningδ(T)is given in figure 3(a). We find that in the region close to zero detuning, no clear anti-crossing is observed, in contrast to the PL data of figure1. This is caused by contributions of the second rung transitions M1−↔M2− and M1+↔M2+, which are creating FWM signal in the spectral region between the first rung transitions.
25 20
15
a)
detuning
δ
(
μ
eV)
temperature
T
(K)
+147 +3
c)
b)
-96 +147 +3 -96
1330.6 1330.8 1331.0 25
20 15
t>0ps
e)
d)
photon energy (meV)
0 25 50 75 100
real time t (ps)
f)
1330.6 1330.8 1331.0
t>40ps
[image:10.595.80.530.85.332.2]photon energy (meV)
Figure 3. (a) The measured and (d) predicted FWM | ˜P(ω,0)|2 as a function of the temperature T and the corresponding detuning δ. Linear colour scale as shown in (a). (b) The measured and (e) predicted post-selected FWM | ¯Ps(ω,0;40 ps)|2. The post selection timets=40 ps is shown in (c) as a dashed line. (c) The measured and (f) predicted FWM|P(t,0)|. Logarithmic scale over three orders of magnitude as shown in (a). The data were normalized to their integral for each detuning.
Post-selecting the FWM signal emitted after a survival time ts following its creation by the second pulse att=0 [16,19], we can suppress the fast decaying components in the signal. In our case these are four second rung transitions M1±↔M2±, which have about three times faster decay times due to the higher photon content of the second rung, see equation (7). The post-selected FWM P¯s(ω, τ;ts)=Rt∞
s P(t, τ)e
iωtdt is therefore for sufficiently large t
s dominated by the first rung transitions 0↔M1±, in accordance with equations (6)–(8). The resulting detuning dependence of P¯s(ω, τ;40 ps)is given in figure3(b). ts=40 ps is indicated in figure 3(c) as a dashed line. The FWM is decreasing with increasing|δ|, and is shown over the detuning range in which the post-selected FWM is above the noise. These data show an anti-crossing, as expected for the first-rung transitions, confirming that the system remains in strong coupling.
In figures 3(d)–(f), we present the theory predictions corresponding to figures 3(a)–(c). The predictions, which are based on the theoretical approach presented in section 3 and [16], are in good agreement with the measurements. All the salient features of the experimental data discussed above are reproduced.
4.2. Coherent dynamics on the first and the second rung of the Jaynes–Cummings ladder
-50 0 50 100
x100
noise level
T=19.1K δ=0.06Ω
m) T=25K δ=1.75Ω
delay τ (ps)
o) τ<0
integrated FWM
power τ>0
T=19.7K δ=0.25Ω
n)
x1000
-50 0 50 100
-50 0 50 100
0.1 1 10 100 1000 10000 1330.5 1331.0
photon energy
ω
(meV)
-50 0 50 100
1330.5 1331.0 0 40 80
-50 0 50 100 -50 0 50 100
0 40 80
-50 0 50 100
a)
j)
delay τ (ps)
real time t
(ps)
b) c)
d) e) f )
g) h) i)
[image:11.595.149.530.89.493.2]l) k)
Figure 4. Delay-time dependence of the FWM for three different detunings δ=0.06 (left column), δ=0.25 (middle column) and δ=1.75 (right column). The excitation pulses E1 (E2) at the top facet of the micropillar had an energy of 0.03 fJ (0.08 fJ), 0.15 fJ (0.39 fJ) and 0.09 fJ (0.22 fJ), respectively. Top two rows: normalized time-resolved FWM|P(t, τ)|2, measured (a)–(c) and predicted (d)–(f). Logarithmic colour scale, given by the colour bar in (c), over 3, 4 and 2.5 orders of magnitude in (a), (d); (b), (e); and (c), (f), respectively. Middle two rows: spectrally resolved FWM| ˜P(ω, τ)|2, measured (g)–(i) and predicted (j)–(l). The same colour scale, logarithmic over 5 (4) orders of magnitude in (h); (g), (i). Dark grey areas indicate no data. Bottom row: (m)–(o) time-integrated power |P|2int(τ), predicted (solid lines) and measured (filled circles, blue for τ >0 and red for τ <0). The units of the measured FWM power have been chosen to match the prediction atτ =0. The noise level of the measurement is gives as open circles.
zero detuningδ=0.06, the dynamics is the slowest. Forτ >0, the time-integrated|P|2int(τ)= R∞
0 |P(t, τ)|
2dt(see figure4(m)) shows an exponential decay of aboutT
Rabi splitting of 79±3µeV, in agreement with the splitting measured inµPL. Forτ <0 instead a much faster decay is observed. This is as expected, as the M2± states of the second rung (see figure2(b)) have a photon content of 3/2 compared to 1/2 for the first rung at δ=0, and as a result a nearly three times faster decay rate, T2/2=2τC/3=7 ps. Atδ'0 the M2± states are expected to exhibit a √2 larger splitting than the M1± states, corresponding to a
√
2 shorter beat period of about 36 ps. In the measurements, we can observe the fast decay and a minimum aroundτ = −25 ps. As for positive delay, the first minimum occurs somewhat earlier than one full period. The observation of this beat for τ <0, approximately √2 faster than forτ >0, is a direct manifestation of the second rung of the JC ladder and reveals the QSC regime. The theoretical prediction (solid lines) is in quantitative agreement for both positive and negative delays, supporting the interpretation of the data within the JC model. Specifically, the position of the minimum is consistent with the measurement, confirming the splitting of the second rung. Also, the time-resolved (figure4(a)) and spectrally resolved (figure4(g)) measurements and the corresponding theoretical predictions (figures 4(d) and (j)) are in agreement, including details of the spectral and temporal dynamics.
With increasing detuning, the dynamics becomes faster, as seen for δ=0.25(figure4, middle column) and δ=1.75 (figure 4, right column). The beat period is shortened as expected from larger splitting in all rungs given by ∼√n2+δ2, and the decay is modified due to a different photon content in the M1± and M2± states. Also here we find agreement between measurements and predictions.
We emphasize that for all three detunings reported here, we observe in |P|2
int(τ) an oscillation at τ <0 given by the splitting in the second rung M2±, with a dynamics in quantitative agreement with prediction. To observe this oscillation in the present sample, a dynamic range of at least two orders of magnitude in the FWM amplitude (four orders in the FWM power) was required. Previously reported data of this type (figure 4 of [16]) had insufficient dynamics to observe the minimum of the oscillation of the second rung at τ <0. The improved signal-to-noise ratio in the FWM measurements shown here was achieved by an improved detection efficiency of the heterodyne spectral interferometry setup (using a detector of higher saturation, readout rate and quantum efficiency (Princeton Instruments PIXIS:100BR), and by increasing the transmission in the detection path by optimized anti-reflection coatings) and the better characteristics of the present sample, including complete removal of the Ni hardmask during the etching of the micropillars. The sample employed in [16] suffered from a remaining Ni layer over the top facet of the micropillars, causing a reduction of the coupling efficiency.
4.3. Quantum-to-classical crossover of the strong coupling
showing the entanglement between atom and photon-number states. Recently, the quantum-to-classical transition of the strong coupling in a thermal field with increasing average phonon number was studied in superconducting qubits [34].
In this section, we investigate the quantum-to-classical crossover of the strong coupling regime in an exciton–cavity system [23]. It occurs when climbing the JC ladder until the change of the Rabi splitting between rungs 2(√n+ 1−√n)gis much smaller than the linewidths. With varying the driving power ofE1andE2, we control the average number of injected photons into the cavity mode. In χ(3) conditions corresponding to photon numbers below unity, we probe in FWM the first five levels of the JC ladder (the ground state and doublets in the first two manifolds), demonstrating the quantum character of strong coupling, as shown in the previous section. With increasing injected photon number, higher-order contributions involving higher rungs are dominating the FWM response. In the investigated structure, already the transitions from the second to third rungM2±↔M3± have a shift of only 2(√3−√2)g∼26µeV from the cavity mode, less than its width. Therefore, we reach the semi-classical regime of the strong coupling already in the third rung, with a spectral response expected to be similar to the Mollow triplet.
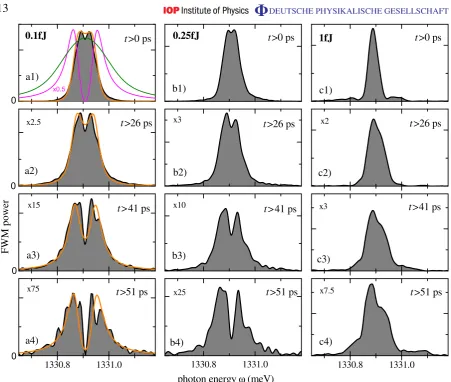
We investigate the crossover here at τ =0 and zero detuning. To give insight into the contributions of different rungs in the FWM response, we show in figure 5 the post-selected FWM spectra | ¯Ps(ω,0;ts)|2 for different post-selection times ts and excitation powers. In the χ(3) regime (left column), the FWM spectrum att
s=0 (figure5(a1)) consists of contributions of the first and the second rung. The predicted decomposition of the signal into the first 0↔M1± (magenta line) and the second M1±↔M2± (green line) rung contribution are given. The 0↔M1±transitions do show a vacuum Rabi doublet. The quadruplet M1±↔M2±creates a spectrally broad peak due to faster dephasing. The coherent superposition of 0↔M1± and M1±↔M2± yields the FWM spectral lineshape, given by the orange curve: with the current micropillar parameters, the six transitions form a shape with a small dip in the middle. The average excitation provided by E1 arriving at the top facet of the micropillar was 8 nW, corresponding to 0.1 fJ per pulseE1. From this, only 0.25% of light enter the cavity, considering the ratio between the ideal linewidth of the planar cavity without side-wall losses (6µeV) and the pulse width of 2.5 meV. Taking into account a non-ideal mode matching by a factor of 0.8, we estimate that E1 (E2) injects into the photon mode, on average, 1 (2.5) photons per pulse. The measured spectrum, given by the shaded area, is in good agreement with the theoretical prediction in theχ(3) limit.
Increasing the post-selection time ts, as shown in figures 5(a2)–(a4), we can suppress the second rung contributions, as discussed earlier. For t >51 ps the FWM is dominated by the 0↔M1± transitions, showing the expected Rabi-split doublet with a destructive interference in the centre. The predicted spectra confirm this interpretation.
t>0 ps
c1)
1fJ
c2)
x2 t>26 ps
c3)
x3 t>41 ps
1330.8 1331.0 c4)
x7.5 t>51 ps
a1)
0 0 0
FWM power
t>0 ps
0.1fJ
0
x0.5
t>26 ps
x2.5
a2)
t>41 ps
a3) x15
1330.8 1331.0 a4)
t>51 ps
x75
photon energy ω (meV)
t>0 ps
0.25fJ
b1)
b2)
t>26 ps
x3
b3)
t>41 ps
x10
1330.8 1331.0
t>51 ps
[image:14.595.79.531.85.467.2]b4) x25
Figure 5. Post-selected FWM spectra| ¯Ps(ω,0;ts)|2 for different post-selection timests=0,26,41 and 51 ps (from top to bottom) and excitation powers (left to right). Left column (a1)–(a4): excitation energy 0.1 fJ per pulseE1corresponding to an estimated average of n=1 injected photons. Middle columns (b1)–(b4): 0.25 fJ per pulse E1. Right column (c1)–(c4): 1 fJ per pulse E1. The relative scaling factors within each column are given. Orange lines: the predicted FWM spectra (normalized to data). A spectral decomposition into M1±↔M2± transitions (green line) and 0↔M1± transitions (magenta line, multiplied by a factor of 0.5) is given in (a1).
-40 0 40 80 0.2fJ h)
-40 0 40 80 1.0fJ
i)
delay τ (ps)
-40 0 40 80 1
10 100 1000 10000 g)
noise level
FWM powe
r
0.1fJ 1330.7
1331.1
h
ω
(meV)
d) e) f)
0 40 80
t
(p
s)
[image:15.595.80.529.95.337.2]a) b) c)
Figure 6.Measured delay-time-dependent FWM atδ=0.06as a function of excitation fluence as indicated, for which an estimated average of one, two and ten photons are injected by the pulseE1into the cavity in the left, middle and right columns, respectively. Top row: time-resolved FWM |P(t, τ)|2. Middle row: spectrally resolved FWM| ˜P(ω, τ)|2. Logarithmic colour scale as in figure4over three, four and five orders of magnitude in (a); (b), (c); and (d)–(f), respectively. Grey regions indicate no data. Bottom row: integrated FWM|P|2int(τ)in arbitrary units. The noise level of the measurement is given as open circles.
The delay-time dynamics with increasing injected photon number is shown in figure 6. The dynamics changes both for positive and for negative time delays. Specifically, the beat at negative delays reduces its period, as expected from the higher rungs, and gets less well defined as several rungs are contributing to the response. The spectral and real-time data show a more pronounced signal for τ <0. We tentatively attribute this observation to the transfer of the one-photon coherence forτ >0 to the second rung transitions M1±↔M2∓in a fifth-order process E1E1∗E1∗E22, which has a dephasing rate similar to the 0↔M2∓ two-photon coherence. A quantitative theoretical modelling of the FWM response including all relevant rungs of the JC ladder is at present being developed and will be reported in a forthcoming publication.
5. Conclusion
with mesoscopic fields [38] in solids, such as the demonstration of collapse and revival of Rabi oscillations.
Acknowledgments
JK acknowledges support by the 2012 ERC Starting Grant ‘PICSEN’ contract no. 306387. KS acknowledges support by the Royal Thai Government. FA acknowledges support by the Deutscher Akademischer Austauschdienst under project number 50743470. The work was supported in part by the Deutsche Forschungsgemeinschaft through the research group ‘Quantum Optics in Semiconductor Nanostructures’ and the State of Bavaria.
References
[1] Brune M, Schmidt-Kaler F, Maali A, Dreyer J, Hagley E, Raimond J M and Haroche S 1996Phys. Rev. Lett.
761800–3
[2] Nogues G, Rauschenbeutel A, Osnaghi S, Brune M, Raimond J M and Haroche S 1999Nature400239–42 [3] Gleyzes S, Kuhr S, Guerlin C, Bernu J, Del´eglise S, Hoff U B, Brune M, Raimond J M and Haroche S 2007
Nature446297–300
[4] Fink J M, Goppl M, Baur M, Bianchetti R, Leek P J, Blais A and Wallraff A 2008Nature454315–8 [5] Hopfield J J and Thomas D G 1965Phys. Rev. Lett.1522–5
[6] Kaluzny Y, Goy P, Gross M, Raimond J M and Haroche S 1983Phys. Rev. Lett.511175–8 [7] Weisbuch C, Nishioka M, Ishikawa A and Arakawa Y 1992Phys. Rev. Lett.693314
[8] Brennecke F, Donner T, Ritter S, Bourdel T, K¨ohl M and Esslinger T 2007Nature450268–71 [9] Jaynes E and Cummings F 1963Proc. IEEE5189–109
[10] Bishop L S, Chow J M, Koch J, Houck A A, Devoret M H, Thuneberg E, Girvin S M and Schoelkopf R J
2009Nature Phys.5105–9
[11] Yoshie T, Scherer A, Hendrickson J, Khitrova G, Gibbs H M, Rupper G, Ell C, Shchekin O B and Deppe D G
2004Nature432200–3
[12] Faraon A, Fushman I, Englund D, Stoltz N, Petroff P and Vuckovic J 2008Nature Phys.4859–63
[13] Volz T, Reinhard A, Winger M, Badolato A, Hennessy K J, Hu E L and Imamoˇglu A 2012Nature Photon.
6605–9
[14] Peter E, Senellart P, Martrou D, Lemaˆıtre A, Hours J, G´erard J M and Bloch J 2005Phys. Rev. Lett.95067401 [15] Reithmaier J P, S¸ek G, L¨offler A, Hoffmann C, Kuhn S, Reitzenstein S, Keldysh L V, Kulakovskii V D,
Reinecke T L and Forchel A 2004Nature432197–200
[16] Kasprzak J, Reitzenstein S, Muljarov E A, Kistner C, Schneider C, Strauss M, H¨ofling S, Forchel A and Langbein W 2010Nature Mater.9304–8
[17] Langbein W and Patton B 2006Opt. Lett.311151
[18] Kasprzak J, Reitzenstein S, Muljarov E, Kistner C, Schneider C, Strauß M, H¨ofling S, Forchel A and Langbein W 2010Proc. SPIE7600760015
[19] Albert Fet al2013Nature Commun.doi:10.1038/ncomms2764 [20] Reitzenstein S and Forchel A 2010J. Phys. D: Appl. Phys.43033001 [21] P¨assler Ret al1999J. Appl. Phys.864403–11
[22] Laucht A, Hauke N, Villas-Bˆoas J M, Hofbauer F, B¨ohm G, Kaniber M and Finley J J 2009Phys. Rev. Lett.
103087405
[23] del Valle E and Laussy F P 2011Phys. Rev.A84043816
[26] M¨unch S, Reitzenstein S, Franeck P, L¨offler A, Heindel T, H¨ofling S, Worschech L and Forchel A 2009Opt.
Express1712821–8
[27] Lepetit L, Ch´eriaux G and Joffre M 1995J. Opt. Soc. Am.B122467 [28] Langbein W 2010Riv. Nuovo Cimento33255–312
[29] Langbein W and Patton B 2007J. Phys.: Condens. Matter19295203
[30] Kasprzak J, Patton B, Savona V and Langbein W 2011Nature Photon.557–63 [31] Muljarov E A and Zimmermann R 2006Phys. Status Solidib2432252–6
[32] Bertet P, Osnaghi S, Rauschenbeutel A, Nogues G, Auffeves A, Brune M, Raimond J M and Serge H 2001
Nature411166–70
[33] Auffeves A, Maioli P, Meunier T, Gleyzes S, Nogues G, Brune M, Raimond J M and Haroche S 2003Phys.
Rev. Lett.91230405
[34] Fink J Met al2010Phys. Rev. Lett.105163601
[35] Ates S, Ulrich S M, Reitzenstein S, L¨offler A, Forchel A and Michler P 2009Phys. Rev. Lett.103167402 [36] Vamivakas A N, Zhao Y, Lu C Y and Atat¨ure M 2009Nature Phys.5198–202
[37] Flagg E B, Muller A, Robertson J W, Founta S, Deppe D G, Xiao M, Ma W, Salamo G J and Shih C K 2009
Nature Phys.5203–7
[38] Meunier T, Gleyzes S, Maioli P, Auffeves A, Nogues G, Brune M, Raimond J M and Haroche S 2005Phys.