High-b-Value Diffusion-Weighted MR Imaging
of Hyperacute Ischemic Stroke at 1.5T
Hyun Jeong Kim, Choong Gon Choi, Deok Hee Lee, Jeong Hyun Lee, Sang Joon Kim, and Dae Chul Suh
BACKGROUND AND PURPOSE:Diffusion-weighted (DW) imaging at bⴝ2000 s/mm2offers theoretical advantages over DW imaging at b ⴝ 1000 s/mm2 for detection of hyperacute ischemic stroke. The purpose of this study was to determine whether bⴝ2000 images are better than bⴝ1000 images for detecting and estimating the extent of diffusion change within 6 hours after stroke onset.
METHODS:We compared DW images obtained with a b value of 1000 s/mm2(TR/TE/NEX, 7500/71/1) with those obtained with a b value of 2000 s/mm2 (TR/TE/NEX, 7500/83/2) in 94 patients examined within 6 hours of clinically suspicious hyperacute ischemic stroke (57 men, 37 women; mean age ⴞ SD, 62 yearsⴞ8; age range, 47– 80 years; mean time intervalⴞ SD, 206ⴞ 90 min). Three observers performed qualitative analysis of DW images and reached a consensus about lesion conspicuity, lesion extent, and image artifact. In the quantitative analysis of 34 patients with lesions in the territory of the middle cerebral artery, the signal-to-noise ratio (SNR), contrast-signal-to-noise ratio (CNR), and volume of ischemic lesion were measured and findings of the bⴝ 1000 and bⴝ 2000 images were compared.
RESULTS:The sensitivity and specificity of bⴝ1000 and bⴝ2000 images were calculated as 94% (80/85)/ 100% (9/9) and 98% (83/85)/ 100% (9/9), respectively, relative to the presence or absence of infarction on the follow-up T2-weighted images. In three patients, hyperintense lesions were depicted only on b ⴝ 2000 images. On qualitative analysis, lesions were more conspicuous and larger on bⴝ2000 images in 23 and 11 patients, respectively. On quantitative analysis, as the b value increased, the mean lesion volume increased by 47% (22.1ⴞ 27.9 mL at bⴝ1000 s/mm2versus 32.5ⴞ36.5 mL at bⴝ2000 s/mm2,P< .001,nⴝ34). As the b value increased, mean SNR decreased both in the lesion and in the contralateral normal area by 17% and 28%, respectively, but the mean CNR increased by 23% (8.7ⴞ6.4 at bⴝ1000 s/mm2versus 10.7 ⴞ6.5 at bⴝ2000 s/mm2,P< .001,nⴝ 34).
CONCLUSION: DW images acquired with a b value of 2000 s/mm2 were better than DW images acquired with a b value of 1000 s/mm2for the detection and estimation of the extent of diffusion change in patients examined within 6 hours of ischemic stroke onset.
In patients with hyperacute brain ischemia, the clear demonstration of lesion location and extent by imag-ing studies is very important for therapeutic decision making. For detection and extent estimation of the ischemic lesion, diffusion-weighted (DW) imaging is
currently superior to other imaging modalities. CT has been used for many years as the first-line imaging technique for patients with hyperacute ischemic stroke. However, CT has limitations not only for de-tecting small lesions, especially in the posterior fossa, but also for estimating the extent of the lesion. Al-though CT is able to show early signs of ischemic stroke, especially in patients with lesions in the mid-dle cerebral artery (MCA) territory, it is frequently difficult to know the exact extent of the lesion on the basis of nonenhanced CT findings alone (1–5). Per-fusion CT is a promising tool that provides quantita-tive hemodynamic information about cerebral blood volume, cerebral blood flow, and mean transit time, but it cannot image the whole brain in its current state of technological development (6). Conventional T2-weighted imaging or proton density–T2-weighted imag-Received March 8, 2004; accepted after revision June 29, 2004.
From the Department of Radiology, Asan Medical Center, Uni-versity of Ulsan, College of Medicine, 388-1 Poongnap Dong, Songpa-Gu, Seoul, 138-736, Korea.
Supported by grant of the Korea Health 21 R&D Project, Ministry of Health & Welfare, Republic of Korea (03-PJ1-PG1-CH06-0001).
Address of correspondence to Choong Gon Choi, MD, Depart-ment of Radiology, Asan Medical Center, University of Ulsan College of Medicine, 388-1 Poongnap-dong, Songpa-gu, Seoul 138-736, Korea, E-mail: [email protected]
©American Society of Neuroradiology
diffusion weighting, DW imaging with a high b value (i.e., b⫽2000 or 3000 s/mm2) does offer advantages over DW imaging at b⫽1000 s/mm2for detection of hyperacute ischemic lesions, especially for lesions with mild diffusion changes. Initial application of DW imaging with b values of 2500 –3000 s/mm2for acute or subacute infarction provided no apparent diagnos-tic advantages compared with those of b ⫽ 1000 s/mm2 images (15, 16). However, it is still unclear whether a high b value is better than a conventional b value of 1000 s/mm2 for the detection of ischemic lesions and their extent, especially during the first 6 hours after stroke onset. In this study, we compared DW images acquired at b⫽2000 s/mm2with those at b⫽1000 s/mm2in patients examined within the first 6 hours after stroke onset.
Methods
Patients
Our institutional review board approved a research protocol for high-b-value DW imaging performed in patients with sus-pected brain ischemia. We obtained informed consent from each patient before MR imaging examinations. We examined 446 consecutive patients with clinical suspicion of acute cere-bral infarction between January 2002 and February 2003. Among them, 94 patients were recruited as they fulfilled our inclusion and exclusion criteria. We included the patients with (a) complete acute stroke MR imaging protocol (described later) performed within 6 hours after symptom onset, (b) DW images obtained with b values of 1000 and 2000 s/mm2in the same imaging session, (c) follow-up MR imaging (described later) obtained within 1 week (mean, 3 days). We excluded those patients who already presented with an abnormality on T2-weighted images in the area corresponding to diffusion abnormality on DW images, as we wished to know the sensi-tivity of the two b values in the lesion with only diffusion abnormality. In all study patients, neurologists made the final diagnosis on the basis of their clinical assessment and the neuroimaging studies. Finally, we enrolled 94 patients who fulfilled the inclusion and exclusion criteria described above (57 men, 37 women; mean age⫾SD, 62 years⫾8; age range, 47– 80 years; mean time interval⫾SD, 206⫾90 min).
MR Imaging
We examined all patients by using a 1.5T whole-body MR imager (CVi; GE Medical Systems, Milwaukee, WI). The sys-tem had echo-planar imaging capability with maximum gradi-ent strength inx,y, orzdirections of 40 T/m/ms and a slew rate
image acquisition time to 83 ms and 56 s, respectively, but all other imaging parameters of b⫽2000 images were the same as those of b⫽1000 images. In each patient, b⫽2000 images were obtained immediately after the acquisition of b ⫽1000 images in the same session. Follow-up MR imaging was per-formed within 1 week (mean, 3 days) and comprised fast spin-echo T2-weighted imaging, DW imaging with a b value of 2000, 3D TOF MRA, and contrast-enhanced MR angiography from the aortic arch to the intracranial arteries.
Postprocessing and Image Analysis
All DW images were transferred to a workstation (Advan-tage Window 4.0; GE Medical Systems). An ADC map was produced from the diffusion trace images and b⫽0 images.
Qualitative Analysis
Three observers (CGC, DHL, JHL) with experience in DW imaging for more than 3 years did qualitative analysis of the diffusion trace images in a nonblinded fashion. Before visual assessment, we adjusted the window level and width of our PACS view monitors to make the gray scale level of the two DW imaging sets similar. The observers assessed the DW images in terms of lesion conspicuity, lesion extent, and image artifacts. The observers compared the b⫽2000 images with the b⫽1000 images side-by-side and finally, by consensus, con-cluded that the b⫽2000 images were better, the same as, or worse than b ⫽ 1000 images in terms of lesion conspicuity, lesion extent, and image artifacts. We did not use any scale or scoring system for each item of qualitative analysis.
Quantitative Analysis
from the b⫽2000 DW image and then from the b⫽1000 DW image at the corresponding location. From these SI measure-ments, the SNR and CNR of the ischemic lesion were calcu-lated by using following equations, respectively (16):
1) SNRROI⫽
SROI
2) CNR⫽S1⫺S0
where SROI⫽SI at region of interest, S1⫽SI at the ischemic lesion, S0⫽SI in the corresponding contralateral normal area, and⫽SD of background SI.
The mean ADC values of the ischemic lesion and the cor-responding contralateral normal area were automatically ob-tained from the ADC map after positioning the region of interest at the trace images. The relative ADC of the ischemic lesion was calculated as a percentage over the corresponding contralateral normal area. We also measured the volume of the ischemic lesion on the initial and follow-up trace images by using volume analysis software (Advantage Window 4.0). For the volume measurement, we used a semiautomatic threshold-based segmentation technique. The 3D segmentation of the ischemic lesion was automatically performed after applying a threshold value of SI. We measured the lesion volume from the initial b ⫽1000, b⫽2000 images, and follow-up b ⫽2000 images, respectively, with a time interval of at least 1 week for each measurement to avoid single observer bias.
Statistical Analysis
The paired samples ttest was used to compare SI, SNR, CNR, ADC, and lesion volume between the b⫽1000 and b⫽ 2000 images. A P value ⬍.05 was considered statistically significant.
Results
In 11 of the 94 study patients, no definite hyperin-tense lesions were observed on the initial DW images obtained with a b value of either 1000 or 2000. In two of these 11 patients, acute small infarcts in the basal ganglia were confirmed on follow-up T2-weighted
im-ages. The other nine patients showed no definite abnormality on follow-up T2-weighted images. Their final clinical diagnoses were transient ischemic attack in five patients, factitious disorder in three, and spinal cord lesion with brown squared syndrome in one. In the other three of the 94 patients, hyperintense le-sions were detected on the b⫽ 2000 images but not on the b ⫽1000 images. In these three patients, two had lesions in the left MCA territory (cortical and subcortical area, respectively), and the other patient had a small lesion at posterior limb of the internal capsule that were confirmed on follow-up T2-weighted image (Fig 1, 2). In the remaining 80 of the 94 patients, hyperintense lesions were detected on both b⫽ 1000 and 2000 images. In 83 patients with hyperintense lesions on the initial b ⫽ 1000 or 2000 images, follow-up T2-weighted imaging revealed in-farcts with variable size changes depending on the progression or partial normalization of the initial le-sions. Partial normalization of the initial lesions was observed in five patients, but no patients showed complete normalization of the initial lesions on fol-low-up T2-weighted images. Therefore, the sensitivi-ty/specificity of the b⫽ 1000 and 2000 images were calculated as 94% (80/85)/100% (9/9) and 98% (83/ 85)/100% (9/9), respectively, relative to the presence or absence of infarction on the follow-up T2-weighted images. In the 83 patients with hyperintense lesions on initial b⫽ 1000 or 2000 images, the time interval between symptom onset and MR imaging was within 3 hours in 42 patients or within 3 to 6 hours in 41 patients. The infarction patterns in those 83 patients are summarized in Table 1. Territorial infarction was the most common type of stroke (57/83, 69%) and most of these were MCA infarcts (52/57). The causes of MCA infarction were cardiogenic embolism in 23 patients, proximal carotid atherosclerosis in 14, MCA atherosclerosis in seven and unknown causes in eight patients.
FIG 1. A–C,An 88-year-old woman who had right-side weakness for 1 hour 50 minutes. Left MCA was not visible on initial 3D TOF MRA images (not presented).
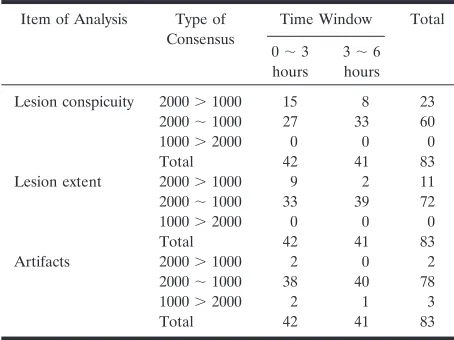
The results of qualitative analysis for lesion conspi-cuity, lesion extent and artifact are summarized in Table 2. In 23 of 83 patients, the ischemic lesions were more conspicuous on b⫽ 2000 images than on b ⫽ 1000 images. In 11 of those 23 patients, the ischemic lesions were larger on b⫽2000 images than on b⫽1000 images. These patients were more often in the patient group examined within 3 hours after stroke than in the group examined between 3 and 6 hours after stroke (9/42 versus 2/41, respectively). The locations of the ischemic lesions in those 11 patients were the MCA territory (7), anterior cerebral artery territory (1), internal capsule (1,) and brain stem (2) (Fig 3, 4). As far as the artifacts were concerned, there was no significant difference between the b ⫽ 2000 and the b⫽1000 images. In two patients, prom-inent SI decrease was observed around the third and lateral ventricles on the b⫽1000 images. This artifact may be caused by the CSF pulsation within the ven-tricles. In the other three patients, motion artifact and some artifacts of gradient instability or eddy current were observed on the b⫽ 2000 images.
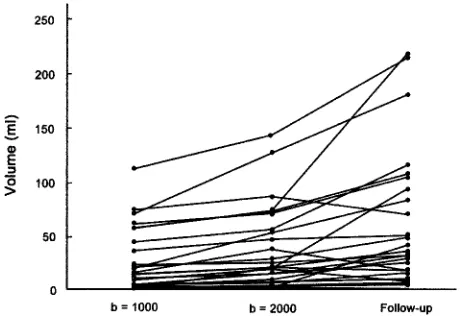
The results of the quantitative analysis are summa-rized in Table 3. As the b value increased, the mean lesion volume increased by 47% (22.1⫾27.9 mL on
b⫽1000 images versus 32.5⫾36.5 mL on b⫽2000 images, P ⬍ .001, n ⫽ 34). The measured lesion volumes are presented graphically in Figure 5. As the b value increased, the mean SI of brain tissue de-creased by 35% and 45%, respectively, in both the lesion and the contralateral normal area. The back-ground noise level was lower in b⫽2000 images than in b⫽1000 images, probably owing to the increased NEX (9.0⫾1.9 on b⫽2000 images versus 11.6⫾2.1 on b⫽1000 images,P⬍.001,n⫽34). As the b value increased, the mean SNR decreased by 17% and 28%, respectively, in both the lesions and in the con-tralateral normal areas (P ⬍ .001). This decrease of SNR on b ⫽ 2000 images was caused by the promi-nent decrease of tissue SI despite the decrease of background noise. However, as the b value increased, the mean CNR between the lesion and contralateral normal area increased by 23% (8.7⫾6.4 on b⫽1000
[image:4.585.56.535.60.246.2]FIG 2. A–C, A 63-year-old man who had right hemiparesis for 6 hours. Abnormal hyperintensity is noted at left posterior limb of internal capsule on b⫽2000 image (B, white arrow) but it is not definite on b⫽1000 image (A). Follow-up T2-weighted image obtained 2 days later shows a small hyper-intense lesion in the same location (C,white arrow).
TABLE 1: Patterns of infarction in 83 patients who had lesions on initial DW images
Pattern of Infarction Patients (No.)
ACA 4
MCA (1 or 2 lesions) 39 Scattered MCA (⬎3 lesions) 13
ACA⫹MCA 1
Brain stem or cerebellar lesion 11 Small lesion in deep gray matter or
adjacent white matter
12
Border zone lesion 3
Total 83
[image:4.585.305.532.313.483.2]Note.—DW images, diffusion-weighted images; ACA, anterior ce-rebral artery; MCA, middle cece-rebral artery.
TABLE 2: Results of qualitative analysis in 83 patients who had le-sions on initial DW images
Item of Analysis Type of Consensus
Time Window Total
0⬃3 hours
3⬃6 hours
Lesion conspicuity 2000⬎1000 15 8 23 2000⬃1000 27 33 60 1000⬎2000 0 0 0
Total 42 41 83
Lesion extent 2000⬎1000 9 2 11 2000⬃1000 33 39 72 1000⬎2000 0 0 0
Total 42 41 83
Artifacts 2000⬎1000 2 0 2 2000⬃1000 38 40 78 1000⬎2000 2 1 3
Total 42 41 83
[image:4.585.53.283.314.427.2]FIG 3. A–F,A 64-year-old man who had left hemiparesis for 1 hour 20 minutes. Initial b⫽1000 images reveal subtle hyperintensity in the right corona radiata and basal ganglia (A, B). The lesion is more conspicuous and extensive on b⫽2000 images (C, D). Follow-up T2-weighted image obtained 3 days later shows progression to infarction at the basal ganglia (E, F). Initial diffusion change is partly normalized in the posterior portion of the initial lesion. An old infarction is noted in the left posterior temporal cortex on the T2-weighted image.
images versus 10.7 ⫾ 6.5 on b⫽ 2000 images, P ⬍
.001, n ⫽ 34). This increase of CNR on b ⫽ 2000 images seems to have been caused mainly by the decrease of background noise level because the mean SI difference between the lesion and contralateral normal tissue was almost the same in b⫽ 1000 and b⫽2000 images (Table 3). As the b value increased, the mean ADC decreased in both the lesion and the contralateral normal area by 23% and 20%, respec-tively. The relative ADC of the ischemic lesions was 79 ⫾ 13% and 75 ⫾ 13% on b ⫽ 1000 and 2000 images, respectively.
Discussion
As the b value increases, the SI of normal gray matter decreases progressively relative to normal white matter; at b values greater than 2000, the gray-white matter pattern reverses relative to the usual b value of 1000 (17). In this study, the b⫽2000 images also revealed relative hyperintensities to cortical gray
matter, especially in the corona radiata, the posterior limb of internal capsule, and the lower brain stem (Fig 6). When analyzing b⫽2000 images, this relative hyperintensity of normal white matter structures should not be erroneously diagnosed as ischemic le-sions. Comparison of DW images with ADC maps may easily solve this type of problem. Meyer et al (15) calculated the theoretical SI difference between acute infarct and normal gray matter on DW images ac-quired with various b values and found the optimal b values to be between 1500 and 2000. Burdette et al (16) reported that the average SNR for b ⫽ 3000 images decreased to 45% of the b⫽1000 images and the NEX should be increased by a factor of 4.7 to maintain equivalent SNR between the b⫽ 1000 and the b ⫽ 3000 images. Therefore, it seems that a b value greater than 2000, for example b⫽3000, would not be beneficial for patients with acute brain isch-emia because of too much SI loss, long imaging time to compensate for the SI loss, or prominent relative hyperintensity of normal white matter.
Diffusion studies of human ischemic stroke per-formed with a b value higher than 1000 were rare (13, 15, 16). Warach et al (13) indicated that a higher b value (b ⫽ 1463) was helpful in identifying lesions with certainty, especially in the smallest lesions or those with a transitional zone between normal and abnormal diffusion. Meyer et al (15) compared the DW imaging findings of three different b values (b⫽ 1000, 2500, and 3000) in 12 patients with acute infarc-tion. They reported that although lesion contrast im-proved as the b values increased, the higher b value images had no impact on the diagnosis of acute stroke. In their study, most of the 12 patients seem to be examined after the hyperacute period, and the lesion extent was not evaluated. Burdette et al (16) compared b⫽ 3000 images with b⫽1000 images in 26 patients diagnosed with acute or subacute infarc-tion in the time range of 10 hours to 14 days (median 2.5 days). They concluded that compared with b ⫽ 1000 images, b ⫽ 3000 images did not offer a diag-nostic advantage for the evaluation of late acute or subacute cerebral infarctions, and that b ⫽3000 im-ages are significantly inferior in terms of SNR and CNR, which were defined in the same way as in our
[image:6.585.53.538.70.169.2] [image:6.585.52.282.237.395.2]study. In Burdette’s study, all 26 patients were exam-ined after the hyper-acute period, and the lesion ex-tent was not evaluated in detail.
As the b value increases, the amount of diffusion weighting increases (18). Therefore, higher b value DW imaging would be more advantageous in the diagnosis of hyperacute ischemic lesions in which mild diffusion changes can be present within the le-sions, than in the diagnosis of acute or subacute lesions. In this study, we compared b⫽2000 images with b⫽1000 images in 94 patients who were exam-ined within 6 hours after stroke onset. In the quali-tative analysis, the lesion was larger on b ⫽ 2000 images than on b ⫽ 1000 images obtained in some patients, especially those examined within 3 hours after stroke onset. In the quantitative analysis, the mean lesion volumes on b⫽2000 images were larger than those on b⫽1000 images by 47% in 34 patients with MCA territorial lesions with mean relative ADC of 75–79%. These quantitative data support our somewhat subjective observation on qualitative anal-ysis and suggest that b⫽ 2000 images may detect SI change caused by mild ADC decrease, especially in the peripheral or adjacent portion of the ischemic core that cannot be seen clearly on b⫽1000 images. Desmond et al (19) reported that ischemic penumbra defined by perfusion– diffusion mismatch showed a relative ADC of 75–90% and this area of mild ADC decrease was not prospectively identified on b⫽1000 images but revealed hazy, subtle SI change on retro-spective review. In practical situations, this area of mild ADC decrease can be easily misinterpreted as normal on the rapid review of DW images or inter-preted as a portion of diffusion-perfusion mismatch. We think that b ⫽ 2000 images can reveal this mild decrease of ADC of the ischemic penumbra more conspicuously than b ⫽1000 images in patients with hyperacute territorial lesions (Fig 3).
Another diagnostic advantage of b ⫽2000 images
is the detection of small lesions in the capsule or brain stem area, which are not clearly demonstrated on b⫽ 1000 images. A small lesion in the vertebrobasilar territory may not be detected at initial DW imaging, especially in its early stage (10, 12). This may be owing to the small lesion size beyond the spatial resolution of DW imaging or to mild diffusion change within the lesion. According to Oppenheim et al (12), 31% of their patients with vertebrobasilar ischemic stroke had a false-negative initial DW image during the first 24 hours. This relatively high false-negative rate seems to have been caused by lower spatial res-olution (2.9⫻3.3⫻7.9 mm) and lower b value (b⫽ 800 in 50 of 139 patients) in their study. In our study, b⫽2000 images showed the lesion more clearly than b ⫽ 1000 images in two of the 11 patients with ver-tebrobasilar ischemic stroke (Fig 4). This enhanced lesion conspicuity may be caused by increased CNR on b ⫽ 2000 images. Although the number of our study patient is small, our results suggest the potential benefit of b⫽2000 images for the detection of small ischemic lesions, especially in the brain stem, in the deep gray matter, or in the adjacent white matter.
For DW imaging parameters, we increased the NEX to 2 in b⫽2000 images to compensate for the decreased SNR with a higher b value. By SI averaging, SNR of the b⫽2000 images reached 83% and 72% of the b⫽1000 images in the lesion and contralateral normal area, re-spectively (Table 3). As the b value increased from 1000 to 2000, the CNR increased by 23% in our study. The observed diagnostic advantage of b⫽2000 images over b⫽1000 images in this study seems to have been caused by this increase of CNR. We speculate that the SNR problem of b⫽2000 images can be partly overcome in the near future by applying parallel imaging techniques combined with a multi-channel head coil, by using a 3T system, or by combining both strategies. However, the actual behavior of image contrast or SNR in those new DW imaging techniques may need further investigation.
1. Mohr JP, Biller J, Hilal SK, et al. Magnetic resonance versus computed tomographic imaging in acute stroke. Stroke
1995;26:807– 812
2. Hacke W, Kaste M, Fieschi C, et al.Intravenous thrombolysis with recombinant tissue plasminogen activator for acute hemispheric stroke. The European Cooperative Acute Stroke Study (ECASS).
JAMA1995;274:1017–1025
3. von Kummer R, Bourquain H, Bastianello S, et al.Early prediction of irreversible brain damage after ischemic stroke at CT.Radiology
2001;219:95–100
4. Aronovich BD, Reider-Groswasser II, Segev Y, Bornstein NM.
Early CT changes and outcome of ischemic stroke.Eur J Neurol
2004;11:63– 65
5. Lev MH, Farkas J, Gemmete JJ, et al. Acute stroke: improved nonenhanced CT detection –Benefits of soft-copy interpretation by using variable window width and center level settings.Radiology
1999;213:150 –155
6. Eastwood JD, Lev MH, Wintermark M, et al.Correlation of early dynamic CT perfusion imaging with whole-brain MR diffusion and perfusion imaging in acute hemispheric stroke.Am J Neuroradiol
2003;24:1869 –1875
7. Shimosegawa E, Inugami A, Okudera T, et al.Embolic cerebral
magnetic resonance imaging.Ann Neurol1995;37:231–241 14. Sorensen AG, Buonanno FS, Gonzalez RG, et al. Hyperacute
stroke: evaluation with combined multisection diffusion-weighted and hemodynamically-weighted echo planar MR imaging. Radiol-ogy1996;199:391– 401
15. Meyer JR, Gutierrez A, Mock B, Hebron D, Prager JM, Gorey MT, Homer D.High-b-value diffusion-weighted MR imaging of sus-pected brain infarction.Am J Neuroradiol2000;21:1821–1829 16. Burdette JH, Elster AD. Diffusion-weighted imaging of cerebral
infarctions: are higher B values better?J Comut Assist Tomogr
2002;26(4):622– 627
17. DeLano MC, Cooper TG, Siebert JE, Potchen MJ, Kuppusamy K.
High-b-value diffusion-weighted MR imaging of adult brain: Image contrast and apparent diffusion coefficient map features. Am J Neuroradiol2000;21:1830 –1836
18. Stejskal EO, Tanner JE.Spin diffusion measurements: spin echoes in the presence of a time-dependent field gradient.J Chem Phys
1965;42:288 –292
19. Desmond PM, Lovell AC, Rawlinson AA, et al. The value of apparent diffusion coefficient maps in early cerebral ischemia.
![2 [(ρ Methoxyphenylcarbonyl)(1,2,4 triazol 1 yl)methyl]sulfanyl 4,6 dimethylpyrimidine](data:image/gif;base64,R0lGODlhAQABAIAAAP///wAAACH5BAEAAAAALAAAAAABAAEAAAICRAEAOw==)