Modelling parking guidance systems in
S-Paramics
Development of an S-Paramics tool to simulate parking guidance
systems
P Centrum Den Helder
200 250
Koninckshoek
Julianaplein
Stadhuis
Sluisdijk
Palmplein
212
85 310
1 2
4 5
6 7
3 Location PGS Signs
MSc Thesis C. Obdeijn
Authorisation
Title Modelling parking guidance systems in S-Paramics
Date May 11, 2011
Author Coen Obdeijn
Committee Prof. Dr. Ir. Eric van Berkum (University of Twente) Dr. Jing Bie (University of Twente)
Ir. Erik Versteegt (Grontmij)
Abstract
Parking problems in city centres, mainly on Saturdays, are a well-known phenomenon. The parking (capacity) problems are illustrated by full car parks, which result in long queues and un-necessary pollution. To reduce parking problems, parking guidance systems (PGS) have been implemented since the 1970s. At first mainly to inform the car drivers, but nowadays municipali-ties try to steer car drivers to gain a better distribution over the different car parks and to reduce ‘searching’ traffic.
The costs of implementing a PGS can however be relatively high. Most of the larger Dutch mu-nicipalities have implemented a PGS in the past, but have not carried out evaluation studies of the effects of PGS on the traffic performance. Medium-sized municipalities (60,000 – 100,000 inhabitants) find it hard to justify the high costs of the implementation of PGS, while the ex-pected effects are not known.
Having a tool, which can estimate ex ante what the effects are of implementing PGS, can help municipalities in the decision on whether or not to implement a parking guidance system. The effects on the traffic performance can for instance be part of a cost-benefit analysis and munici-palities can decide whether an increase in parking fees is justified to finance the implementation of PGS.
Aim of master thesis
Therefore the main objective of this master thesis is to develop an S-Paramics tool for model-ling the effects of the implementation of parking guidance systems on the traffic performance. S-Paramics is a microsimulation traffic modelling software, which is used by many municipalities in the Netherlands for modelling their inner cities. Adding a tool to these models for modelling the effects of PGS can give municipalities a clear insight in the effects of implementing PGS.
Effects of PGS on car drivers
Although evaluation studies with regards to the implementation of PGS have barely taken place, field studies investigating the usage of the information displayed on PGS signs have been car-ried out in multiple cities. The field studies consist of surveys carcar-ried out among car drivers who parked at car parks, which were part of the information displayed on a PGS sign. The different studies show comparable results:
• On weekdays the amount of drivers changing their car park destination, because the PGS sign displayed that their ‘original’ car park destination was full, is ranging from 10% to 16%;
• On Sundays this percentage ranges from 15% to 18%;
• The information displayed on a PGS sign was mainly used by non frequent visiting, shopping traffic from nearby municipalities; habitual behaviour of car drivers was barely influenced by PGS signs;
• The higher share of non-frequent visiting traffic on Sundays causes the higher percen-tage of car drivers which change their parking location based on the information dis-played on a PGS sign.
Development of PGS tool
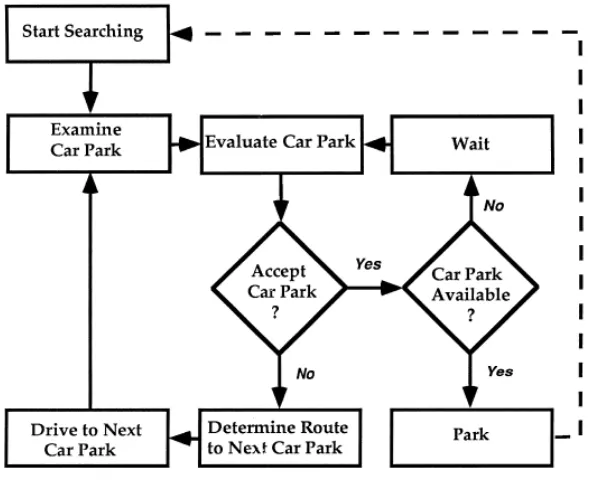
the models try to minimize their total trip costs and chose a car park accordingly. Whether or not the car park has available spaces is an aspect which the car drivers in the model notice once they arrive at the car park. In case of a long queue in front of the car park, the car driver will re-route to another car park. With the addition of PGS to a model, information about the availability of parking spaces is retrieved at an earlier stage by the car drivers.
ITS controllers can be added to an S-Paramics model to represent PGS signs. Car driver beha-viour in the model can be influenced at the locations of the ITS controllers. The influence of PGS on the car driver behaviour in the model is programmed and specified in the developed PGS tool. The outcomes of the earlier mentioned field studies are used as a basis for the de-velopment of the PGS tool and the response of car drivers to PGS signs in the S-Paramics models.
The PGS tool is triggered by S-Paramics once car parks are full and the tool starts rerouting a share of the car drivers to an alternative car park, once their ‘original’ car park destination is full in the model. The share of car drivers which is rerouted reflects the amount of car drivers which in reality change their car park destination, because the PGS sign displayed that their ‘original’ car park destination is full.
Case study PGS tool
Tests on small networks were carried out to verify the functionality of the PGS tool. The test were mainly performed to check whether the tool functioned as intended. Some small adjust-ments were made and finally the PGS tool was applied on a larger network: the model of Den Helder. The model of Den Helder was chosen, because the municipality of Den Helder is cur-rently considering the implementation of PGS.
The developed PGS tool was applied to the model of Den Helder to simulate the difference in the future situation with and without an implemented PGS. The setup of the PGS tool (the loca-tions of the ITS controllers and alternative car parks) was determined in consultation with the municipality of Den Helder. The amount of car drivers which would change their parking loca-tion, when the PGS signs indicate that their original parking location is full, was set to 18%.
Ten simulation runs were carried with and without the application of the PGS tool, by using the same set of ten random seeds. These ten random seeds release the same amount of vehicles per hour, but have a small randomness in the exact release time of vehicles on the network.
For the analysis of the outcomes several traffic performance indicators were analyzed. Signifi-cant differences were found in the traffic performance indicators of which the value is summed up over a time period. The duration of the ‘full time’ of the full car parks dropped with 19.8%, because a share of the car drivers rerouted to alternative car parks. The total travel time within a cordon around the city centre decreased with 4.3% as a result of the reduced waiting times at the full car parks. Significant differences in the traffic intensities were not found, mainly because there was no congestion on the road network in the situation without PGS.
Discussion and recommendations
The final product is a PGS tool which simulates the implementation of PGS on a network. The PGS tool is a simplification of reality and the known effects of PGS. The main strength of the current PGS tool is that is relatively easy to add to an existing S-Paramics model which includes parking.
The possibility to manually set the input of the PGS tool makes it a flexible tool with a clear structure, which can be used for multiple purposes. For instance different advised parking routes (by a PGS sign) to car parks can be evaluated. Or the effect of PGS in case a higher percentage of car drivers drives to an alternative car park based on the PGS information.
just the car park occupancies can be analyzed, but also the traffic intensities and travel times for instance.
The main weakness of the tool is that the tool does not model the effect on ‘searching’ traffic realistically. ‘Searching traffic’ exists of car drivers who are looking for a parking space, might not be familiar with the road network and are sometimes driving around ‘clueless’. The imple-mentation of PGS helps to steer these car drivers towards an available parking space. ‘Search traffic’ is however very hard to model and to measure within the S-Paramics environment. Car drivers in S-Paramics are ‘intelligent’, know the road network and always drive towards their destination. Therefore the modelled effect of PGS on the ‘search’ traffic might be underesti-mated compared to reality.
The developed PGS tool is a product which can still be further developed. For this master thesis the focus was on the development of a PGS tool, which can be used to predict the effects of implementing PGS. The modelled effect of PGS is based on surveys, which investigated the use of the information on PGS signs. This means that the modelled effects of the PGS tool, can be used to make predictions about the implementation of PGS.
The PGS tool can however be calibrated for an existing PGS situation in case municipalities have available of the parking situation before and after the implementation of PGS. Therefore it is recommended to look at the possibilities for calibrating the PGS tool. The setup of the tool remains the same. The additional variables for calibration are then the amount of vehicles re-sponding to the PGS ‘re-routing advice’ and the alternative car parks which are set as ‘advice’. This also opens the possibility to see what the expected effects are, in case the setup of a PGS a the city is changed.
Future developments also offer opportunities for the PGS tool. Dynamic route instructions, based on the traffic situation on the network, are a new development for PGS signs. This is one of the features which can also be incorporated in the PGS tool. The PGS tool can retrieve traffic performance indicators (e.g. traffic intensities, travel times) from S-Paramics and base the route instructions on these indicators.
Table of contents
1 Introduction and research setup ... 13
1.1 Introduction and problem description ... 13
1.2 Study motive ... 15
1.3 Research objective ... 15
1.4 Research questions ... 15
1.5 Report outline ... 16
2 Parking and Parking guidance systems ... 17
2.1 History of parking and parking policies ... 18
2.2 Car park search process ... 19
2.2.1 Choices in car park search process ... 19
2.2.2 Influence of parking fee ... 21
2.2.3 Influence parking location and egress walk time ... 21
2.2.4 Trade-off in car park search process ... 22
2.3 Parking guidance systems ... 22
2.3.1 History of PGS ... 22
2.3.2 Implementation and setup of PGS by municipalities ... 23
2.3.3 Effects of parking guidance systems on drivers car park choice ... 25
2.4 Summary ... 29
3 Parking traffic in microsimulation traffic models ... 30
3.1 Microsimulation traffic and transport models ... 31
3.2 Microsimulation models with parking traffic ... 33
3.2.1 Parking and parking guidance systems modelled in VISSIM ... 33
3.2.2 Parking traffic modelled in S-Paramics ... 34
3.2.3 Elements of car park search process in microsimulation models ... 35
3.3 Base for developing the PGS tool ... 35
3.4 Summary ... 37
4 Development of the PGS tool for S-Paramics ... 38
4.1 Basis for developing the PGS tool ... 39
4.2 Possibilities and limitations for modelling PGS in S-Paramics ... 41
4.2.1 Addition of PGS signs to an existing network ... 41
4.2.2 Modelling influence PGS on trip assignment ... 41
4.3 Basic assumptions for PGS tool setup ... 42
4.4 Translation of the basic assumptions to setup of the PGS tool ... 43
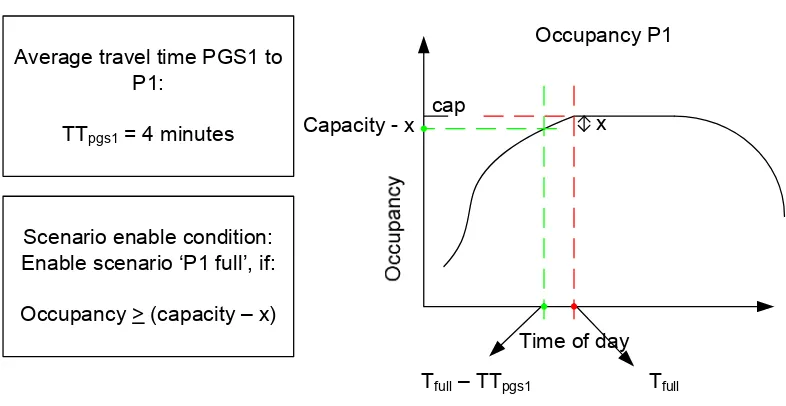
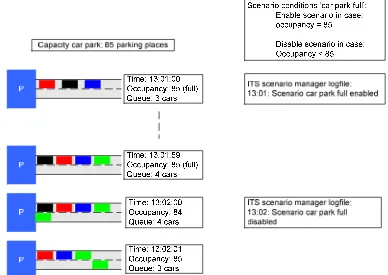
4.4.1 Use of scenarios to represent the ‘car park – available/full’ condition ... 43
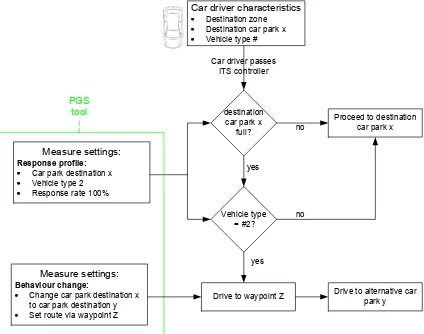
4.4.2 Behaviour change and response to behaviour change ... 45
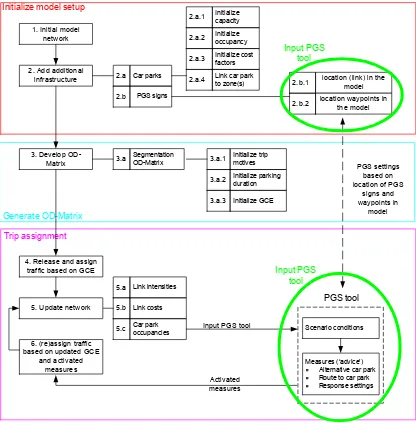
4.5 Input PGS tool ... 48
4.5.1 Model input... 49
4.5.2 XML-code Input for the PGS tool ... 49
5.1.1 Verification tests phase 1 and 2: Enabling/disabling scenarios ... 54
5.1.2 Verification tests phase 3 ... 54
5.1.3 Additional verification tests with multiple ITS controllers ... 55
5.2 Changes in the PGS tool setup... 57
5.3 Summary ... 59
6 Case study: Den Helder ... 60
6.1 Objectives of the PGS tool case study ... 61
6.2 Parking and traffic situation in Den Helder ... 61
6.3 Car park model Den Helder ... 62
6.4 Implementation PGS tool and setup PGS tool for model Den Helder ... 63
6.4.1 Creating a vehicle type proportion ... 63
6.4.2 Location of ITS controllers and waypoints in Den Helder model ... 63
6.4.3 Defining the scenario conditions ... 64
6.4.4 Defining the advice algorithm ... 65
6.5 Analysis outcomes ... 66
6.5.1 PGS tool ‘verification checks’ ... 66
6.5.2 ‘Stability’ of outcomes ... 67
6.5.3 Analyses of the outcomes ... 70
6.6 Discussion results ... 76
6.7 Summary ... 77
7 Discussion and recommendations ... 79
7.1 The final product ... 79
7.2 Weaknesses of the PGS tool ... 81
7.3 Strengths of the PGS tool ... 82
7.4 Recommendations for further development PGS tool ... 83
7.5 Recommendations for further research PGS ... 84
7.6 Recommendations for future application ... 84
Literature list ... 86
Appendix 1 PGS tool verification tests ... 90
Appendix 2: Screenshot Den Helder network ... 101
Appendix 3: Defining Scenario conditions ... 103
Appendix 4: Alternative car parks Den Helder ... 105
Appendix 5: Verification checks PGS tool Den Helder ... 110
List of definitions
Different definitions for terms related to parking guidance systems and the use of the informa-tion of parking guidance systems can be found in literature. Therefore several terms and phrases, which are used multiple times in this master thesis, are defined below.
Parking guidance system (PGS)
The system of all the PGS signs implemented in a city to inform car drivers about the available number of parking spaces at the parking locations in a city.
Parking guidance system sign (PGS sign)
The single PGS sign, which can be found along roads. These signs show the availability of parking spaces at multiple car parks. In other literature the term ‘PGS sign’ is also used to refer to signs inside car parks to guide drivers towards a free parking space within the car park. In this master thesis solely the PGS signs along roads are subject of research and are therefore referred to when this term is used.
Car drivers notice the PGS sign
In case a car driver notices a PGS sign, the driver has seen the PGS sign along the road and the information displayed on the PGS sign.
Car drivers change their parking location based on PGS sign information
After a car driver notices a PGS sign, he or she uses or ignores the information. In this master thesis the following sentence is often used “a car driver changes parking location based on the PGS sign information”. This means the following: The car driver has car park destination P1, but notices on the PGS sign that car park P1 is full. The car driver therefore uses the PGS informa-tion to re-route to an alternative car park, which was not his or her ‘original’ destinainforma-tion.
Alternative car park
The new car park destination of a car driver, after he or she notices that the ‘original’ parking destination is full.
PGS advice (in model)
The developed PGS tool in this master thesis gives ‘advices’. In reality a PGS signs displays information and does not give a real advice. The PGS advice of the PGS tool is an alternative car park, to which the car driver will drive in the model.
Response rate to PGS advice (in model)
Preface
This document presents my master thesis report, which is the final project for receiving the Mas-ter of Science degree in Traffic Engineering and Management at the University of Twente. The master thesis was carried out at Grontmij from September 2010 till March 2011.
At the start of my master thesis I expected that switching from the ‘student life’ to a ’40 hours per week office job’ would be hard. The nice working environment provided by my colleagues at Grontmij however ensured that spending 40 hours per week at the office was not that hard after all. Therefore I would like to thank all my colleagues of the division ‘Mobiliteit’ at Grontmij and some of them I would like to thank in particular.
First of all I would like to thank Erik Versteegt, my supervisor at Grontmij. He gave me construc-tive criticism on my working documents and was always available to give advices for the prob-lems I ran into during my master thesis.
I would like to thank my ‘office roommates’ Arie Pols and Thomas Rook which had a large share in the nice working environment at Grontmij. I also really appreciate the help of Arie, who helped me to gain more acquainted with the S-Paramics software.
Other colleagues I would like to thank are Jeroen de Wit, Wouter Mieras, Hans Drolenga, Wim Husen and Falco de Jong for their help and time to answer my questions during my master the-sis.
Introduction and research setup
1
Introduction and research setup
1.1 Introduction and problem description
The Netherlands has 16.5 million parking spaces, which is more than twice as much as the total number of cars possessed (7.6 million) by the Dutch population (CBS, 2010).Six out of ten Dutch car drivers however think, that finding a car space will be a major problem in 2020 (Goudkade and Snel, 2010).
Field studies support that finding a parking space will not only be a problem in 2020, but cur-rently already is the case in many occasions. In extreme situations it was found that up to 74% of the traffic on the road was ‘search traffic’ and thus driving around and looking for a parking place (Shoup, 2007).
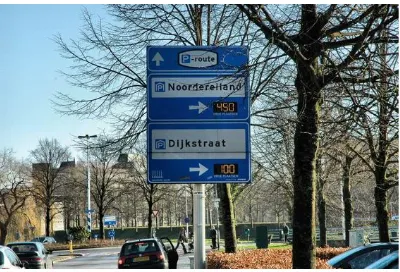
[image:13.612.107.507.333.605.2]An answer to this problem was the introduction of parking guidance systems (PGS). These sys-tems consist of multiple PGS signs placed along the roads. These signs show whether any parking spaces are available or the number of available parking spaces in car parks. The signs also show the route towards the car parks.
Figure 1-1: Parking guidance system
Introduction and research setup
The unclear effects and high costs of the implementation of parking guidance systems is also reason for Dutch municipalities for not implementing the system (Gemeente Ede, 2004). Dijkshoorn (2002) carried out a survey in The Hague and Rotterdam. This survey showed that about 15% of the car drivers used the information displayed on the PGS signs to reroute to an-other car park, in case their ‘original’ car park was full. This however does not give a clear indi-cation of what the effect on the traffic performance is.
To gain more insight in the effect of parking guidance systems on drivers, road traffic mi-crosimulation software can be a useful tool. In road traffic mimi-crosimulation software, the driver behaviour of single vehicles is modelled and visualized in a road networks (see Figure 1-2). The cumulative effect of these single vehicles represents traffic flows on a physical road network. (SIAS Limited, 2009). Simulation runs can show the consequences of changes in the traffic op-eration (e.g. a change from an unsignalised to a signalised intersection) on the traffic flows. These consequences can be analyzed with the outcome data of the simulation runs, which is shown on the right pictures of Figure 1-2. The pictures and figures shown in Figure 1-2 are screenshots of the microsimulation software S-Paramics.
Figure 1-2: Visualisation of microsimulation models (source: www.sias.com)
Microsimulation traffic models are able to cope with intelligent transport systems and thus park-ing guidance systems, which makes them a useful tool for modellpark-ing the effect of parkpark-ing guid-ance systems on parking traffic.
Currently a few microsimulation studies have been carried out, which deal with parking traffic. These studies investigated the effects of parking planning policies, because parking policies can have multiple effects on the transport chain, such as:
• the final choice of destination: can be influenced by the costs and availability of park-ing spaces;
• route choice: in case of a limited amount of available parking spaces, car users will start looking for parking spaces at the destination;
• travel mode; in some cities parking policies for the inner city aim to keep out the cars of the inner city and to stimulate the use of public transport (Tamminga, de Jong and Zee, 2005).
Introduction and research setup
1.2 Study motive
Larger municipalities in The Netherlands claim that PGS helps improving the traffic circulation and reducing the parking problems in inner cities, but that the exact effects are unclear. A better insight in the effects of parking guidance systems can help medium-sized municipalities in the decision on whether or not to implement PGS.
Microsimulation traffic models are able to cope with parking guidance systems and parking traf-fic. Currently there is however little to no attention for parking guidance systems in microsimula-tion traffic models. When the effects of PGS are modelled in microsimulamicrosimula-tion traffic models a better insight in the effects on the traffic performance of these systems can be gain.
1.3 Research objective
Having a tool, which can estimate ex ante what the effects are of implementing PGS, can help municipalities in the decision on whether or not to implement a parking guidance system. There-fore the objective of this master thesis is:
“Developing an S-Paramics tool for modelling the effects of the implementation of parking guidance systems on the traffic performance”
1.4 Research questions
The main research question of this master thesis is:
How can the effects of implementing a parking guidance system on the traffic performance be modelled in an S-Paramics environment?
To gain an answer on the main research question, the following seven research questions are formulated:
• What aspects of parking policies influence the parking behaviour of car drivers? • What is the influence of PGS on driver and parking behaviour?
• Which S-Paramics models including parking behaviour are available?
• What are the possibilities for modelling the influence of PGS on driver behaviour in these microsimulation models?
• How can the effects of PGS on driver behaviour be modelled, taking into account the possibilities and limitations of S-Paramics?
• Which traffic performance indicators can be used to get an insight in the effects of PGS?
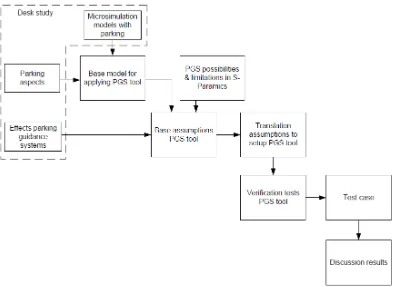
Figure 1-3 illustrates the research model which is related to these research questions. It is an overview in which the following different steps can be distinguished:
• A desk study: The aspects of parking, parking guidance systems and transport mod-els will be investigated to gain insight in the aspects which are of importance for de-veloping the PGS tool;
• PGS tool development: Based on the desk study and knowing the limitations and possibilities of S-Paramics, the setup for the PGS tool is developed;
• PGS tool verification testing: The developed PGS tool is verified; test are performed to check whether the tool functions as intended;
Introduction and research setup
Figure 1-3: Research setup
1.5 Report outline
The different steps of this master thesis are discussed in 6 chapters
• Chapter 2: Parking and parking guidance systems. This chapter discusses the im-portant aspects related to parking and parking guidance systems.
• Chapter 3: Parking traffic in microsimulation traffic models. This chapter discusses the structure of microsimulation models which currently include parking traffic.
• Chapter 4: Development of the PGS tool for S-Paramics. This chapter discusses the input which leads to the base assumptions for the PGS. These assumptions are then translated to the setup of the PGS tool, taking into account the possibilities and limi-tations of S-Paramics.
• Chapter 5: Verification and testing PGS tool. This chapter describes the verification tests of the PGS tool and tests whether the tool functions as intended.
• Chapter 6: Case study Den Helder. In this chapter the PGS tool is applied to the the model of Den Helder. It is a demonstration of the application of the PGS tool and the possibilities for analyzing the effects are discussed.
Parking and Parking guidance systems
2
Parking and Parking guidance systems
This chapter discusses the aspects related to parking and PGS and gives an answer to the two research questions:
•
What aspects of parking policies influence the parking behaviour of car drivers?•
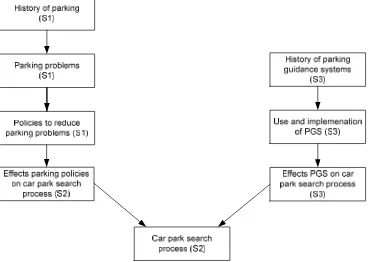
What is the influence of PGS on driver and parking behaviour?It is a summary of a desk study carried out for this master thesis. This chapter contains three subjects which are interlinked to each other as is shown in Figure 2-1.
The three subjects are described in the three sections of this chapter:
• Section 1: gives a brief introduction about parking and the start of parking problems in the past century. Secondly the policy measures of municipalities to reduce the parking problems in inner cities are described.
• Section 2: describes the effects is of measures taken by municipalities. First an over-view is given of the car park choice process of car drivers and what aspects play a role in this choice process. These aspects are influenced by policies of municipalities and these influences are briefly described.
[image:17.612.109.478.413.675.2]• Section 3: gives a brief description of the history of PGS is given. Secondly the reasons for implementing PGS and the setup of PGS’s are described. Thirdly the known effects of PGS on the car park choice process of car drivers are discussed.
Parking and Parking guidance systems
The next chapter discusses the already available microsimulation models which include parking. Chapter three also describes which of the aspects related to the car park search process are included in these models.
2.1 History of parking and parking policies
Finding a parking space is not just a problem which is faced by car drivers nowadays, but has been a problem in the past century. “Where shall they park?” was already the title of United States Conference of Cities in 1928 after parking cars started to obstruct traffic flows. This was a consequence of the growth in car ownership (Holtz Kay, 2001).
The growth in car ownership increased significantly during the 20th century (CBS, 2010). In the 1970s attention rose for the pollution of the environment, as a consequence of population growth, industrialization and depletion of natural resources. Substantial public awareness was created when the Club of Rome published its report Limits to Growth in 1972. This report stated that economic growth could not continue indefinitely, because of the limited amount of re-sources.
Although the increase in car possession contributed to the depletion of natural resources, most cities expanded their parking infrastructure to facilitate car drivers in inner cities. This facilitation contributed to the increase of congestion in inner cities, which had a negative impact (such as smog) on liveability. During the nineties this was the reason for several cities to redevelop their inner cities (European Commission, 2001).
As a result several Western and Northern European cities started redeveloping their inner cities, in order to regenerate the city centres and create a more sustainable transport system: the city centres were restricted for cars and space was created for pedestrians and cyclists to reduce the environmental impacts of car traffic.
Redeveloping an inner city is a rather radical approach, but since the seventies a switch in the Netherlands is noticed with regards to the facilitation of parking places in city centres. Two main policies for the distribution of parking places can be distinguished:
• A steering parking policy: a policy aiming to reduce car use, by minimizing the amount of parking places;
• A demand following parking policy: a policy aiming to provide the car users with parking spaces where needed, which means that the supply of parking places meets the demand (van Dijken, 2002).
Until the end of the seventies most of the Dutch Municipalities had demand following parking policies, to provide the car drivers with parking spaces. From the mid seventies Dutch munici-palities started to apply steering parking policies. This was part of the overall car and mobility policy, which was aiming to minimize the growth in car possession (van Dijken, 2002).
Nowadays municipalities often apply a policy in which a balance between the demand and sup-ply is found. The municipalities try to meet the parking demand and to find an ideal combination between the accessibility and liveability of an area (CROW, 2003).
In the Netherlands the guidelines of the CROW are used to determine the amount of parking spaces, which meets the demand. These guidelines take into account the function of the area and/or building and the location. With these guidelines, municipalities often calculate the mini-mum and maximini-mum needed amount of parking places. The municipality can then determine the exact number of parking spaces, which is dependable on the available space, parking policy and the revenue generation (Van der Heijde, 2010).
Parking and Parking guidance systems
[image:19.612.107.304.109.316.2]parking as a ‘right’. According to a case study of Shoup (1997) parking spaces constructed cost at least $124 per space per month. These costs consist of construction, maintenance and moni-toring and are included in this price and are distributed over the whole life cycle of the parking place.
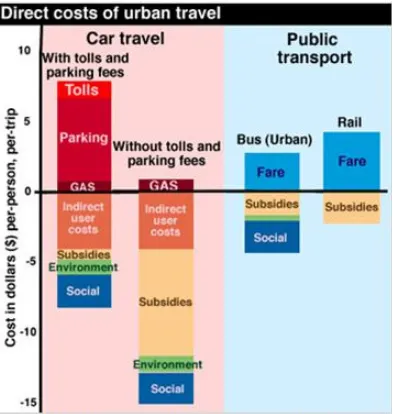
Figure 2-2: The costs of parking (Vuchic, 1999)
Figure 2-2 shows the costs of a car trip compared to a public transport (PT) trip in the United states. The ‘negative costs’ show the costs that are made, but for which the car driver or PT user does not pay. These costs for instance include environmental damage as a consequence of the car trip made. The costs for the parking place are also part of the total trip costs. This fig-ure states that in case parking is free, it is actually subsidized by the government. Van Dijken (2002) concluded that the ‘Dutch taxpayers’ subsidise parking places with 500 Euros per year per parking place.
Parking fees can be a powerful policy measure for municipalities in discouraging car drivers to park at certain location or travel by car at all. In the Netherlands parking tariffs are part of the parking policy and are also influenced by the political ideas of a city council. For instance Am-sterdam has the highest tariffs of the Netherlands, because the city aims to reduce the amount of cars in the inner city. The final tariff is also determined by the revenue which it generates. Often municipalities try to find a balance between the occupancy level and the revenue gener-ated for the parking tariff. Ideally the parking lots have occupancy levels close to 90%, so they generate sufficient revenue and there is still space for car drivers searching for a parking place (van der Heijde, 2010).
2.2 Car park search process
Section 1 gives a short introduction to parking policies and how municipalities try to steer the parking demand by determining the location and number of parking places and applying parking fees. This raises the question if and how it influences car drivers in their car park choice. There-fore this section describes the car drivers search process and how different elements influence this search process.
2.2.1 Choices in car park search process
Parking and Parking guidance systems
Figure 2-3: behavioural car park search model by Thompson and Richardson (1996)
[image:20.612.114.411.61.308.2]The factors influencing search and parking behaviour are categorized in three dimensions by Thompson and Richardson (1996) and illustrated in Figure 2-4. The first dimension is ‘Access’, which contains the two parameters ‘In-Vehicle Travel Time’ and ‘In-Car Park Search Time’. These parameters take into account the time spent travelling to a car park and the time search-ing for a parksearch-ing space in a car park. The second dimension ‘Waitsearch-ing’ contains the waitsearch-ing time, which is the queuing time of a vehicle in front of a parking lot or parking space. The third dimen-sion ‘Native’ contains the parameters related to the usage costs and contains the parking fee, expected fine and the egress (walk) time.
Parking and Parking guidance systems
In this behavioural model, drivers try to minimize the disutility of using a car park by minimizing the cost factors of Figure 2-4. This means that a trade-off is made between the different cost factors:
• Direct parking fee; • Expected fine; • Egress (walk) time;
• Waiting time (queuing time); • In- car park search time; • In-vehicle time to car park.
Not much research is carried out to the driver behaviour towards the aspects: expected fine, queuing time and in-car park search time. These aspects are therefore left out of this literature study. The ‘vehicle time’ to the car park is part of the total trip costs and therefore not in-cluded in this literature study with regards to parking. This means that the following costs as-pects related to parking are summarized in this section:
• Parking fees; • (Egress) walk time;
2.2.2 Influence of parking fee
Parking fees are an importing factor in managing travel demand, since it can change the ing location and mode selection (Feeney, 1989 and Young 1990). An increase of 10% in park-ing fees regionally decreases the car usage by 3%, accordpark-ing to Goudappel Coffeng (2001). According to the CROW (2001) there is however a difference per trip motive, for example the car usage for the trip motive shopping barely decreases, in case of an increase in the parking fee.
This is also supported by Vaca and Kuzmyak (2005) who compared several case studies and concluded that the price elasticity of vehicle travel with respect to parking price ranges from – 0.1 to –0.3. This means that a 10% increase in parking charges, reduces the amount of vehicle trips by 1% to 3%. The price elasticity however depends on demographic, geographic, travel choice and trip characteristics. If for instance pricing is applied to commuter parking, it is espe-cially effective at reducing peak-period travel.
Besides raising the parking fee, a parking fee can also be introduced. This means that the park-ing situation shifts from free parkpark-ing to cost-recovery parkpark-ing. In case of cost-recovery parkpark-ing the parking prices reflect the full costs of providing parking facilities. This shift reduces com-muter traffic by 10% to 30% (Comsis Corp., 1993 & Hess, 2001).
Hensher and King (2001) however state that priced parking in just one area may simply shift vehicle trips to other locations with little reduction in overall vehicle travel. This was also sup-ported by Gillen (1978) who stated that an increase in parking fees in a central business district (CBD) would lead to a relocation effect to the fringe of the central business district (CBD).
2.2.3 Influence parking location and egress walk time
The location of a car park also has an influence on the car park search behaviour. Drivers try to minimize their travel costs, which means they make a trade-off between the parking fees and the walking distance from the parking place to the destination. Gillen (1978) determined the full price elasticities of parking including the walking distance for a case study. The elasticities are shown in Table 2-1.
Table 2-1: Parking choice elasticities (Gillen, 1978)
Distance from des-tination
Elasticity
parking fee egress time full costs
< 1 block -0.24 -0.53 -0.75
< 2 blocks -0.35 -0.44 -0.78
Parking and Parking guidance systems
The table shows that the full costs elasticities are nearly stable. The different elasticities how-ever state that drivers parking close to the destination (< 1 block) are less sensitive to an in-crease in the parking fee and more sensitive to an inin-crease in the walking distance. While driv-ers parking further away are more sensitive to an increase in parking fees and less sensitive to an increase in walking distance.
A stated preference survey carried out by Goudkade and Snel (2010) shows that 80% of the car drivers are willing to walk 15 minutes from an alternative parking place, in case the total parking costs are increased by €5. This price difference is only achieved, when car drivers park for a longer period. Car drivers with the trip motive shopping, in general, park for a shorter period. Car drivers with the trip motive work, in general, park for a longer period and seem therefore more likely to reach this price difference of €5. The CROW (1996) also concluded that car driv-ers are also willing to walk a longer distance, in case their total parking duration increases.
The same stated preference survey of Goudkade and Snel (2010) looked at the willingness to pay for parking for different trip motives. The survey outcomes show that the willingness to pay for parking at more frequent trips, such as shopping at the supermarket, is lower than less fre-quent trips such as ‘going out’.
2.2.4 Trade-off in car park search process
Thompson and Richardson (1996) state that car drivers try to minimize the total disutility of us-ing a car park. The previous sub-sections show that minimizus-ing the disutility in this case, often exists of making a trade-off between the different parking costs.
Based on the maximum distance car drivers are willing to walk, a number of car parks close to their destination can be selected. Subsequently the trade-off is made between the parking fee and the walking distance for the choice in the final parking location.
For the selection of possible car parks the in-vehicle time is also a cost factor in the model of Thomspson and Richardson. Car drivers try to minimize their total travel time and will therefore in the selection process of car parks mainly pick the car parks which they consider as car parks within a reasonable travel time.
The exact trade-off and choice of car park is also determined by the characteristics of a car driver. As shown in the previous sub-sections some drivers are more willing to pay than others. The characteristics which are of importance are the trip motive, trip frequency and parking dura-tion.
2.3 Parking guidance systems
Not only did municipalities use the supply in parking places and parking fees to influence the parking behaviour. Since the seventies also dynamic traffic management measures were im-plemented. Dynamic route information panels were implemented to provide road users with ‘live’ information about the situation on the roads and in the parking lots. To inform car drivers about the available parking spaces PGS signs were implemented.
This section describes the several aspects of PGS. First a brief summary of the history of PGS is given. Secondly the reasons for implementing PGS and the setup of the PGS are described. Finally the effects of the implementation of PGS are discussed in the final sub-section.
2.3.1 History of PGS
In The Netherlands the first static PGS’s were traffic signs indicating where the nearest parking places are located. Because these ‘systems’ were static traffic signs, they did not include any information about the available empty parking spaces (Jogems and Spittje, 2005).
Parking and Parking guidance systems
able’. These systems were not used to steer car users, but mainly to inform them (Jogems and Spittje, 2005).
During the nineties a second generation of PGS’s was introduced in The Netherlands. Because of a better algorithm and an increase in the calculation capacity of computers, these systems did now show the number of available parking spaces. Besides the number of available parking spaces, also additional information can be displayed on this second generation of parking guid-ance systems. This can be information such as the opening hours of parking lots and informa-tion about the possibilities of public transport from park and ride locainforma-tions (Jogems and Spittje, 2005).
Figure 2-5 shows the difference between the PGS signs in the seventies and the nineties in Zwolle. The PGS sign shown on the left only shows whether places are available in the car park and where the car park is located. On the right the PGS sign is shown, which also shows the amount of parking places available.
Figure 2-5: PGS signs: left 1970s, right 1990s (sources: Insta.nl & ANWB.nl)
2.3.2 Implementation and setup of PGS by municipalities
Currently most of the larger Dutch Municipalities have parking guidance and information sys-tems in their municipality. Municipalities often distinguish different reasons for implementing the PGS.
Dijkshoorn (2000) interviewed several Dutch municipalities and distinguished five main different reasons for installing parking guidance systems. Below the reasons are mentioned and the per-centages show the perper-centages of municipalities which mentioned the reason:
• More efficient use of parking lots (73%);
• Prevent/reduce the queuing line at the parking lots (33%); • Reduce amount of ‘searching’ traffic (20%);
• Steering and guiding traffic (20%);
• Possibility to stimulate the use of public transport (13%).
For instance the municipality of Amsterdam started in 2002 with the ‘Integrated Dynamic Park-ing Guidance systems’ (IDP). The aims of these systems were to:
• Steer car drivers who are less familiar with (the infrastructure of) Amsterdam; • Helping all car drivers in finding an empty car space.
This should overall lead to a reduction of car drivers searching for parking space, which can create dangerous situations on the roads and causes more (unnecessary) emissions.
Parking and Parking guidance systems
all the three ring roads (outer ring road A10, city centre ring road S100 and the inner ring road) parking guidance systems guide and try to steer car users to the most nearby parking places. By already doing this on the outer ring road the municipality of Amsterdam tries to encourage car drivers to use the Park + Ride facility and thus let these car drivers use the public transport to the city centre (Sources: Amsterdam.nl and Dienst Infrastructuur Verkeer en Vervoer (2006)).
A slightly different approach is taken by the Municipality of Rotterdam, a city which is known as a more ‘car-friendly’ city. Their aim is to let car drivers themselves decide where to park and to prevent rat-runs. (Gilbers and Deckers, 2008).
The displays of the newest PGS show the expected numbers of free parking spaces, which the car driver will observe once he/she arrives at the car park (Dijkshoorn, 2000). Lately a new de-velopment in the PGS is the use of dynamic route panels. These panels can show different routes to a parking lot, in case roads on other routes are either congested or closed (Gilbers and Deckers, 2008).
Besides the amount of available parking places and the route to the parking lots, also additional information is sometimes displayed. This is shown at the PGS sign in Figure 2-6. This sign also shows the bus frequency (3 times per hour) at the Park + Ride location (“Parkeerbus elke 20m”). Displaying this information could possibly stimulate the use of public transport, which was also one of the reasons mentioned by 13% of the interviewed municipalities by Dijkshoorn (2000).
Figure 2-6: Example of additional information displayed on PGS
One of the reasons mentioned by municipalities for implementing parking guidance systems is to reduce ‘searching traffic’. The amount of ‘searching traffic’ can be substantial; studies how-ever show big differences in this amount. Shoup (2007) made an overview of studies in the past which showed that the percentages of drivers driving around and looking for a parking space could add up to 74%.
Parking and Parking guidance systems
2.3.3 Effects of parking guidance systems on drivers car park choice
Although several studies with regards to the response of drivers to parking guidance systems are available, evaluation studies with respect to the effects of parking guidance systems on the traffic performance are limited. Mcdonald and Chatterjee (2000) state that the effect of parking guidance systems is more significant in places where the parking demand is higher. The sur-veys held in Southampton showed that the average search time for a parking place was re-duced from 2.2 minutes to 1.1 minute as a consequence of the parking guidance system.
Similar studies with regards to Dutch municipalities are not found. Dijkshoorn (2000) already concluded that there barely had been any evaluations of the implementation of parking guid-ance systems, regardless of the high costs of the implementation.
Evaluating the effect of parking guidance systems is however hard. It is hard to proof that changes in the traffic performance are the result of just the parking guidance systems, while multiple factors can contribute to this improvement of the traffic performance.
Therefore this sub-section focuses on the results of field studies, which interviewed car drivers and asked them about their response to the displayed information on the PGS signs.
Influence of PGS on car park choice process
Thompson and Richardson (1996) state that the estimation of the parameters is in some cases subjective and based on perceptions formed by drivers. The perception is formed by the initial perception, observations during previous trips and observations made during the current trip.
The perception during the current trip is influenced by the PGS signs. As shown in Figure 2-7, the PGS sign influences the information about the available parking places at an earlier time, than at the entrance of the car park.
Using this model the car drivers still has two options in case he or she notices the PGS and his/her car park is full. The question now is:
• Will the car driver drive to the full car park?; or • Will the car driver drive to an alternative car park?.
Influence PGS
Parking and Parking guidance systems
Field study results: Effects of PGS on car park choice
The extent to which PGS influences driver behaviour was subject of several field studies. Figure 2-8 and Figure 2-9 show an overview of the outcomes of five different field studies with regards to parking guidance systems and the amount of drivers using the systems. For these field stud-ies surveys were held among car drivers, who parked at car park which were linked to a PGS. The figures show an overview of:
• the percentage of car drivers noticing the PGS sign;
• the percentage of car drivers changing their car park destination, because the PGS sign displayed that their ‘original’ car park destination was full.
These percentages are the percentages of the total amount of car drivers. E.g. in the case of Rotterdam and The Hague 71% of the total amount of car drivers noticed the PGS sign and 15% of the total amount of car drivers changed their parking location, because the PGS sign displayed that their ‘original’ car park destination was full.
Five field studies of two Japanese and three European cities are compared. These are the cit-ies:
• Frankfurt (Germany – Europe; Axhausen, Polak, Boltze and Puzicha (1994));
• Utsunomiya (Japan – Asia; Thompson, Takada and Kobayakawa (1999));
• Southampton (England – Europe; Mcdonald and Chatterjee (2000));
• Shinjuku (Japan – Asia; Thompson, Takada and Kobayakawa (1999));
• The Hague and Rotterdam (The Netherlands – Europe; Dijkshoorn (2000)).
The outcomes of the five different studies show comparable results. For weekdays the amount of drivers changing their parking location, based on the PGS information (which displayed that their ‘original’ car park was full) is ranging from 10% to 16% and on Sundays from 15% to 18%.
Parking and Parking guidance systems
Figure 2-9: Effects of PGS on Sundays
This difference between the effect on weekdays and Sundays can be explained by the composi-tion of the traffic of both days. Different researches (Mcdonald and Chatterjee (2000), Thomp-son et al. (1999), Dijkshoorn (2000)) investigated the relationship between car driver character-istics and the use of PGS. It was found that:
• Car drivers who make the trip on a low frequent basis notice the PGS signs less of-ten, than car drivers who make the trip on a frequent basis;
• Car drivers who make the trip on a low frequent basis change their parking location based on the PGS information more often, than car drivers who make the trip on a frequent basis;
• Car drivers who are less familiar with the destination area are more likely to use the PGS information displayed, than car drivers who are familiar with the destination area.
This can be illustrated by some of the outcomes of these studies:
• Southampton: 2% of regular visitors changed parking location, while 28% of irregular visitors changed parking location after they saw that their original parking destination was full (Mcdonald and Chatterjee, 2000);
• Shinjuku: The percentage of drivers changing their parking location based on the PGS information on Sundays was related to trip motive, frequency and origin. PGS was more used by non frequent visiting, shopping traffic from nearby municipalities (Thompson et al. 1999);
• The Hague and Rotterdam: The PGS information is mainly used by non-frequent visitors of the area. The habitual behaviour of frequent visitors was barely influenced by the PGS (Dijkshoorn, 2000).
The studies which compared Sundays with weekdays concluded that:
• On Sundays there is a higher share in the traffic composition of car drivers who make their trip on a non-frequent basis and are less familiar with the neighbourhood; • This difference in traffic composition leads to:
Parking and Parking guidance systems
° A higher percentage of the car drivers changes their parking location based on the displayed PGS information on Sundays, than on weekdays.
One study which found significant different numbers, is a survey carried out in Valencia (Spain). The survey was carried out among 600 car users and found that 89% of the drivers noticed the parking guidance systems in Valencia and about 30% used the information (Mcdonald and Chatterjee, 2000). The survey questions were however formulated different for this particular survey. The percentage of 30% ‘using’ the information also includes the car drivers who ‘use’ the information as a confirmation of their car park choice. E.g. a car driver has car park A as destination and sees that car park A still has enough spaces free on the PGS sign.
Reasons for not using the displayed information by car drivers
What might be surprising is the high amount of car drivers who do change their car park loca-tion, once it shows that their ‘original’ destination car park is full. Three main reasons can be distinguished for car drivers not using the displayed information.
• The first reason is already shown in the percentages and is the fact that 20% to 35% of the car drivers do not notice the PGS signs.
• Secondly not all drivers attach high credibility to the information displayed. For instance Dijkshoorn (2000) concluded that for one of the parking lots, the displayed information on the PGS did not match the reality for a high percentage of the car drivers (49%). In most cases the PGS stated that the parking lot was full, while there were still parking places available when the drivers arrived. This experience can withhold car drivers in future situations to use the information of parking guidance systems.
• Thirdly car parks in shopping areas (especially with supermarkets) have high turnovers. Car drivers who are familiar with the parking facility know that due to the high turnover the queuing time is relatively short. The car drivers are willing to wait this short time to finally park at their first choice location.
The way the information is used by the car drivers
How the information displayed on the PGS signs is used by the car drivers is location specific. The different researches mentioned in this section state that the car drivers use the information to drive to an alternative car park.
There is however not much found in the field studies about this exact choice of this alternative car park. The research of Thompson et al. (1999) states that the alternative car park is in most cases a car park in the same destination zone close to their original car park.
Increase in use of PGS information in future?
A new development is the addition of parking guidance systems to in-car navigation systems. Q-park is one of the private operators of car parks in The Netherlands, which currently devel-oped applications for (smart phone) navigation systems for parking guidance. Currently the Mu-nicipality of Maastricht is carrying out a pilot, providing the PGS data to the navigation systems. The in-car system then automatically changes the parking destination, once the original car park destination is full (Verkeersnet, 2010).
Parking and Parking guidance systems
2.4 Summary
This chapter briefly summarizes the desk study carried out for this master thesis. First it gives a brief introduction to parking, how parking problems started and how municipalities try to reduce these problems.
The effect of the policy measures implemented by municipalities is described in the second sec-tion. In this section the car park choice by car drivers is also described. The final choice in a car park is mainly determined by the travel time to the car park, the egress walk time from the car park to the destination and the parking fee. The location of car parks and the parking fees can be influenced by municipalities. Car drivers finally make the trade-off between the different as-pects in choosing a parking destination.
Whether or not a car park is available also plays a role in choosing a car park. Car drivers how-ever only know this once they arrive at a car park or when they pass a PGS sign. Therefore the third section focuses on the effects of PGS. It was concluded that about 15% to 18% of the car drivers change their car park destination, in case they see that their first car park choice is full on a PGS sign. The information displayed on a PGS sign was mainly used to change the park-ing location by non frequent visitpark-ing, shopppark-ing traffic from nearby municipalities.
Parking traffic in microsimulation traffic models
3
Parking traffic in microsimulation traffic
models
Chapter 2 discussed the aspects of parking and parking guidance systems. Different microsimu-lation models have implemented the aspects of parking. This chapter gives a short overview of microsimulation models which include parking and answers the question:
•
Which S-Paramics models including parking behaviour are available?To reach answer this question three steps can be distinguished in this chapter.
• Section 1: gives a brief summary of the structure of traffic and transport models and in particular microsimulation models.
• Section 2: analyses the available microsimulation models which include parking. • Section 3: compares parking microsimulation models with ‘regular’ microsimulation
models. This leads to an overview of the additional elements of microsimulation models which include parking.
Figure 3-1: Overview structure chapter 3
Parking traffic in microsimulation traffic models
3.1 Microsimulation traffic and transport models
Transport models are used to predict the future traffic situation, or the expected traffic situation in case infrastructural changes are made. The first transport modelling techniques originate from the 1960s. The structure used for transport models in the 1960s is however still used nowadays. Many transport models are derived from the classic four-stage model, which is shown in Figure 3-2 (Ortúzar & Willumsen, 2002).
Figure 3-2: Classic four-stage model (Ortúzar & Willumsen, 2002; Allen, J. 2009)
The first step in this four-stage model is to collect data and the networks of an area. The net-work is divided in zones, which represent a smaller part of the area. The gathered data includes population numbers, economical activities (employment, shopping space, educational and rec-reational facilities). Once this data is gathered four steps are undertaken:
• Trip generation: the data gathered is used to determine the total number of trips generated and attracted by each zone in the network;
• Trip distribution: the allocation of the trips to particular destinations to produce a trip matrix;
• Modal split: the allocation of the trip matrix to different transport modes;
• Assignment: The assignment of each trip to the corresponding networks (Ortúzar & Willumsen, 2002).
When these steps are carried out an overview is gain of the expected traffic flows on a network. The scope of the model and the level of detail can however differ. Three scales for traffic and transport modelling are often distinguished:
• Microscopic simulation: Microsimulation is the dynamic and stochastic modelling of individual vehicle movements. Within a transport network each vehicle is moved ac-cording to the physical characteristics of the vehicle (e.g. length, max speed, etc.), the fundamental rules of motion (e.g. velocity times time equals distance, etc.) and the rules of driver behaviour (lane changing, etc.). The cumulative effect of these single vehicles represent the flows on a network.
Parking traffic in microsimulation traffic models
other. In contrary to microsimulation models, macroscopic models cannot model the interactions of vehicles on alternative design configurations.
• Mesoscopic simulation models: Mesoscopic models combine the properties of both microscopic and macroscopic simulation models. Individual vehicles are modelled, but describe their activities and interactions based on aggregate macroscopic relationships (SIAS (2009) and Caltrans (2008)).
This master thesis focuses on the use of dynamic microscopic road traffic simulation software, In a microsimulation model roughly three different phases can be distinguished:
• Model network setup
In a microsimulation model the network of an area is built. The network consists of the road network and includes the roads which are considered of importance for the study area. Part of the building of the network is also the allocation of the cost factors to the roads. Zones are added to the road network and function as origin and destination zones. The zones represent a smaller area of the total modelled area.
•
Develop OD-matrixParking traffic in microsimulation traffic models
•
Trip assignmentIn road traffic microsimulation software single vehicles are released onto the network. The cumulative effect of these vehicles represent the traffic flows on the network. The number of vehicles released on the network is determined in the OD-matrix. In the as-signment stage it is determined how vehicles route through the network. The route cho-sen is based on the lowest costs for the single vehicle, taking various costs into account (SIAS, 2009).
3.2 Microsimulation models with parking traffic
The majority of microsimulation models do not include parking traffic. In these models vehicles ‘disappear’ from the network once they have reached the destination zone. In case car parks are added to a modelled network, drivers park in a car park linked to their destination zone. Still the vehicle will ‘disappear’ in the car park, but will however not be able to enter (‘disappear” in) the car park once it is full. There are several examples of microsimulation models which include car parks and the car park choice.
This section discusses one example of a VISSIM model which included parking and parking guidance systems and three examples of S-Paramics models which included parking. Examples of these cases are the models developed for the municipalities of Rochdale, Takapuna and Nieuwegein.
3.2.1 Parking and parking guidance systems modelled in VISSIM
Schipper (2001) investigated the possibilities and options for modelling parking traffic and park-ing guidance systems for the road traffic microsimulation software VISSIM. Schipper used a case study to test several options of modelling the parking behaviour. In this case study a dif-ferentiation was made per trip motive in the OD-matrix. A different search profile was attached to every trip motive. For instance commuter traffic had already determined their parking location pre-trip, while cars making leisure trips would travel to the destination zone and chose the car park while they were close to the location. The outcomes of the model showed significant differ-ences with the actual data. The major shortcomings of VISSIM (in version 3.50) were:
• There was no possibility of setting an entrance capacity (maximum of cars that can enter the car park per hour). Car parks with a barrier at the entrance have a lower entrance capacity, but this could not be set. Therefore the modelled queue could be lower, than the actual queue;
• VISSIM first determined which car park would be used per car driver, based on the car park costs, and then determined the route to the car park. VISSIM did not in-clude the car park choice as a part of the total trip choice;
• There was no possibility for displaying information of multiple car parks on one vari-able message signs.
Schip-Parking traffic in microsimulation traffic models
per (2001). Besides the limitations of VISSIM, the structural the errors between the model and the reality were caused by:
• The ‘return trip’ of parking traffic was not based on the arrival time and parking dura-tion;
• The influence of PGS on drivers was not known exactly and an assumption was used.
Based on the differences between the model results and the reality Schipper (2001) stated that the model could not be used to estimate the amount of search traffic and the queues in front of car parks. To improve the model predictions Schipper (2001) formulated the following recom-mendations:
• Include the cost factors of car parks within the total trip cost equation for the car park choice in the model;
• Change the settings of the variable message signs (VMS): link the VMS to destina-tion zone, show informadestina-tion of different car parks on one VMS;
• Gain more insight in the effect and response to parking guidance systems, to model the effect properly.
This research was carried out in 2001 and the software of VISSIM has been updated. Therefore not all shortcomings are still the case in the current VISSIM software. The car park choice how-ever still is not part of the total trip costs equation, but is determined pre-trip.
3.2.2 Parking traffic modelled in S-Paramics
Examples of S-Paramics models which include car parks are the models developed for the mu-nicipalities of Rochdale, Takapuna and Nieuwegein.
The microsimulation models of Rochdale, Takapuna and Nieuwegein focus on the effects of the urban planning and development of the next years. The cities are expanding and the microsimu-lation models were used to study the effect of the different locations of the car parks (Sykes et al, 2010).
In the case of Rochdale different OD-matrices were generated. Matrix segmentation per trip motive was used, because not all car drivers have the same preferences or behavioural as-pects. Different matrices were derived for the car categories of commuters, non-commuters and work. The matrix segmentation was used to reflect parking policies, by applying parking prices and restrictions to a particular group of car drivers (Sykes et al. 2010).
In S-Paramics the ‘generalized cost equation’ (GCE) is used for the assignment of vehicles to the network. This cost equation includes the travel time, distance travelled and a toll coefficient. The model of Takapuna also included the car park charges and walk time from the car parks to the destination zones as a component of the generalized trip costs. In case a car park was full when a vehicle arrived, the vehicles would wait for a pre-defined time before assessing whether or not to drive to another car park (Sykes et al. 2010).
The parking durations and the modelling of the ‘return-trip’ is something which was modelled differently in the three models. For Takapuna the release profile of the ‘return-trips’ of car parks was derived from the morning peak occupancy numbers. For Nieuwegein an external controller was used to detect parking cars and assigned a release time to the cars. The ‘return-trips’ were therefore removed from the OD-matrix. The model of Rochdale influenced the choice of car park for departure by adding an exit cost of the car parks.
Parking traffic in microsimulation traffic models
developers of this model used two solutions for this problem. The first solution was using a car park availability controller to overwrite the driver’s first choice. Secondly they grouped smaller car parks into one car park, to avoid this problem (Sykes et al. 2010).
3.2.3 Elements of car park search process in microsimulation models
When the car park search model of Thompson and Richardson (1996) is compared to the S-Paramics models discussed in this section the following similarities are found:
• The additional cost factors included in the microsimulation model are ‘egress walk time’, the ‘parking fee’ and the ‘ waiting time’;
• The ‘in-vehicle time’ is included in the GCE of the microsimulation models; • The microsimulation models include the different cost aspects and drivers in the
model try to minimize the total trip costs;
• Different sensitivities and parking durations for different trip motives are used in the microsimulation models.
Therefore it is concluded that the S-Paramics models cover the most important aspects of the car park search process and can function as the basis for developing the PGS tool.
3.3 Base for developing the PGS tool
This chapter described several microsimulation models which include parking traffic. The mod-els discussed in this chapter show comparable structures. Several aspects are added to a ‘regular’ microsimulation model without car parks.
By the developers of the different models it was stated that in order to model parking behaviour, a lot of input data are needed. As the setup shows the modelling is more in-depth and detailed, than ‘regular’ microsimulation models. For the calibration of these models car park data was necessary.
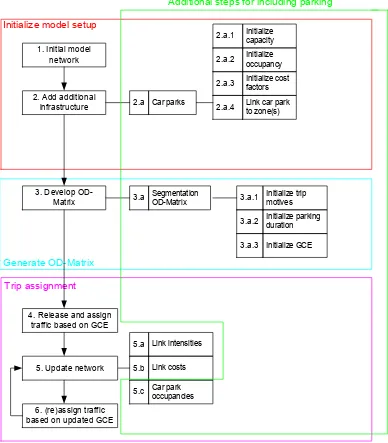
Using the simplified three phases of the S-Paramics microsimulation models, the additional elements can be put in the following phases:
• Model setup: the additional infrastructure (car parks) and the additional cost factors of this infrastructure (parking fee, queuing time and egress walk time);
• OD-matrix development: Segmentated OD-matrices based on trip motive with differ-ent sensitivities to cost factors;
• Trip assignment: the influence of additional cost factors on the route choice.
Parking traffic in microsimulation traffic models
1. Initial model network
2. Add additional
infrastructure Car parks
2.a.1 Initialize capacity
2.a.2 Initialize occupancy
2.a.3 Initialize cost factors
3.a.1 2.a
Initialize trip motives 3.a.2 Initialize parking duration
3.a.3 Initialize GCE
Initialize model setup
4. Release and assign traffic based on GCE
5. Update network
5.a Link intensities
5.b Link costs
5.c Car park occupancies 6. (re)assign traffic
based on updated GCE
Trip assignment
2.a.4 Link car park to zone(s)
Generate OD-Matrix 3. Develop
OD-Matrix
Segmentation OD-Matrix 3.a
[image:36.612.116.504.59.502.2]Additional steps for including parking
Parking traffic in microsimulation traffic models
3.4 Summary
This chapter discussed the available traffic and transport models and particularly microsimula-tion models which include parking. Case studies with regards to parking are carried out with the microsimulation software VISSIM and S-Paramics. The VISSIM software showed several short-comings, while the S-Paramics was used successfully to model parking behaviour. The ele-ments included in these S-Paramics models match well with the car park search model of Thompson et al. (1998), which is discussed in chapter 2.
Therefore the S-Paramics models are taken as a basis for the development of the PGS tool. This basis is illustrated in a simple framework as is shown in Figure 3-3. This figure gives an overview of the additional steps which are undertaken in models which include parking. For the development of the PGS tool it is important to fit the tool within the framework.
Development of the PGS tool for S-Paramics
4
Development of the PGS tool for
S-Paramics
Chapter 3 gives an overview of the microsimulation models which include parking. This chapter describes the process of developing the PGS tool and deals with the research questions:
•
What are the possibilities for modelling the effects of PGS to microsimulation mod-els?•
What are the possibilities and limitations of S-Paramics with regards to modelling PGS?•
How can the effects of PGS on driver behaviour be modelled, taking into account the possibilities and limitations of S-Paramics?The development of the PGS tool is carried out in five steps, which are described in different sections:
• Section 1: describes with the possibilities for the addition of a PGS tool in the current S-Paramics microsimulation models with parking.
• Section 2: describes the possibilities and limitations with regards to modelling PGS in S-Paramics.
• Section 3: describes the outcomes of the literature study with regards to effects of PGS. The outcomes of the literature study and the possibilities and limitations of S-paramics are used to define the base assumptions of the PGS tool.
• Section 4: describes the translation of these base assumptions to a functional PGS tool.
• Section 5: describes the location specific input which is needed for the PGS tool.
Figure 4-1: Overview structure chapter 4
Development of the PGS tool for S-Paramics
4.1 Basis for developing the PGS tool
To model the effect of PGS on driver behaviour and thus eventually the traffic performance, dif-ferent modelling approaches can be used.
For this master thesis the choice is to use the microsimulation software S-Paramics to model the effect of parking guidance systems. Microsimulation software is a network-based approach. The main reasons for choosing S-Paramics microsimulation software to model this effect are:
• A substantial amount of municipalities have S-Paramics traffic models available, so the PGS tool can be easily implemented;
• Grontmij does have extensive experience with S-Paramics, which can be used for developing the tool;
• It is relatively easy to edit parameters and write codes with regards to parking guid-ance systems in S-Paramics and the additional software.
The choice for us