Ichiro Ikushima, Yukunori Korogi, Toshinori Hirai, Takeshi Sugahara, Yoshinori Shigematsu, Yasuyuki Komohara, Tomoko Okuda, Mutsumasa Takahashi, and Yukitaka Ushio
PURPOSE: To assess the usefulness of fluid-attenuated inversion recovery (FLAIR) and construc-tive interference in steady state (CISS) sequences in depicting epidermoid tumors. METHODS: Six patients with surgically confirmed epidermoid tumors in the subarachnoid space were examined with T1-weighted MR imaging with a spin-echo sequence, and with T2- and proton density– weighted imaging with a fast spin-echo sequence, a FLAIR sequence, and a CISS sequence. In the qualitative analysis, three observers compared the five sequences for visibility of tumors and presence of artifacts. A quantitative analysis was also performed by measuring the contrast-to-noise ratio. RESULTS: On visual assessment, the FLAIR sequence depicted all tumors as hyper-intense relative to cerebrospinal fluid. The CISS sequence depicted all tumors as hypohyper-intense relative to cerebrospinal fluid and was considered to show tumor extension better than the FLAIR sequence. At quantitative analysis, the mean contrast-to-noise ratios of tumor to cerebrospinal fluid on T1-, T2-, and proton density–weighted images, and on FLAIR and CISS sequences were 2.85, 3.41, 4.42, 16.13, and 20.23, respectively. The contrast-to-noise ratios for the FLAIR and CISS sequences were significantly higher than those for the T1-, T2-, and proton density–weighted sequences. The contrast-to-noise ratio was not significantly different between FLAIR and CISS sequences, although the CISS sequence was slightly superior. CONCLUSION: CISS and FLAIR sequences depicted epidermoid tumors in the subarachnoid spaces better than conventional spin-echo images did. The CISS sequence produced a relatively constant contrast between the tumors and less artifactual interference.
Index terms: Epidermoid; Brain neoplasms, magnetic resonance; Magnetic resonance, compara-tive studies
AJNR Am J Neuroradiol18:1359 –1363, August 1997
Epidermoid tumors are congenital lesions of ectodermal origin, representing 0.2% to 1.8% of all primary intracranial tumors (1). They are usually found in the cerebellopontine angle, sellar and parasellar regions, and middle cranial fossa. At magnetic resonance (MR) imaging they are isointense to slightly hyperintense rel-ative to cerebrospinal fluid (CSF) on T1-, T2-, and proton density–weighted images (1– 6). It is
sometimes difficult to discern the exact exten-sion of an epidermoid tumor using only T1-, T2-, or proton density–weighted imaging. Al-though diffusion-weighted imaging may show epidermoid tumors (7), it often produces unsat-isfactory results because of patient movement and pulsatile brain movement. A steady-state free precession sequence with a short repetition time and a moderate flip angle is also useful for showing extension of epidermoid tumors (8). However, on this sequence, the demarcation between tumor and brain is poor, and it is some-times difficult to find the repetition time and flip angle that provide the optimal contrast between tumor and CSF.
The fluid-attenuated inversion-recovery (FLAIR) sequence produces heavy T2 weight-ing without high signal intensity of CSF. The constructive interference in steady state (CISS) sequence can provide high-resolution images Received November 18, 1996; accepted after revision February 26,
1997.
From the Departments of Radiology (I.I., Y.K., T.H., T.S., Y.S., Y.K., T.O., M.T.) and Neurosurgery (Y.U.), Kumamoto (Japan) University School of Medicine.
Address reprint requests to Ichiro Ikushima, MD, Department of Radi-ology, Kumamoto University School of Medicine, 1–1–1 Honjo, Kumamoto 860, Japan.
AJNR 18:1359–1363, Aug 1997 0195-6108/97/1807–1359 ©American Society of Neuroradiology
with good contrast between CSF and solid structures (9 –11).
In this study, we used FLAIR and CISS se-quences to evaluate epidermoid tumors. We compared the visibility of epidermoids on spin-echo T1-weighted images, fast spin-spin-echo T2-weighted images, fast spin-echo proton densi-ty–weighted images, and FLAIR and CISS sequences.
Subjects and Methods
The study population consisted of six consecutive pa-tients with untreated or residual epidermoid tumors: four female and two male, ranging in age from 11 to 71 years (mean, 53 years). The diameter of the tumors ranged from 1.5 to 6.5 cm. Three were located in the cerebellopontine angle cistern, two in the prepontine cistern, and one in the left middle fossa. Two were imaged before surgery and four were residual tumors imaged after surgery. The diag-nosis and location of five of the six tumors were confirmed surgically.
All patients were imaged in a 1.5-T MR unit equipped with a head coil. For all patients, imaging examinations included axial T1-weighted spin-echo imaging (670/14/1 [repetition time/echo time/excitations]); axial T2-weighted fast spin-echo imaging (4500/96/2; echo train length, 7); axial imaging with a FLAIR sequence (8000/ 119/1; echo train length, 7; inversion time, 2000); and axial imaging with a CISS sequence (17.1/8.0/1; flip an-gle, 80°). Four of six patients also underwent proton den-sity–weighted fast spin-echo imaging (2400/15/2; echo train length, 7). Other imaging parameters were as follows: matrix size was 256 3 256 for the T1-weighted, proton density–weighted, and FLAIR sequences and 5123256 for the T2-weighted sequences; section thickness was 5 mm with 1-mm intersection gaps for the T1- and T2-weighted and FLAIR sequences; and field of view was 220 mm. Imaging parameters for the CISS sequence were as follows: matrix size was 5123256, section thickness was 0.71 mm (50-mm slab thickness for the 70 partitions), and field of view was 220 mm. The phase-encoding direction was right to left for all sequences.
For qualitative analysis, the depiction of tumor in the subarachnoid space was compared for the T1-, T2-, and proton density–weighted images, and the FLAIR and CISS sequences. These images were classified by three neuro-radiologists into four grades, as follows: 1, tumor not seen or only suspected on the basis of widening of the sub-arachnoid space; 2, tumor vaguely visible, but its exact extension not discernible; 3, extension of tumor partially unclear; and 4, tumor well demarcated. The readers were not blinded to the diagnosis or the pulse sequences.
Image artifacts on CISS and FLAIR sequences were also assessed qualitatively by the same interpreters, who judged image artifacts as follows:11, fewer artifacts on CISS than on FLAIR sequences; 0, CISS and FLAIR se-quences comparable;21, fewer artifacts on FLAIR than on
CISS sequences. Each evaluator was also asked to indi-cate whether image artifacts interfered with the interpreta-tion of the images. The following scale was used to eval-uate the interference caused by artifacts: 11, artifacts caused interference on FLAIR sequences; 21, artifacts caused interference on CISS sequences. The statistical significance of differences in the qualitative analysis of image artifacts was determined by means of a sign test (12).
For the quantitative analysis, the contrast-to-noise ratio (CNR) between tumors and CSF was compared for T1-, T2-, and proton density–weighted images, and FLAIR and CISS sequences. The CNR was calculated as follows: CNR 5 usignal intensity of tumor 2 signal intensity of CSFu/standard deviation (SD) of noise. To minimize partial volume effects, we selected the image that showed the maximum area of the lesion and used a circular region of interest (ROI) that approached but did not exceed the lesion margins on the CISS sequences. The same ROI was selected on the spin-echo and FLAIR sequences. In the same image, CSF signal intensities were measured with the circular ROI chosen to be as large as possible to cover the CSF space. The SD of noise was measured along the phase-encoding direction in regions outside the head.
For statistical analysis, the data were analyzed using an unpairedttest.
Results
Qualitative Analysis
although the score was not statistically signifi-cant (P, .05).
Quantitative Analysis
The mean CNRs of tumors to CSF on T1-, T2-, and proton density–weighted images, and on FLAIR and CISS sequences were 2.85, 3.41, 4.42, 16.13, and 20.23, respectively. Ratios for FLAIR and CISS sequences were significantly higher than those for T1-, T2-, and proton den-sity–weighted images (P,.01). Compared with FLAIR, CNR for CISS was higher in four cases, lower in one, and almost equal in one. The mean CNR between FLAIR and CISS sequences was not significantly different, although CISS was slightly better than FLAIR.
Discussion
Although epidermoid tumors typically are de-picted by MR imaging as slightly hyperintense
relative to CSF on T1-, T2-, and proton density– weighted spin-echo sequences (1– 6), the differ-ence between these signals is small and it is frequently difficult to differentiate the tumors from arachnoid cysts on conventional spin-echo sequences (1–3, 5, 7, 8).
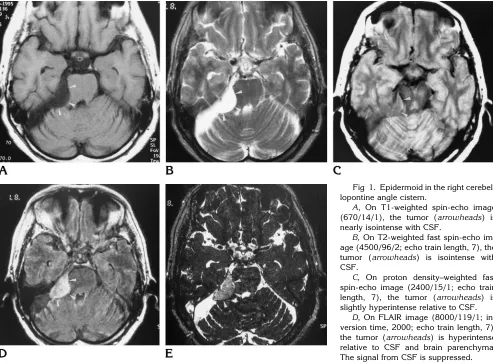
[image:3.587.51.544.84.448.2]FLAIR is an inversion-recovery sequence de-signed to null or greatly reduce the signal from CSF; it gives heavy T2 weighting without high signal and potential artifacts from CSF (13). FLAIR images, however, show CSF flow arti-facts, attributable to inflow of noninverted CSF, especially at the foramen of Monro, basal cis-terns, and fourth ventricle (13). FLAIR has been reported to be more sensitive than conventional T1- and T2-weighted imaging in the detection of a wide range of diseases, such as multiple sclerosis, infarction, herpes simplex encephali-tis, sarcoidosis, tuberous sclerosis, and intra-cranial tumors (9, 13–19). We know of one case report describing the use of FLAIR in which an Fig 1. Epidermoid in the right cerebel-lopontine angle cistern.
A, On T1-weighted spin-echo image (670/14/1), the tumor (arrowheads) is nearly isointense with CSF.
B, On T2-weighted fast spin-echo im-age (4500/96/2; echo train length, 7), the tumor (arrowheads) is isointense with CSF.
C, On proton density–weighted fast spin-echo image (2400/15/1; echo train length, 7), the tumor (arrowheads) is slightly hyperintense relative to CSF.
epidermoid tumor appeared hyperintense rela-tive to CSF (9). In that case, FLAIR was superior to conventional spin-echo sequences in depict-ing the tumor. In our study, the FLAIR sequence also depicted epidermoid tumors as hyperin-tense against the nulled signal from CSF. How-ever, the CNR of the tumor in one case was very high, while in other cases it was very low. This variation in the CNR may have been due to a difference in hydration of the tumors. It is sup-posed that whereas dehydrated tumors have very high signal intensity on FLAIR sequences, the signal from tumors rich in water is sup-pressed by FLAIR, and they are poorly visual-ized. Moreover, on the FLAIR sequence, marked CSF flow artifacts attributable to the inflow of
noninverted CSF were often observed in the basal cisterns and prepontine or cerebellopon-tine angle cisterns, making it difficult to detect small lesions in these areas.
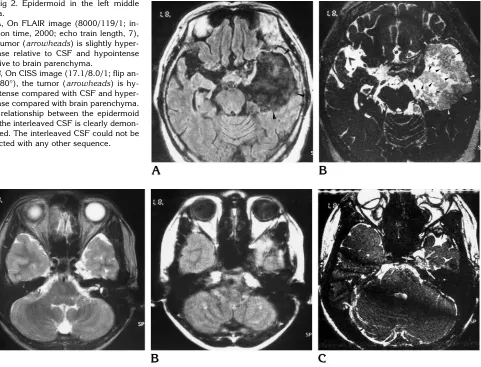
[image:4.587.66.547.84.451.2]The CISS sequence was originally designed for MR myelography and MR cisternography. It is a true fast imaging with steady-state precision (FISP) sequence, which produces heavily T2-weighted images. However, a true FISP se-quence will produce artifacts of low signal in-tensity bands. These dark bands are caused by very small magnetic-field inhomogeneities and local field distortions attributable to susceptibil-ity changes that are normally produced in clin-ical imaging. CISS is an effective method of reducing these dark bands by the summation of Fig 2. Epidermoid in the left middle
fossa.
A, On FLAIR image (8000/119/1; in-version time, 2000; echo train length, 7), the tumor (arrowheads) is slightly hyper-intense relative to CSF and hypohyper-intense relative to brain parenchyma.
B, On CISS image (17.1/8.0/1; flip an-gle, 80°), the tumor (arrowheads) is hy-pointense compared with CSF and hyper-intense compared with brain parenchyma. The relationship between the epidermoid and the interleaved CSF is clearly demon-strated. The interleaved CSF could not be detected with any other sequence.
Fig 3. Postoperative residual epidermoid in left Meckel’s cave.
A, On T2-weighted fast spin-echo image (4500/96/2; echo train length, 7), the tumor is not clearly detected. Meckel’s cave is expanded on the left.
B, The tumor cannot be detected on FLAIR image (8000/119/1; inversion time, 2000; echo train length, 7).
two three-dimensional Fourier transform (3DFT) data sets, one with an alternating radio frequency pulse and one with a nonalternating radio frequency pulse (10, 20)(M. Deimling, G. A. Laub, “Constructive Interference in Steady State for Motion Sensitivity Reduction,” In:Book of Abstracts: Society of Magnetic Resonance in Medicine, 1989:842), and produces an image with a homogeneous intensity over the entire field of view and very high contrast between CSF and solid structures. The 3-D CISS se-quence also provides high-resolution images with good contrast between CSF and solid structures. Several investigators have used the CISS sequence to demonstrate the fine ana-tomic structures of the inner ear or cerebel-lopontine angle (10, 11, 21). In our study, all epidermoid tumors were hypointense relative to CSF on CISS images. This contrast may have been due to the accentuation of T2 values be-tween epidermoids and CSF, whereas in the T2-weighted images, an echo time of 96 milli-seconds was not long enough to emphasize the difference in T2 values between them. More-over, an epidermoid tumor is filled with choles-terol crystals and keratin originating from the progressive desquamation of the epithelium. It is supposed that these substances, which have differing susceptibilities, may decrease the sig-nal of the tumor on CISS images. Although the CISS images did show susceptibility artifacts, these artifacts did not interfere with the detec-tion of tumors. Because 3-D CISS sequences provided high spatial resolution with very thin sections, it was possible to detect the exact tumor extension, even for a small lesion in Meckel’s cave (Fig 3). The variability observed on the CISS sequence was small compared with that of the FLAIR sequence. It is supposed that this variability on the CISS sequence was due to different proportions of substances contained in the epidermoids.
In conclusion, the FLAIR sequence depicted epidermoids with variable contrast. The CISS sequence produced relatively constant contrast and fewer artifacts interfering with interpretation than did FLAIR. Of the five sequences we eval-uated, CISS was superior in demonstrating the exact extension of epidermoids.
References
1. Tampieri D, Melanson D, Ethier R. MR imaging of epidermoid cysts.AJNR Am J Neuroradiol1989;10:351–356
2. Olson JJ, Beck DW, Crawford SC, Menezes AH. Comparative evaluation of intracranial epidermoid tumors with computed to-mography and magnetic resonance imaging.Neurosurgery1987; 21:357–360
3. Steffey DJ, De Filipp GJ, Spera T, Gabrielsen TO. MR imaging of primary epidermoid tumors.J Comput Assist Tomogr1998;12: 438 – 440
4. Saveder SJ, Murtagh FR, Savader BL, Martinez CR. Magnetic resonance imaging of intracranial epidermoid tumours.Clin Ra-diol1989;40:282–285
5. Ishikawa M, Kikuchi H, Asato R. Magnetic resonance imaging of the intracranial epidermoid.Acta Neurochir1989;101:108 –111 6. Panagopoulos KP, El-Azouzi M, Chisholm HL, Jolesz FA, Black
PM. Intracranial epidermoid tumors.Arch Neurol1990;47:813– 816
7. Tsuruda JS, Chew WM, Moseley ME, Norman D. Diffusion-weighted MR imaging of the brain: value of differentiating between extraaxial cysts and epidermoid tumors.AJNR Am J Neuroradiol
1990;11:925–931
8. Sakamoto Y, Takahashi M, Ushio Y, Korogi Y. Visibility of epider-moid tumors on steady-state free precession images.AJNR Am J Neuroradiol1994;15:1737–1744
9. Tsuchiya K, Mizutani Y, Hachiya J. Preliminary evaluation of fluid-attenuated inversion-recovery MR in the diagnosis of intracranial tumors.AJNR Am J Neuroradiol1996;17:1081–1086
10. Cassleman JW, Kuhweide R, Deimling M, Ampe W, Dehaene I, Meeus L. Constructive interference in steady state (CISS)-3DFT MR imaging of the inner ear and cerebellopontine angle.AJNR Am J Neuroradiol1993;14:47–57
11. Cassleman JW, Kuhweide R, Ampe W, Dehaene I, Meeus L, Steyaert L. Pathology of the membranous labyrinth: comparison of T1- and T2-weighted and gadolinium-enhanced spin-echo and 3DFT-CISS imaging.AJNR Am J Neuroradiol1993;14:59 – 69 12. Roster B.Fundamentals of Biostatistics.3rd ed. Boston, Mass:
Duxbury, 1990:295–299
13. Ryberg JN, Hammond CA, Grimm RC, et al. Initial clinical expe-rience in MR imaging of the brain with a fast fluid-attenuated inversion-recovery pulse sequence. Radiology 1994;193:173– 180
14. De Coene B, Hajnal JV, Pennock LM, Bydder GM. MRI of the brain stem using fluid attenuated inversion recovery pulse sequences.
Neuroradiology1993;35:327–331
15. Thomas DJ, Pennock JM, Hajanal JV, Young IR, Bydder GM, Steiner RE. Magnetic resonance imaging of spinal cord in multiple sclerosis by FLAIR.Lancet1993;341:593–594
16. Hajnal JV, Bryant DJ, Kasuboski L, et al. Use of fluid attenuated inversion recovery (FLAIR) pulse sequences in MRI of the brain.
J Comput Assist Tomogr1992;16:841– 844
17. De Coene B, Hajnal JV, Gatehouse P, et al. MR of the brain using FLAIR pulse sequences.AJNR Am J Neuroradiol1992;13:1555– 1564
18. Takanashi J, Sugita K, Fujii K, Takatsuna Y, Niimi H. Optic neuritis with silent cerebral lesions: availability of FLAIR se-quences.Pediatr Neurol1995;12:152–154
19. Takanashi J, Sugita K, Fujii K, Niimi H. MR evaluation of tuberous sclerosis: increases sensitivity with fluid-attenuated inversion re-covery and relation to severity of seizures and mental retardation.
AJNR Am J Neuroradiol1995;16:1923–1928
20. Patz S. Some factors that influence the steady state in “steady state” free precession.Magn Reson Imaging1988;6:405– 413 21. Cassleman JW, Majoor MHJM, Albers FW. MR of the inner ear in