Spinal Cords: Evaluation of Diffusion Coefficients and Anisotropy
Pradip M. Pattany, William R. Puckett, Karl J. Klose, Robert M. Quencer, Richard P. Bunge, Larry Kasuboski, and Raymond G. Weaver
PURPOSE: To use high-resolution diffusion-weighted and calculated apparent diffusion coefficient (ADC) MR imaging to determine whether fixation and storage influence diffusion anisotropy in white matter tracts of cat spinal cord specimens. METHODS: Four cat cord specimens were imaged using a diffusion-weighted spin-echo sequence. Diffusion encoding was applied in the section-select axis (parallel to white matter tracts) and in the read axis (perpendicular to white matter tracts). Five sets of axial diffusion-weighted images were acquired with b values ranging from 0 to 800 s/mm2 and used to obtain calculated ADC images and to determine diffusion coefficients in different regions of the white matter tracts. RESULTS: After cord fixation, a decrease in T2 relaxation and spin density in the white matter caused the signal intensity to appear similar on diffusion-weighted images when the diffusion-probing gradient was applied along both the section-select and read axes. On the calculated ADC images, however, distinct differences in signal intensities were seen in the section-select and read axes. CONCLUSION: Although there is little difference in signal intensity in the white matter tracts on diffusion-weighted images when diffusion encoding is applied in the section-select or read axis in the fixed specimens, calculated ADC images confirm that diffusion anisotropy is maintained. Therefore, calculated ADC images may be helpful in the evaluation of fixed spinal cord specimens.
Index terms: Animal studies; Magnetic resonance, diffusion-weighted; Spinal cord, magnetic resonance
AJNR Am J Neuroradiol18:1049 –1056, June 1997
Magnetic resonance (MR) imaging of fresh and fixed postmortem specimens of human and rat spinal cord can show the gross anatomy of the cord both before and after fixation. The T1 and T2 relaxation times and the spin density of gray and white matter are reduced after fixation, but the signal difference between gray and white
matter is preserved in both fresh and fixed spec-imens (1). Previous studies have shown that comparisons of MR imaging and pathologic findings in spinal cord injury (2–5) are useful in interpreting changes in signal characteristics seen on MR images. However, these compari-sons do not reflect the structural integrity of axons in the white matter tracts, which can be seen with diffusion-weighted imaging (6 –10).
Molecular diffusion in homogeneous fluid re-sults from a process in which molecules move unrestricted at random (brownian motion), be-cause of thermal agitation. In biological sys-tems, the movement of molecules is restricted by cellular structures. In highly organized bio-logical structures, such as white matter tracts, diffusion properties are said to be anisotropic— that is, diffusion is more restricted in one direc-tion than in another. The changes in MR signal characteristics due to diffusion were shown in 1965 by Stejskal and Tanner (11, 12) with the
Received October 8, 1996; accepted after revision January 17, 1997. Supported in part by grant NS28059 from the National Institutes of Health, National Institute of Neurological Disorders and Stroke, the Paral-ysis Project, and the Miami Project to Cure ParalParal-ysis.
From the Departments of Radiology (P.M.P., R.M.Q.) and Neurological Surgery (K.J.K., R.P.B.) and the Miami (Fla) Project to Cure Paralysis (W.R.P., K.J.K., R.P.B.), University of Miami Schjool of Medicine; and Picker International Inc, MR Division, Highland Heights, Ohio (L.K., R.G.W.).
Address reprint requests to Pradip M. Pattany, PhD, Department of Radiology, MRI Center, University of Miami School of Medicine, 1115 NW 14th St, Miami, FL 33136.
AJNR 18:1049–1056, Jun 1997 0195-6108/97/1806 –1049
©American Society of Neuroradiology
use of a pulsed gradient spin-echo method. Since then, various types of diffusion-weighted imaging methods have been proposed, along with their advantages and limitations (13).
To date, all the studies done with diffusion-weighted imaging have been performed in vivo or on fixed tissue specimens, because diffusion-weighted imaging has the potential to charac-terize abnormal areas in white matter tracts. Diffusion coefficient values have been mea-sured using calculated apparent diffusion coef-ficient (ADC) imaging in a fixed rat spinal cord injury model (15). We investigated the effects of fixation and storage on diffusion coefficients along and across the white matter tracts of nor-mal cat spinal cords using calculated ADC im-ages.
Materials and Methods
Four cat spinal cords were imaged within 24 hours of harvesting, depending on availability of the imaging unit, at 1.5 T. The unit has self-shielded gradient coils with 16 mT/m peak gradient strength and a 20 mT/m per second slew rate. A quadrature body coil was used as a transmit-ter, and a specially designed 4-cm-diameter coil was used as a receiver to provide high-resolution images. The cords were placed in a 4% neutral buffered formalin solution (fixative) for 12 to 14 days and then imaged again. They were then placed in a buffered solution (isotonic salt solu-tion without formaldehyde) for permanent storage, during which they were imaged three times over a period of 31 weeks from the time of the initial study. The cords were stored in the imaging suite, which was kept at a constant temperature of 67°F.
Axial T1- and T2-weighted images were acquired first with a spin-echo sequence and the following parameters: 800/22/5 (repetition time/echo time/excitations) with a 256 3 256 matrix for T1-weighted images; 2000/80/3 with a 220 3 256 matrix for T2-weighted images; 12 contiguous sections, each 3-mm thick, were obtained with a 30-mm field of view; and undersampling of 0.7 was performed along the phase-encode (anteroposterior) axis to reduce the imaging time.
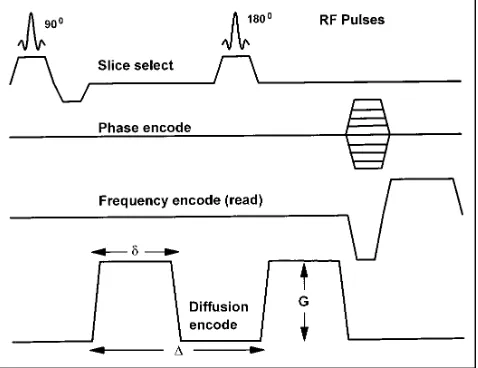
Diffusion imaging was performed using a spin-echo technique, with diffusion-encoding gradients applied on either side of 180° radio-frequency refocusing pulse (Fig 1). The effects of conventional imaging gradients on dif-fusion cross-terms were minimized by using a gradient-echo waveform for the frequency-encoding (read) gradi-ent and by applying the phase-encoding gradigradi-ent before collecting the data. Axial diffusion-weighted images were obtained with diffusion encoding applied along the sec-tion-select axis (parallel to the white matter tracts, along the z-axis) and read axis (perpendicular to the white mat-ter tracts, along the x-axis). Five different b values of 0, 200, 400, 600, and 800 s/mm2were used along each of
the two axes to obtain calculated ADC images. The diffu-sion-weighted image parameters were 3000/130/1 with a 256 3 256 image matrix; 12 contiguous sections, each 3-mm thick, were obtained with a 50-mm field of view, and undersampling of 0.7 was performed along the phase-encode axis to reduce the imaging time.
Initial validation of the diffusion-weighted sequence was done by measuring the diffusion coefficient in a 3310-cm cylindrical plastic bottle phantom that contained water doped with CuSO4(1.25 g/L).
The amount that the MR signal is attenuated is depen-dent on the diffusion coefficient of the tissue and the in-tensity of the diffusion-probing pulsed gradients. Neglect-ing the term due to conventional imagNeglect-ing gradients, the resulting MR signal attenuation factor (11, 12) is ex-pressed as follows:
1) S
So5
exp
F
2g2G2d2S
D2d3
D
D*G
whereSis the MR signal when diffusion-probing gradients are applied, S0 is the signal without the application of
diffusion-probing gradients, Gis the amplitude of the dif-fusion-probing gradient pulses, d is the duration of the pulses,Dis the time between their leading edges, andD*is
the diffusion coefficient of the sample under investigation. The diffusion-sensitive parameter, b, is expressed in s/mm2in Equation 2.
2) b5g2G2d2
S
D2d3
D
Therefore, Equation 1 can now be expressed as follows:
3) S
So5
[image:2.587.308.547.86.270.2]exp~2bD*!
For calculating the ADC values, the following expression is used:
4) D*5
ln
S
So SD
bFor more accurate results, the ADC values were ob-tained by using five diffusion-weighted images with differ-ent b values, and their signal intensities were measured pixel by pixel. A linear regression-fitting algorithm (fitting a straight line to the logarithm of the signal) was used to
obtain the best fit for calculating the diffusion coefficient for each of the 12 sections.
The diffusion-coefficient values were obtained by draw-ing the regions of interest in the ventral, lateral (left and right sides), and dorsal white matter tracts along with the gray matter regions (left and right sides) (Fig 2) on the calculated ADC images. The mean pixel intensity within each region of interest was calculated by the scanner’s computer. The overall analyses were initially performed by using a multivariate analysis of variance (MANOVA) method. Posttest comparisons of individual means were made using the Scheffe´ method of post hoc comparisons. This method uses a reasonable level of probability (P# .05) and is powerful for complex comparisons involving more than two treatment means.
Results
Fresh Spinal Cords
[image:3.587.50.289.236.398.2]In the fresh specimens, both T1- and T2-weighted images displayed similar signal char-acteristics in gray matter and white matter re-gions (Fig 3A and B); the gross anatomic structure within the cord was clearly displayed. The diffusion-weighted images acquired of the fresh specimen showed marked differences in signal intensities in the white matter between the two images, indicating there was diffusion anisotropy; the signal in the white matter region was lower than that in the gray matter when the diffusion-probing gradient was applied in the Fig 2. Axial T1-weighted image with typical locations of
re-gions of interest used to obtain diffusion coefficient values from ventral, lateral (left and right sides), and dorsal white matter regions, and gray matter (left and right sides) regions.
Fig 3. High-resolution axial images of the fresh spinal cord specimen.
A, T1-weighted (800/22/5) spin-echo image shows lower signal intensity in the white matter.
B, T2-weighted (2000/80/3) spin-echo image shows similar gray matter–white matter signal characteristics as the T1-weighted image.
C, Diffusion-weighted (3000/130/1) image with diffusion-probing gradient (b5 800 s/mm2) applied in the section-select axis shows the signal in the white matter region is lower than that in the gray matter region.
[image:3.587.49.378.463.728.2]section-select axis (Fig 3C); the signal in the white matter region was higher than that in the gray matter when the diffusion-probing gra-dient was applied in the read axis (Fig 3D). Of interest is that the signal intensity at the tips of the gray matter horns was higher on the diffu-sion-weighted image, and at present we do not have an explanation for this observation. Also, the signal intensity in the lateral and dorsal white matter tracts was higher than that of the ventral white matter tracts on diffusion-weighted images. We believe that this variation is due to a fall-off in the sensitivity of the 4-cm-diameter surface coil. It is more apparent on the long-echo-time diffusion-weighted sequences than the T1- and T2-weighted sequences. The calculated ADC images showed the diffusion anisotropy in the white matter tracts in the fresh specimen when the diffusion-probing gradient was applied in both the section-select (Fig 4A) and the read (Fig 4B) axes. The signal charac-teristics in the white matter were reversed in the calculated ADC images (Fig 4A and B) as com-pared with the diffusion-weighted images (Fig 3C and D). In the calculated ADC images, less restricted diffusion (high diffusion coefficient) was depicted as increased signal; for example,
when the diffusion-probing gradient was applied in the section-select axis.
Fixed Spinal Cords
In the diffusion-weighted images of a fixed specimen, the gray matter signal intensity was higher than that of white matter and there was little signal difference in the white matter tracts between the two images when the diffusion-probing gradient was applied in either the sec-tion-select (Fig 5A) or read (Fig 5B) axes. The decrease in T2 relaxation in the white matter after fixation and the long (130 millisecond) echo time used to acquire the diffusion-weighted image resulted in increased contrast due to T2 decay. This decay overwhelms the signal changes because of diffusion encoding.
The calculated ADC images showed that the diffusion anisotropy was preserved in the fixed specimen when the diffusion-probing gradient was applied in either the section-select (Fig 6A) or the read (Fig 6B) axis. The images displayed signal characteristics in the white matter that were similar to that seen in the fresh specimen (Fig 3C and D), indicating that diffusion anisot-ropy was preserved in the fixed specimens. Fig 5. Diffusion-weighted images of a
[image:4.587.214.548.83.383.2]fixed specimen with the diffusion-probing gradient applied in the section-select (A) and read (B) axes. The white matter region has similar signal characteristics in both images.
Fig 4. Calculated ADC images of a fresh cord specimen.
A, Diffusion-probing gradient applied in the section-select axis shows high signal from the white matter regions.
Measurements
The diffusion coefficient was measured for the CuSO4-doped water solution at 19.4°C (67°F). Values were 1.89 (6 0.013) 3 1023 s/mm2 along the section-select axis and 1.96 (6 0.013) 31023 s/mm2along the read axis. The result corresponded to values observed by Mills (14) at a temperature range of 1°C to 45°C, indicating that ADC values obtained with our method were valid.
After acquiring the calculated ADC images and establishing that these could be used to examine diffusion anisotropy, we evaluated the diffusion coefficients from specific regions within the cord. The values from the gray matter (left and right sides) were averaged and the lateral white matter (left and right sides) were also averaged for each cat cord at a given time point and for a given direction (section-select or read axis) of diffusion probing. Also, results from each cord at each time point (fresh, at fixation, and buffered) were averaged for each of the four regions (ventral white matter, lateral white matter, dorsal white matter, and gray matter region) for a given direction of diffusion probing. The average ADC values for the four cat cords are represented graphically in Figure 7.
The ADC values for the section-select and read axes in each white matter region (ventral, lateral, and dorsal) were dramatically different for each time point, as shown in Figure 7, indi-cating strong diffusion anisotropy in the white matter regions of spinal cord specimens that were fixed and stored in buffered solution. Sim-ilarly, the ADC values were compared in the gray matter regions and found to be signifi-cantly different (P # .001); that is, the values were lower in the section-select axis than in the
read axis for each of the measurements shown in Figure 7.
The ADC values in the section-select axis were compared for each region (ventral, dorsal, and lateral white matter, and gray matter) at each time point and were found to be signifi-cantly different (P # .001). However, the ADC values in the read axis were not significantly different between ventral and lateral white mat-ter regions, but they were higher than those in the dorsal white matter region for each time point and lower than those in the gray matter region, as seen in Figure 7.
[image:5.587.50.387.85.232.2] [image:5.587.310.547.254.421.2]When we compared ADC values in the sec-tion-select axis of fresh cord with those of cord fixed for 12 to 14 days, we found an initial drop Fig 7. The graph has two curves for a given region, thesolid linesrepresent ADC values in the section-select axis and the dashed linesrepresent ADC values in the read axis. The horizontal scale shows the six measurements at different times: 05when the cord is fresh, 1 5 after 12 to 14 days in 4% neutral buffered formalin solution, 25after 2 weeks in buffered solution for long-term storage, 35after 4 to 5 weeks in buffered solution, 45after 7 to 8 weeks in buffered solution, and 55after 30 to 31 weeks in buffered solution.
between fresh and fixed cord in the ventral (23%), lateral (27%), and dorsal (27%) white matter regions and in the gray matter region (33%). This change was significantly different (P # .001). The ADC values in the section-select axis were also compared between cord fixed for 12 to 14 days and all time points of storage in buffer. In the ventral white matter region, the ADC values were not significantly different between those at the time of fixation and those after storage in buffer. In the lateral white matter region, the ADC values at 12 to 14 days’ fixation and at 2 weeks’ fixation were sig-nificantly different (P 5 .02), but the ADC val-ues at more than 2 weeks in buffer were not significantly different from those at 12 to 14 days’ fixation. In the dorsal white matter region, the difference in ADC values at 12 to 14 days’ fixation and at 2 weeks in buffer was statistically significant (P 5 .04), but a comparison of all ADC values at more than 2 weeks in buffer were not significantly different from those at 12 to 14 days in fixative. In the gray matter region, none of the buffered ADC values were significantly different from the fresh ADC value.
In the read axis, a comparison of ADC values of fresh cord with those at 12 to 14 days’ fixa-tion and those stored in buffer showed no signifi-cant difference in any of the four regions (lateral, ventral, dorsal white matter, and gray matter).
Discussion
With the use of calculated ADC images, we determined the diffusion coefficient values in the white matter tracts of normal specimens of cat spinal cord as a function of fixation and long-term storage in buffer solution. The results we obtained may be important in future evalu-ations of spinal cord injury, because this method can characterize abnormal white matter regions in injured or diseased human spinal cord specimens that have been fixed and stored in a buffered solution for long periods of time. The calculated ADC images afford a more sen-sitive tool for evaluating the structural integrity of white matter tracts, which may not be as well defined with conventional T1- and T2-weighted imaging techniques.
Diffusion-weighted imaging has been used to discern anisotropic restricted diffusion in highly organized structures, such as white matter tracts in the brain and spinal cord (6 –10). ADC values have been measured in the white matter
tracts in fixed rat spinal cord injury models to evaluate changes in diffusion anisotropy be-tween normal and abnormal regions (15). It was shown that diffusion was completely isotropic at the epicenter of injury, indicating that there may be mechanical disruption of axons and/or accu-mulation of extracellular fluid. These research-ers postulated that coagulation of proteins caused by formaldehyde would be expected to alter the diffusion characteristics of normal white matter tracts, but they did not investigate the effects of fixation on diffusion imaging. Col-or-coded diffusion tensor imaging, which uses three-dimensional contrast anisotropy, has been performed to detect alterations in physio-logical and morphophysio-logical properties of neuro-nal fibers in postmortem rat spineuro-nal cord after induction of cardiac arrest. It was shown that rapid reduction in anisotropy during the first 2 hours may be caused by changes in axoplasmic flow, and that some degree of anisotropy was retained 4 hours after death depending on the morphological properties of the neuronal fibers (16).
On T1-weighted images, the signal charac-teristics of gray and white matter of the spinal cord is the opposite of that seen in the brain (Fig 3A): in the spinal cord, the signal of gray matter is higher than that of white matter. Carvlin et al (1), in studies of fresh rat spinal cords, reported that the T1 value of gray matter is slightly shorter than that of dorsal white matter and slightly longer than that of lateral white matter. However, the spin density is much higher in the gray matter than white matter, indicating that the gray matter–white matter contrast is domi-nated by the higher spin density in the gray matter.
cal-culated ADC image (Fig 4A) was reversed from that on the diffusion-weighted image, because the diffusion coefficient values were higher when diffusion probing was applied in the sec-tion-select axis. As a result, the calculated ADC images displayed high signal intensity in the regions where the diffusion was less restricted. The opposite effect was observed when the dif-fusion-probing gradient was applied in the read axis, where the diffusion was more restricted in the white matter than in the gray matter (Fig 4B).
The diffusion-weighted images obtained in thefixed cord specimensdid not show the signal differences observed in the fresh specimens (Fig 5A and B). This was in large part due to the changes in T2 relaxation as a function of fixa-tion and higher spin density in the gray matter. The diffusion-weighted image sequence is influ-enced by the signal decay due to T2 relaxation because the TE values have to be long in order to apply adequate b values. Carvlin et al (1) reported that the T2 values decreased in fixed human and rat cord specimens by 48% in the white matter and by 28% to 30% in the gray matter as compared with fresh specimens. Also, the spin density in the gray matter was higher than that in the white matter. The relative changes in T2 relaxation and spin density be-tween white matter and gray matter as a func-tion of fixafunc-tion could effect the signal character-istics observed on fixed diffusion-weighted images. Therefore, it is important to apply a technique such as calculated ADC images to separate the diffusion contrast from T2-depen-dent contrast and to allow measurements of the diffusion coefficient values (7, 17–19). The cal-culated ADC images in fixed spinal cord spec-imens displayed similar signal characteristics as those seen in the fresh spinal cord speci-mens, confirming that diffusion anisotropy was preserved in the white matter tracts of fixed tissue (Fig 6A and B).
The graph in Figure 7 shows an initial drop in ADC values between fresh cord and that after 12 to 14 days’ fixation in the section-select axis (solid lines) in all four regions. This could be due to the cross-linking between the aldehyde and the protein molecules as a function of the fixation process, which would form barriers to the free motion (diffusion) of water molecules along the length of the cord. Also, there is an excess of formaldehyde molecules in the cord that are not bound to the protein molecules,
which could restrict the movement of water molecules.
The ADC values in the section-select axis at 2 weeks in buffer were higher than those after 12 to 14 days’ fixation and all the subsequent buff-ered values. This trend was observed in all re-gions of the white matter tracts and the gray matter regions (Fig 7). This finding could be attributed to higher concentration of formalde-hyde in the cord than in the buffer solution in which it was placed for long-term storage. The difference in formaldehyde concentration would result in an osmotic pressure gradient as a result of water molecules from the buffer solution slowly passing through the permeable mem-branes of the fixed cord and the formaldehyde molecules leaching out into the buffer solution. Thus, this may represent a temporary hydration effect and its consequences on the ADC values. The ADC values in the section-select axis of the cord measured at more than 2 weeks in buffer were between those at 12 to 14 days’ fixation and those at 2 weeks in buffer. This finding could be due to the formaldehyde con-centration being equal in the cord and the buff-ered solution, resulting in reduced ADC values. The trend toward changes in ADC values as a function of fixation and storage in buffered so-lution follows a similar pattern for all four re-gions, as shown in Figure 7.
The data obtained in this study indicate that diffusion anisotropy is maintained in white mat-ter tracts of spinal cord specimens as a function of fixation and long-term storage in buffered solution. Diffusion-weighted images do not dis-play the diffusion anisotropy that is seen on calculated ADC images. We can conclude that calculated ADC images are vital in assessments of the structural integrity of white matter tracts of fixed spinal cord specimens. We may be able to apply the calculated ADC method to fixed cord specimens that have been stored in formaldehyde or buffered solution in order to evaluate structural integrity after spinal cord injury or consequent to any disease process affecting the spinal cord. We believe that this technique will be valuable for future investigators who wish to study detailed anatomic alterations in fixed spinal cords.
References
1. Carvlin MJ, Asato R, Hackney DB, Kassab E, Joseph PM. High-resolution MR of the spinal cord in human and rats.AJNR Am J Neuroradiol1989;10:13–17
com-parisons of wallerian degeneration in spinal cord injury.AJNR Am J Neuroradiol1995;16:125–133
3. Quencer RM, Bunge RP, Egnor M, Green BA, Puckett WR, Post MJD. Acute traumatic central cord syndrome: MRI-pathological correlation.Neuroradiology1992;34:85–94
4. Becerra JL, Pucket WR, Marcillo AE, et al. Human spinal cord injury: MRI and histopathology.Neuroradiology1995;37(S):307–309 5. Duncan EG, Lemaire C, Armstrong RL, Tator CH, Potts DG, Linden
RD. High-resolution magnetic resonance imaging of experimental spinal cord injury in the rat.Neurosurgery1992;31:510 –517 6. Moseley ME, Cohen Y, Kucharczyk J, et al. Diffusion-weighted MR
imaging of anisotropic water diffusion in cat central nervous sys-tem.Radiology1990;176:439 – 446
7. Le Bihan D, Lallemand D, Grenier P, Cabanis E, Laval-Jeantet M. MR imaging of intravoxel incoherent motions: application to dif-fusion and perdif-fusion in neurologic disorders.Radiology1986;161: 401– 407
8. Hajnal JV, Doran M, Hall AS, et al. MR imaging of anisotropically restricted diffusion of water in the nervous system: technical, anatomic, and pathologic consideration.J Comput Assist Tomogr 1991;15:1–18
9. Rutherford MA, Cowan FM, Manzur AY, et al. MR imaging of anisotropically restricted diffusion in the brain of neonates and infants.J Comput Assist Tomogr1991;15:188 –198
10. Chenevert TL, Brunberg JA, Pipe JG. Anisotropic diffusion within human white matter: demonstration with NMR techniques in vivo. Radiology1990;177:401– 405
11. Stejskal EO, Tanner JE. Spin diffusion measurements: spin ech-oes in the presence of a time dependent field gradient.J Chem Phys1965;42:288 –292
12. Stejskal EO, Tanner JE. Use of spin echo in pulsed magnetic field gradient to study anisotropic restricted diffusion and flow.J Chem Phys1965;43:3579 –3603
13. Le Behan D, Turner R, Moonen CTW, Pekar J. Imaging of diffusion and microcirculation with gradient sensitization: design, strategy, and significance.J Magn Reson Imaging1991;1:7–28
14. Mills R. Self-diffusion in normal and heavy water in the range 1– 45°.J Chem Phys1973;77:685– 688
15. Ford JC, Hackney DB, Alsop DC, et al. MRI characterization of diffusion coefficients in a rat spinal cord injury model.Magn Reson Med1994;31:488 – 494
16. Matsuzawa H, Kwee IL, Nakada T. Magnetic resonance axonog-raphy of the rat spinal cord: postmortem effects. J Neurosurg 1995;83:1023–1028
17. Le Bihan D, Breton E, Lallemand D, Aubin ML, Vignol J, Laval-Jeantet M. Separation of diffusion and perfusion in intravoxel incoherent motion (IVIM) MR imaging.Radiology1988;168:497– 505
18. Thompson C, Henriksen O, Ring P. In vivo measurement of water self diffusion in human brain by magnetic resonance imaging. Acta Radiol1987;28:353–361


![3 {3,3 Dimethylspiro[2,3 dihydro 1H indole 2,3′ (3′H naphtho[2,1 b][1,4]oxazin)] 1 yl}propionic acid](data:image/gif;base64,R0lGODlhAQABAIAAAP///wAAACH5BAEAAAAALAAAAAABAAEAAAICRAEAOw==)