A systematic review of structural equation modelling in
nursing research
SHARIF, Saeed Pahlevan, MOSTAFIZ, Imtiaz and GUPTAN, Vinitha
Available from Sheffield Hallam University Research Archive (SHURA) at:
http://shura.shu.ac.uk/25048/
This document is the author deposited version. You are advised to consult the publisher's version if you wish to cite from it.
Published version
SHARIF, Saeed Pahlevan, MOSTAFIZ, Imtiaz and GUPTAN, Vinitha (2018). A systematic review of structural equation modelling in nursing research. Nurse Researcher, 26 (2), 28-31.
Copyright and re-use policy
See http://shura.shu.ac.uk/information.html
Sheffield Hallam University Research Archive
Structural Equation Modeling in Nursing Research: A Systematic Review
Journal Name: Nurse Researcher
Saeed Pahlevan Sharif1*, Md Imtiaz Mostafiz1, and Vinitha Guptan1 1Taylor’s Business School, Taylor’s University, Malaysia *
Corresponding Author: Saeed Pahlevan Sharif, [email protected]
Abstract
Aim: To present a systematic review of nursing papers employingstructural equation modeling. Background: A growing number of nursing studies have used structural equation modeling analysis. However, there is a paucity of research that has assessed conducting structural equation modeling analysis in nursing papers.
Data sources: Five major nursing journals were searched, each from inception until the end of February 2016. A total of 205 papers were identified.
Review methods: A methodological review and critical evaluation of the papers was provided. A content analysis was carried out to identify how nursing scholars conducted structural equation modeling method.
Discussion: The results revealed poor reporting of information about sample size determination, missing data, normality, and outliers. The majority of the studies neither computed composite reliability nor assessed convergent and discriminant validity. There was a lack of consistency in performing the analysis. Some of the studies conducted exploratory factor analysis before performing confirmatory factor analysis without discussing its necessity. Although most of the studies declared the estimation method and software used, there were still a considerable number of papers that did not disclose this information.
Conclusions: Little information about different steps of conducting structural equation modeling analysis was provided in nursing papers. Several weaknesses and areas of improvement for future empirical SEM studies were identified.
Implications for research/practice: In conducting structural equation modeling, there are many issues that should be addressed. Overlooking these issues may question the validity of the findings. The results of this review provide nursing researchers with best-practice guidelines for conducting structural equation modeling and pave the way for researchers to adopt this method in their studies.
Introduction
During recent years, covariance-based structural equation modeling (SEM) has become enormously popular in social science research (Hair et al 2013). Nursing is not an exception and a considerable body of nursing literature has been formed by the results obtained from this technique. SEM is a multivariate technique that can be seen as a hybrid of factor analysis and path analysis (Kline 2015). Indeed, SEM can be used to simultaneously examine a set of relationships between observed (directly measured, e.g. blood pressure) and latent variables (not directly measured, e.g. quality of care). There are several software packages for SEM which are mainly different in terms of their graphical interface and results presentation. The main differences between the packages include the user interface, capability to conduct multiple group analysis, and the availability of different options such as model fit indices that they provide (Narayanan 2012).
A growing number of studies in nursing research have applied SEM and this is increasing exponentially. However, there is a paucity of research that has assessed conducting SEM analysis in nursing studies. This study was conceived to fill this gap in the knowledge. Thus, this paper aimed to identify to what extent nursing researchers followed the guidelines and procedures recommended by the most prominent literature and methodological papers on SEM (Hair et al 2010, Anderson and Gerbing 1988, Byrne 2013, Ho 2013, Fornell and Larcker 1981, Meyers et al 2005, Tabachnick and Fidell 2012, Kline 2015). It is expected that the results of this critical systematic review would provide nursing researchers with best-practice guidelines for conducting SEM and pave the way for researchers to adopt high quality SEM in their studies.
Methods
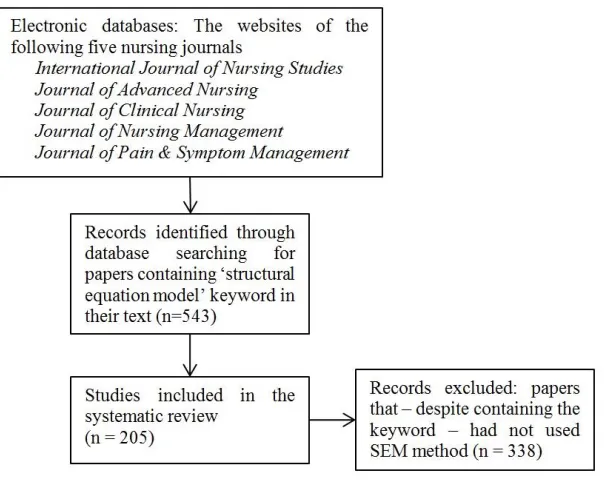
A systematic review of nursing empirical papers that used SEM analysis was performed to identify how nursing scholars implemented SEM. This systematic review was conducted by following the reporting checklist of the Preferred Reporting Items for Systematic Reviews and Meta-Analyses (PRISMA; Liberati et al 2009). All papers published in the five major nursing journals until the end of February 2016 were taken into consideration. These were: International Journal of Nursing Studies, Journal of Advanced Nursing, Journal of Clinical Nursing, Journal of Nursing Management, and Journal of Pain & Symptom Management. These five journals were among the top-tier nursing journals on Google Scholar Metrics with the highest number of empirical papers using SEM. This study acknowledges that focusing on these five journals may not be entirely representative of the body of knowledge in nursing studies. However, the findings would improve researchers’ understanding of the SEM application in this field.
Box 1. Extracted items from each included paper
Model specification and data preparation
Theoretical framework presentation
Sample size and its determination criteria
Detecting and handling outliers
Identifying and handling missing data
Assessing and handling multivariate normality
Measurement and structural model assessment
Reporting estimation method
Reporting software package
Model fit assessment
Construct validity assessment
Model re-specification
Following a two-step approach (Anderson and Gerbing 1988)
Conducting bootstrapping
The choice of these twelve criteria was based on the guidelines and recommendations of the most prominent literature on structural equation modeling (Hair et al 2010, Anderson and Gerbing 1988, Byrne 2013, Ho 2013, Fornell and Larcker 1981, Meyers et al 2005, Tabachnick and Fidell 2012, Kline 2015), which contemplated the importance of considering these points while conducting SEM analysis. A data extraction sheet was developed and pilot-tested on 30 randomly-selected included papers. One of the authors extracted the above mentioned data from the selected studies and the second author checked the extracted data. Disagreements were resolved by consensus.
Results
The search results
not meet the eligibility criteria. Figure 1 shows the selection process used in this study. In total, 205 studies were included in this systematic review. The first paper was published in 1997 and the last included paper was published in February 2016. The search results also showed that after 2006 the growth rate of the number of papers using SEM outpaced the growth of the number of all published research papers. This indicates that using SEM method has become more popular during the past ten years.
Figure 1. Flow chart of the study selection process
SEM in Nursing Studies
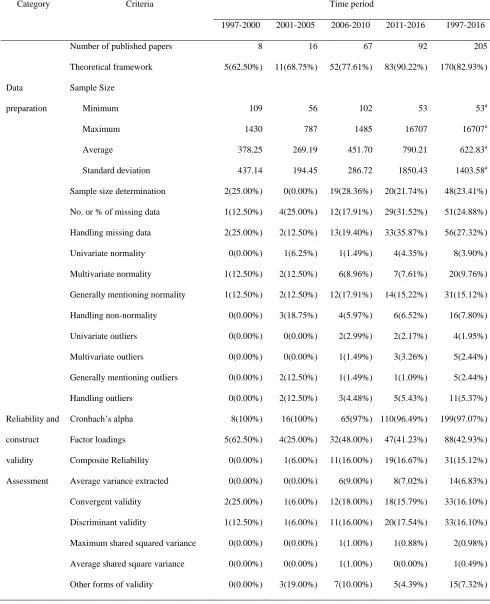
A summary of the research findings is reported in Table 1. As it is shown, 170 SEM papers (82.93%) presented their theoretical framework. The mean of the sample size used in all SEM papers was 622.83 (SD = 1403.6, range = 53 to 16,707). More than 70% of the papers used a sample size between 100 and 500. The mean and median of the sample sizes used in the articles after excluding the extreme cases were 455.84 and 342.00 respectively (SD = 359.53). The average sample size increased over time from 378.25 in the years between 1997 and 2000 and reached to 600.56 in 2016. Among them, 48 papers (23.41%) justified their sample size and 51 articles (24.88%) reported the frequency and/or the percentage of their missing cases. Handling missing cases was discussed in 56 papers (27.32%). Thus, only about a quarter of the selected papers explained about sample size determination and their missing data.
Table 1. Summary of findings
Category Criteria Time period
1997-2000 2001-2005 2006-2010 2011-2016 1997-2016
Number of published papers 8 16 67 92 205
Theoretical framework 5(62.50%) 11(68.75%) 52(77.61%) 83(90.22%) 170(82.93%)
Data
preparation
Sample Size
Minimum 109 56 102 53 53a
Maximum 1430 787 1485 16707 16707a
Average 378.25 269.19 451.70 790.21 622.83a
Standard deviation 437.14 194.45 286.72 1850.43 1403.58a
Sample size determination 2(25.00%) 0(0.00%) 19(28.36%) 20(21.74%) 48(23.41%)
No. or % of missing data 1(12.50%) 4(25.00%) 12(17.91%) 29(31.52%) 51(24.88%)
Handling missing data 2(25.00%) 2(12.50%) 13(19.40%) 33(35.87%) 56(27.32%)
Univariate normality 0(0.00%) 1(6.25%) 1(1.49%) 4(4.35%) 8(3.90%)
Multivariate normality 1(12.50%) 2(12.50%) 6(8.96%) 7(7.61%) 20(9.76%)
Generally mentioning normality 1(12.50%) 2(12.50%) 12(17.91%) 14(15.22%) 31(15.12%)
Handling non-normality 0(0.00%) 3(18.75%) 4(5.97%) 6(6.52%) 16(7.80%)
Univariate outliers 0(0.00%) 0(0.00%) 2(2.99%) 2(2.17%) 4(1.95%)
Multivariate outliers 0(0.00%) 0(0.00%) 1(1.49%) 3(3.26%) 5(2.44%)
Generally mentioning outliers 0(0.00%) 2(12.50%) 1(1.49%) 1(1.09%) 5(2.44%)
Handling outliers 0(0.00%) 2(12.50%) 3(4.48%) 5(5.43%) 11(5.37%)
Reliability and
construct
validity
Assessment
Cronbach’s alpha 8(100%) 16(100%) 65(97%) 110(96.49%) 199(97.07%)
Factor loadings 5(62.50%) 4(25.00%) 32(48.00%) 47(41.23%) 88(42.93%)
Composite Reliability 0(0.00%) 1(6.00%) 11(16.00%) 19(16.67%) 31(15.12%)
Average variance extracted 0(0.00%) 0(0.00%) 6(9.00%) 8(7.02%) 14(6.83%)
Convergent validity 2(25.00%) 1(6.00%) 12(18.00%) 18(15.79%) 33(16.10%)
Discriminant validity 1(12.50%) 1(6.00%) 11(16.00%) 20(17.54%) 33(16.10%)
Maximum shared squared variance 0(0.00%) 0(0.00%) 1(1.00%) 1(0.88%) 2(0.98%)
Average shared square variance 0(0.00%) 0(0.00%) 1(1.00%) 0(0.00%) 1(0.49%)
Table 1. (continued)
Category Criteria Time period
1997-2000 2001-2005 2006-2010 2011-2016 1997-2016
Measurement
and structural
model
assessment
Conducting EFA 2(25.00%) 2(12.50%) 22(32.84%) 23(20.18%) 49(23.90%)
Conducting CFA 5(62.50%) 3(18.75%) 48(71.64%) 81(71.05%) 137(66.83%)
Re-specification in CFA 2(25.00%) 1(6.25%) 22(32.84%) 46(40.35%) 71(34.63%)
Conducting bootstrapping 0(0.00%) 2(12.50%) 5(7.46%) 22(19.30%) 29(14.15%)
Estimation method
Maximum likelihood 3(37.50%) 8(50.00%) 38(56.72%) 65(57.02)% 114(55.61%)
Weighted least squares 1(12.50%) 0(0.00%) 0(0.00%) 6(5.26%) 7(3.41%)
Stepwise least robust 0(0.00%) 0(0.00%) 0(0.00%) 1(0.88%) 1(0.49%)
Not reported 4(50.00%) 8(50.00%) 29(43.28%) 42(36.84%) 83(40.49%)
Software Package
AMOS 1(12.50%) 5(31.25%) 30(44.78%) 57(50.00%) 93(45.37%)
LISREL 2(25.00%) 6(37.50%) 21(31.34%) 22(19.30%) 51(24.88%)
MPLUS 0(0.00%) 0(0.00%) 0(0.00%) 18(15.79%) 18(8.78%)
SAS 1(12.50%) 0(0.00%) 0(0.00%) 0(0.00%) 1(0.49%)
EQS 4(50.00%) 0(0.00%) 7(10.45%) 3(2.63%) 14(6.83%)
Others 0(0.00%) 0(0.00%) 1(1.49%) 2(1.75%) 3(1.46%)
Not Reported 0(0.00%) 5(31.25%) 8(11.94%) 12(10.53%) 25(12.20%)
The most
commonly
used model fit
indices
Chi-square, df, p-value 5(62.50%) 11(68.75%) 62(93.00%) 103(90.35%) 181(88.29%)
CFI 2(25.00%) 6(37.50%) 43(64.00%) 94(82.46%) 145(70.73%)
RMSEA 1(12.50%) 7(43.75%) 52(78.00%) 77(67.54%) 137(66.83%)
CMIN/DF 2(25.00%) 5(31.25%) 22(33.00%) 51(44.74%) 80(39.02%)
SRMR 2(25.00%) 1(6.25%) 23(34%) 40(35.09%) 66(32.20%)
GFI 1(12.50%) 6(37.50%) 23(34.00%) 34(29.82%) 64(31.22%)
NFI 2(25.00%) 1(6.25%) 22(33.00%) 21(18.42%) 46(22.44%)
AGFI 1(12.50%) 7(43.75%) 18(27.00%) 19(16.67%) 45(21.95%)
IFI 1(12.50%) 3(18.75%) 11(16.00%) 23(20.18%) 38(18.54%)
TLI 0(0.00%) 0(0.00%) 7(10.00%) 24(21.05%) 31(15.12%)
NNFI 2(25.00%) 1(6.25%) 12(18.00%) 13(11.40%) 28(13.66%)
Note: EFA: exploratory factor analysis; CFA: confirmatory factor analysis; CFI: comparative fit index; RMSEA: root mean square error of approximation; CMIN/DF: the minimum discrepancy/degrees of freedom; SRMR: standardized root mean square residual; GFI: goodness-of-fit index; NFI: normed fit index; AGFI: adjusted goodness-of-fit index; IFI: incremental fit index; TLI: Tucker-Lewis index; NNFI: non-normed fit index.
aDescriptive statistics of the sample sizes after excluding the extreme cases: minimum = 53, maximum = 2221, mean= 455.84,
[image:7.612.67.554.90.651.2]The results revealed that in order to assess reliability, while 199 papers (97.07%) computed Cronbach’s alpha, only 31 papers (15.12%) used composite reliability. Less than half of the articles (88 papers, 42.93%) reported factor loadings. Also, 33 papers (16.10%) assessed convergent and discriminant validity and 14 papers (6.83%) computed average variance extracted (AVE) of each construct. In total, 24.24% of the papers that assessed discriminant validity cited Fornell and Larcker (1981). Other forms of validity, such as content validity and face validity were assessed in 15 papers (7.32%). Assessing construct reliability, convergent validity, and discriminant validity became more prominent from 2008 onwards although it was not practiced by the majority of the papers.
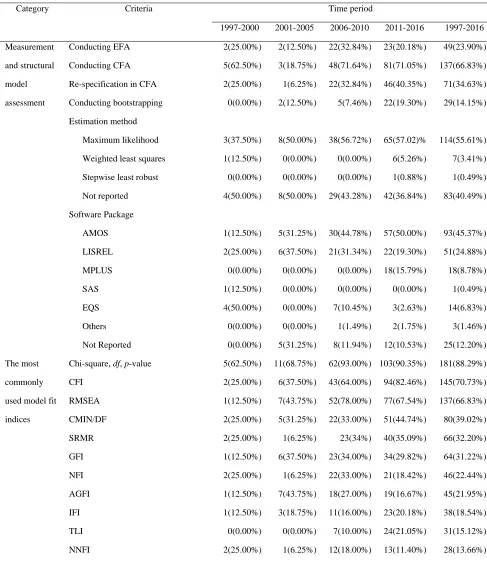
Before running confirmatory factor analysis (CFA) and SEM, 49 papers (23.90%) performed exploratory factor analysis (EFA). However, over the years, the number of papers performing EFA has reduced and reached to only 2 papers in 2014 and 2 papers in 2015. 137 articles (66.83%) conducted CFA. Among them, 71 papers re-specified their model (e.g. deleting indicators or correlating the measures error terms) to improve the model fit. Moreover, 29 articles (14.15%) performed bootstrapping. Seventeen papers reported number of resamples in which bootstrapping with 1000 resamples was the most popular one (47.06%) followed by 5000 resamples (23.53%). Conducting bootstrapping has become more common in the past few years.
The majority of the articles used maximum likelihood as the estimation method (114 papers, 55.61%). AMOS was the most common software package used (93 papers, 45.37%) followed by LISREL (51 papers, 24.88%) and MPLUS (18 papers, 8.78%). While using AMOS and Mplus is growing over the years, the number of studies that used LISREL and EQS are decreasing so that no papers used EQS after 2012 and in the last two years employing LISREL was limited to one paper per year.
Chi-square was the most commonly used index to assess model fit reported by 181 papers (88.29%) followed by comparative fit index (CFI; 145 papers, 70.73%) and root mean square error of approximation (RMSEA; 137 papers, 66.83%). After 2005, while researchers’ tendency to report nonnormed fit index (NNFI), adjusted goodness of fit index (AGFI), normed fit index (NFI), and Goodness-of-fit index (GFI) reduced, using CFI, and Chi-square/df increased. Moreover, referring to Tucker–Lewis index (TLI) is growing over time.
Discussion
of consistency in performing the analysis. While some studies performed EFA, most of them skipped EFA in favor of CFA. Although most of the papers declared the estimation method and the software used, there were still a considerable number of papers that did not disclose this information. To address these weaknesses, the following suggestions are made.
Future studies are recommended to justify their sample size and disclose more information about missing data, multivariate normality, and outliers. Generally, SEM is a large sample size technique. The minimum required sample size depends on the desired power (see SEM power estimation on RMSEA method, MacCallum, Browne, and Sugawara, 1996; on bootstrapping method, Satorra and Saris, 1985 and Yung and Bentler, 1999; and on Monte Carlo simulation, Muthén and Muthén, 2002), the size and complexity of the model, score characteristics, and distribution of the data (MacCallum et al 1996, Weston and Gore 2006, Ullman 2006). Although some researchers argue that model fit is very sensitive to sample size (Jackson 2003, Jackson 2001), using a large sample size is most often recommended in the literature (MacCallum et al 1996). Moreover, both univariate outliers (see Tukey 1977, Hoaglin et al 1986, Hoaglin and Iglewicz 1987) and multivariate outliers (Byrne 2013) should be assessed as they may influence the results and reduce the generalizability of the findings. Also, multivariate normality is one of the assumptions of Maximum likelihood. Multivariate non-normality may bias model fit statistics, standard errors and parameter estimates.
In performing the analysis, we suggest researchers to follow a two-stage approach including (i) conducting CFA and assessing the model fit, and (ii) performing SEM and testing the hypotheses. However, when researchers have little ideas about how the items are structured or previous studies on the factor structure are inconclusive, it is recommended to perform an EFA first (Anderson and Gerbing 1988, Matsunaga 2010, Pahlevan Sharif and Mahdavian 2015). This paper also suggests future researchers to assess reliability using composite reliability as well as coefficient H and/or coefficient omega. As Cronbach’s Alpha assumes equal factor loadings or error terms among all indicators, it provides a less accurate measure of construct reliability than the suggested methods (Chin 1998). Convergent validity (i.e. items correlate highly with the construct they measure) and discriminant validity (i.e. items do not correlate highly with the items of other constructs) needs to be evaluated as well (Hair et al 2010, Nunnally and Bernstein 1994, Fornell and Larcker 1981). All factor loadings and AVE (i.e. the average amount of variance in items that a construct explains) should be computed although assessing convergent validity using AVE may be too conservative (Malhotra and Dash 2011). Researchers are suggested to justify the estimation method used in their study. While since the inception of SEM, maximum likelihood has been the predominant estimation method, there are other methods that do not assume multivariate normality (e.g. weighted least squares) (Anderson and Gerbing 1988). Moreover, the software package used should be declared.
the model fit must have theoretical support. Otherwise, researchers may ‘overfit’ the model which diminishes its generalizability. Moreover, estimating the standard errors using bootstrapping is recommended. Bootstrapping is a non-parametric method, relying on random sampling with replacement that makes no distributional assumptions of variables and would estimate more reliable standard errors and confidence intervals (Dijkstra 2010).
This review is not without limitations. Although efforts were made to ensure that all SEM studies published in the selected journals to be included, it is possible that some papers have been missed. Selecting five nursing journals may not be entirely representative of all nursing studies that conducted SEM analysis. Also, reporting standards of other journals may differ. Moreover, the SEM issues that should be addressed are not limited to those that were discussed in this study although this methodological review has been relatively comprehensive.
Conclusion
References
Anderson JC, Gerbing DW (1988) Structural equation modeling in practice: A review and recommended two-step approach. Psychological Bulletin. 103, 3, 411-423.
Byrne BM (2013) Structural Equation Modeling with AMOS: Basic Concepts, Applications, and Programming. Routledge, New York.
Chin WW (1998) Partial least squares approach to structural equation modeling. In Marcoulides GA (Eds) Modern Methods for Business Research. Lawrence Erlbaum Associates, Mahwah, NJ.
Dijkstra TK (2010) Latent variables and indices: Herman Wold’s basic design and partial least squares. In Vinzi VE, Chin WW, Henseler J, Wang H (Eds) Handbook of partial least squares. Springer, Berlin.
Fornell C, Larcker DF (1981) Evaluating structural equation models with unobservable variables and measurement error. Journal of Marketing Research. 18, 1, 39-50.
Hair JF, Black WC, Babin BJ, Anderson RE (2010) Multivarite Data Analysis. Seventh edition. Prentice Hall, NewJersey.
Hair JF, Hult GTM, Ringle CM, Sarstedt M (2013) A Primer on Partial Least Squares Structural Equation Modeling. Sage, Thousand Oaks.
Ho R (2013) Handbook of Univariate and Multivariate Data Analysis with IBM SPSS. CRC Press, Northwestern.
Hoaglin DC, Iglewicz B (1987) Fine-tuning some resistant rules for outlier labeling. Journal of the American Statistical Association. 82, 400, 1147-1149.
Hoaglin DC, Iglewicz B, Tukey JW (1986) Performance of some resistant rules for outlier labeling. Journal of the American Statistical Association. 81, 396, 991-999.
Jaccard J, Wan CK (1996) LISREL Approaches to Interaction Effects in Multiple Regression. Sage Publications, Thousand Oaks, CA.
Jackson DL (2001) Sample size and number of parameter estimates in maximum likelihood confirmatory factor analysis: A Monte Carlo investigation. Structural Equation Modeling. 8, 2, 205-223.
Jackson DL (2003) Revisiting sample size and number of parameter estimates: Some support for the N: q hypothesis. Structural Equation Modeling. 10, 1, 128-141.
Kline RB (2015) Principles and Practice of Structural Equation Modeling. Guilford publications, New York.
explanation and elaboration. Annals of Internal Medicine. 151, 4, W-65-W-94.
MacCallum RC, Browne MW, Sugawara HM (1996) Power analysis and determination of sample size for covariance structure modeling. Psychological Methods. 1, 2, 130-149.
Malhotra NK, Dash S (2011) Marketing Research an Applied Orientation. Pearson Publishing, London.
Matsunaga M (2010) How to Factor-Analyze Your Data Right: Do’s, Don’ts, and How-To’s. International Journal of Psychological Research. 3, 1, 97-110.
Meyers LS, Gamst GC, Guarino AJ (2005) Applied Multivariate Research: Design and Interpretation. Sage Publications, Thousand Oaks.
Muthén LK, Muthén BO (2002) How to use a Monte Carlo study to decide on sample size and determine power. Structural Equation Modeling. 9, 4, 599-620.
Narayanan A (2012) A review of eight software packages for structural equation modeling. The American Statistician. 66, 2, 129-138.
Nunnally JC, Bernstein IH (1994) Psychometric Theory. Third edition. McGraw-Hill, New York.
Pahlevan Sharif S, Mahdavian V (2015) Structural Equation Modeling by the Use of AMOS. Fazel, Tehran.
Satorra A, Saris WE (1985) Power of the likelihood ratio test in covariance structure analysis. Psychometrika. 50, 1, 83-90.
Tabachnick BG, Fidell LS (2012) Using Multivariate Statistics. Sixth edition. Pearson, Northridge.
Thompson B (2004) Exploratory and Confirmatory Factor Analysis: Understanding Concepts and Applications. American Psychological Association, Washington DC.
Tukey JW (1977) Exploratory Data Analysis. Addison-Wesley Publishing Company, Reading,
MA.
Ullman JB (2006) Structural equation modeling: Reviewing the basics and moving forward. Journal of Personality Assessment. 87, 1, 35-50.
Weston R, Gore PA (2006) A brief guide to structural equation modeling. The Counseling Psychologist. 34, 5, 719-751.
Yung YF, Bentler PM (1999) On added information for ML factor analysis with mean and covariance structures. Journal of Educational and Behavioral Statistics. 24, 1, 1-20.