Multi-Axis Point Absorber Wave
Energy Converters
Daniel Richardson
This dissertation is submitted for the degree of Doctor of
Philosophy
May 2019
Daniel Richardson – May 2019 2
Declaration
This thesis has not been submitted in support of an application for another degree at this or any other university. It is the result of my own work and includes nothing that is the outcome of work done in collaboration except where specifically indicated. Many of the ideas in this thesis were the product of discussion with my supervisor Professor George Aggidis.
Excerpts of this thesis have been published in the following conference manuscript.
D. Richardson and G. Aggidis, “The Economics of Multi-Axis Point Absorber Wave Energy Converters,” in Proceedings of the ASME 2013 32nd International Conference on Ocean, Offshore and Arctic Engineering, Nantes, 2013.
Daniel Richardson
Daniel Richardson – May 2019 3
Abstract
A multi-axis point absorber wave energy converter (MA-PAWEC) can be defined as a point absorber wave energy converter that absorbs energy from multiple modes of body motion using a power-take-off (PTO) system operating in multiple degrees of freedom. There is a lack of knowledge around whether MA-PAWECs could produce a lower cost of energy compared to the most common point absorber type, the heaving device. This research seeks to address this gap.
A generic spherical MA-PAWEC with PTO on the heave and surge axes is assessed on an energy absorption and cost of energy basis relative to an equivalent heaving device. Linear theory was used to model the energy absorption under motion and power constraints. For heave+surge MA-PAWECs the results suggest that for low power constraints (relative to wave climate) and large available excursions then surge as the primary axis with heave as a secondary axis may be the most cost effective option. If the power constraint is large and excursions are tightly limited heave should be the primary axis with surge a secondary axis.
By selecting axes that are best suited for different wave types a MA-PAWEC can absorb energy more consistently. This gives better utilisation of grid connection infrastructure: a MA-PAWEC with the same rated grid connection as a single axis equivalent can deliver significantly more energy. A MA-PAWEC should have its PTO system sized with the sum of the individual axes PTO limits higher than the rated device output.
Daniel Richardson – May 2019 4
Acknowledgements
I would like to thank my supervisor, Professor George Aggidis, whose patience and guidance has been invaluable throughout this work, and the late Dr Andy McCabe who was always ready to discuss a problem.
A huge note of appreciation to Daphné who has supported me throughout this endeavour with sacrifices of her own.
Contents
Table of Figures ... 8
Table of Tables ... 12
Notation... 13
Glossary of Acronyms ... 15
1 Introduction ... 16
1.1 Motivation ... 16
1.2 Defining a MA-PAWEC ... 17
1.3 A Brief History of Wave Energy ... 18
1.4 Aims and Objectives ... 20
1.5 Thesis Layout ... 21
2 Literature Review ... 22
2.1 The Nature of the Resource ... 22
2.1.1 Wave Generation ... 22
2.1.2 Energy in a Wave ... 23
2.1.3 Mathematical Representation ... 24
2.1.4 Model Validity ... 27
2.1.5 Wave Spectrums ... 28
2.1.6 The Resource... 31
2.2 Wave Energy Absorption ... 33
2.2.1 Benefits of Wave Energy ... 33
2.2.2 The Engineering Challenge ... 34
2.2.3 Classification of Wave Energy Converters ... 34
2.2.4 Hydrodynamics ... 45
2.2.5 Geometry ... 54
2.2.6 Power Take Off Methods ... 55
2.2.7 Mooring ... 57
2.3 Conclusions ... 59
3 Initial Multi-Axis Considerations ... 61
3.1 The Prevalence of the Single Axis Device ... 61
3.2 Which Modes and PTO Axes? ... 62
3.2.1 Modes and Axes ... 63
Daniel Richardson – May 2019 6
3.2.3 Axis Selection ... 67
3.3 Resonance ... 69
3.4 PTO Considerations ... 69
3.5 Arrays ... 70
3.6 Conclusions ... 71
4 Relative Energy Output under Motion Constraints ... 73
4.1 Generic Device ... 73
4.2 Unconstrained Optimum Performance ... 76
4.3 Global Weighted Constraint - Optimum Performance ... 77
4.3.1 Relative Capture Widths under a Global Weighted Constraint ... 80
4.3.2 Comparative Energy Production under a Global Weighted Constraint ... 83
4.4 Independent Constraints – Optimum Performance ... 88
4.4.1 Relative Capture Widths under Independent Constraints ... 89
4.4.2 Comparative Energy Production under Independent Constraints ... 91
4.5 Conclusions ... 94
5 Relative Energy Output under Power Constraints ... 96
5.1 Power Absorbed under Optimum Motion Control ... 96
5.2 Optimum Power Absorption under Power Constraints ... 100
5.3 Optimum Power Absorption under Motion and Power Constraints ... 103
5.4 Energy Production under Motion and Power Constraints ... 108
5.5 Conclusions ... 124
6 Economics of MA-PAWECs ... 126
6.1 WEC Economics ... 126
6.2 Cost Estimation ... 128
6.2.1 Performance Characteristics... 129
6.2.2 Capital Costs (CAPEX) ... 130
6.2.3 Operating Costs (OPEX) ... 135
6.3 Levelised Cost of Energy ... 135
6.4 Conclusions ... 139
7 Conclusions ... 140
7.1 Recommendations for Further Work ... 142
References ... 143
Appendices ... 153
Daniel Richardson – May 2019 7
A.2 Appendix 2 – Relative Capture Widths under Global Weighted Motion Constraints
and Independent Motion Constraints ... 159
A.2.1 Wave Amplitude Ratio (A/a) 0.025 radii of device ... 159
A.2.2 Wave Amplitude Ratio (A/a) 0.125 radii of device ... 162
A.2.3 Wave Amplitude Ratio (A/a) 0.225 radii of device ... 165
A.2.4 Wave Amplitude Ratio (A/a) 0.325 radii of device ... 168
A.2.5 Wave Amplitude Ratio (A/a) 0.425 radii of device ... 171
A.2.6 Wave Amplitude Ratio (A/a) 0.525 radii of device ... 174
Daniel Richardson – May 2019 8
Table of Figures
Figure 1: Degrees of freedom for a floating body. ... 18
Figure 2: Orbital motions of water particles in a wave in deep water and at the shore [31]. ... 23
Figure 3: Graph showing ranges of validity for different wave theories (from [32]). In contrast to Table 1, in this graph depth is denoted by d rather than h. ... 28
Figure 4: Regular (top) and irregular (bottom) waves. ... 29
Figure 5: Bretschneider spectrum with a spectral peak of 0.1579 Hz (period of 6.3339 s) and Hs of 0.5 m. ... 30
Figure 6: Quarterly rose diagrams for peak period at the Wavehub test site [34]. ... 31
Figure 7: Global wave resource atlas [36]. ... 32
Figure 8: UK wave power resource [41]. ... 33
Figure 9: The Pelamis attenuating WEC [58]. ... 37
Figure 10: Artist’s impression of a row of Salter’s ducks acting as a terminating WEC [59]. 37 Figure 11: The PowerBuoy point absorber WEC from Ocean Power Technologies [65]. ... 38
Figure 12: WaveSub by Marine Power Systems, a submerged body MA-PAWEC [66]. ... 39
Figure 13: Categories for mode of operation of WECs (from [18]). ... 40
Figure 14: (Top) A shoreline oscillating water column WEC [68], (Bottom) A floating oscillating water column WEC [18]. ... 40
Figure 15: The WaveDragon overtopping WEC [70]. ... 41
Figure 16: Submerged pressure differential WECs. Left: AWS point absorbers [73]. Right: Bombora line absorber [74]. ... 42
Figure 17: The Corpower heaving buoy WEC [75] ... 43
Figure 18: Submerged oscillating body WECs. Left: the CETO device from Carnegie Wave [79]. Right: a multi-axis device from 40SouthEnergy [78]. ... 44
Figure 19: The Oyster bottom mounted surging WEC [80]. ... 44
Figure 20: 2D radiation patterns of a symmetrical WEC from [81]. (a) Incident wave. (b) The radiated wave when the device is moving in heave. (c) The radiated wave when the device is moving in pitch or surge. (d) The superposition of (a), (b) and (c) and represents 100% absorption of the incident wave. ... 46
Figure 21: Radiated wave pattern of a heaving axisymmetric point absorber. From [81]. The straight lines are the incident waves. The circular lines are the radiated waves. ... 46
Figure 22: Submerged sphere array configurations. ... 53
Figure 23: Evolution of the SEAREV concept, taken from [105]. ... 55
Figure 24: PTO process from wave to grid with different technologies. Adapted from [28] to include mechanical path. ... 56
Figure 25: Mooring configurations investigated by Fitzgerald and Bergdahl [113]. ... 59
Figure 26: Generic device configurations. (a) Heave PAWEC. (b) Surge PAWEC. (c) Multi-Axis PAWEC (MA-PAWEC). ... 74
Figure 27: Plot of maximum RCW for an axisymmetric device oscillating in heave, surge, and combined heave and surge. ... 76
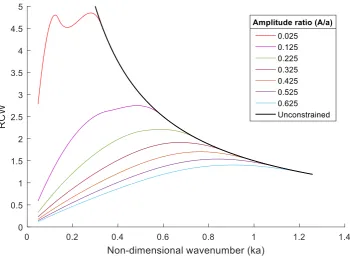
Figure 28: Relative Capture Widths (RCW) of a heaving PAWEC with a 0.5a motion constraint. ... 81
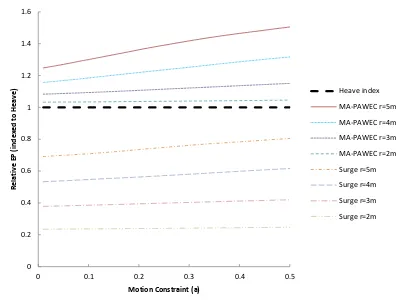
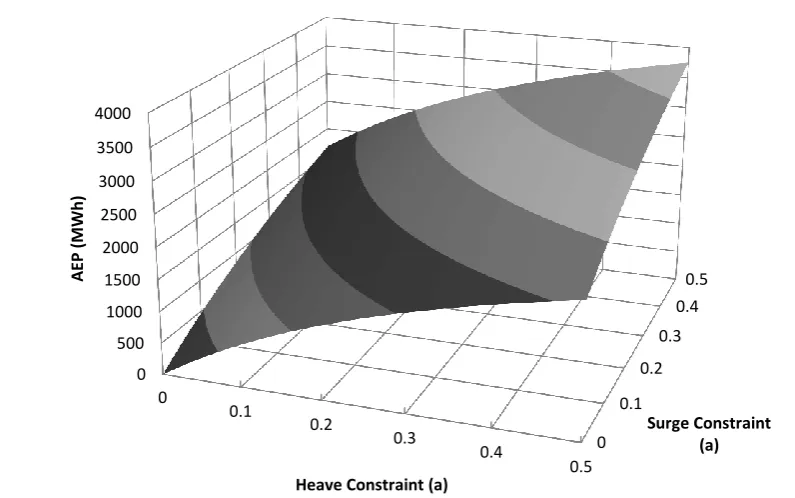
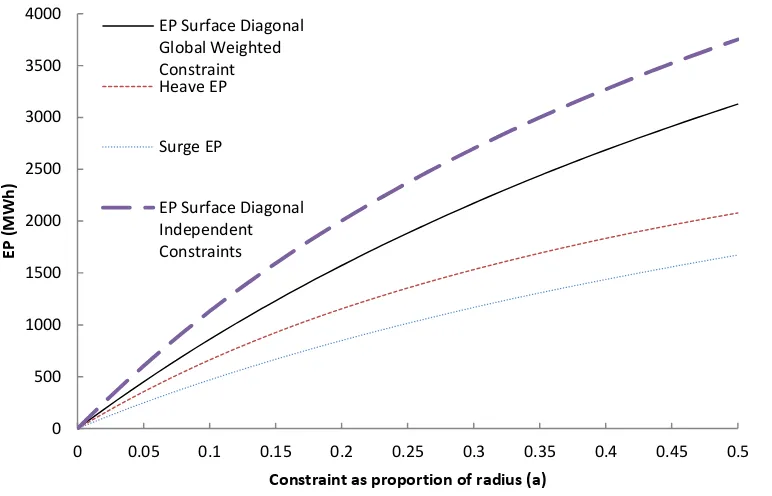
Daniel Richardson – May 2019 9 Figure 30: Relative Capture Widths (RCWs) of a heaving and surging MA-PAWEC under a global motion constraint with a constraint of 0.5a on each axis. ... 82 Figure 31: RCW for an amplitude ratio (A/a) of 0.125 at a motion constraint of 0.5a in the three configurations heave only, surge only, and heave+surge... 82 Figure 32: Energy Production (EP) of the three devices in a set of waves based on Table 2 with each axis at different motion constraints. The single mode device outputs are shown by the extreme edges of the surface. Contour shading to help show 3D curvature. ... 85 Figure 33: Energy Production (EP) of the single axis devices (extreme edges of surfaces in Figure 32) and an equal axis constraint configuration i.e. the diagonal slice from the origin of Figure 32. ... 86 Figure 34: Relative Energy Production (EP), indexed to the heave device EP value, of four different sizes of device with the radius ranging from 2m to 5m. ... 88 Figure 35: RCW of a heave+surge MA-PAWEC with independent constraints of 0.5a on each axis. ... 90 Figure 36: RCW for an amplitude ratio (A/a) of 0.125 at a motion constraint of 0.5a in the three configurations heave only, surge only, and heave+surge (both global and independent constraint curves shown). ... 90 Figure 37: Energy Production (EP) of the three devices in a wave climate based on Table 2 with each axis at different independent motion constraints. The single mode device outputs are shown by the extreme edges of the surface. Contour shading to help show 3D curvature. 91 Figure 38: Energy production at different motion constraints for the heave, surge and
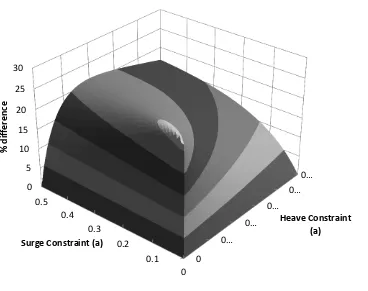
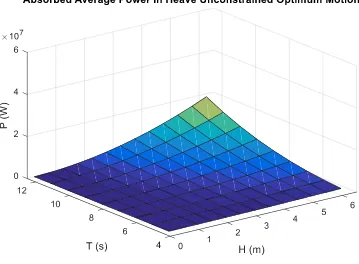
heave+surge configurations. Motion constraints are equal for each axis. Both independent and global weighted constraint curves are shown. ... 92 Figure 39: Percentage difference in energy production of the independent motion constraint heave+surge configurations vs. the global weighted heave+surge constraint, heave only and surge only. Equal motion constraints on each axis. ... 93 Figure 40: Percentage difference between the energy production under independent motion constraints and global weighted constraints. ... 93 Figure 41: Average absorbed power in Heave with unconstrained motion for an axisymmetric point absorber with optimal motion. ... 98 Figure 42: Average absorbed power in Surge with unconstrained motion for an axisymmetric point absorber with optimal motion. ... 98 Figure 43: Average absorbed power in Heave+Surge with unconstrained motion for an
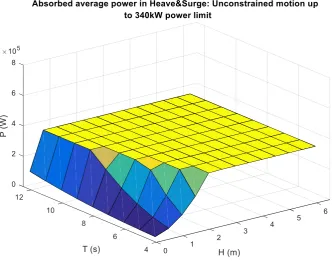
Daniel Richardson – May 2019 10 Figure 50: Power absorption matrix of the semi-submerged spherical PAWEC in heave with 0.5a motion constraint and a 340 kW power constraint. ... 104 Figure 51: Power absorption matrix of the semi-submerged spherical PAWEC in surge with 0.5a motion constraint. ... 105 Figure 52: Power absorption matrix of the semi-submerged spherical PAWEC in surge with 0.5a motion constraint and a 340 kW power constraint. ... 105 Figure 53: Power absorption matrix of the semi-submerged spherical PAWEC in heave+surge with independent 0.5a motion constraints. ... 106 Figure 54: Power absorption matrix of the semi-submerged spherical PAWEC in heave+surge with independent 0.5a motion constraints and a global power constraint of 340 kW. ... 106 Figure 55: Power absorption matrix of the semi-submerged spherical PAWEC in heave+surge with independent 0.5a motion constraints and a global power constraint of 680 kW. ... 107 Figure 56: Power absorption matrix of the semi-submerged spherical PAWEC in heave+surge with independent 0.5a motion constraints and independent power constraints of 340 kW on each axis. ... 107 Figure 57: Energy production in Heave under motion and power constraints. Power
constraints are represented by the power constraint ratio (Pc/Pwc) and are scaled per number of
axes. ... 110 Figure 58: Energy production in Surge under motion and power constraints. Power constraints are represented by the power constraint ratio (Pc/Pwc) and are scaled per number of axes. ... 110
Figure 59: Energy production in Heave+Surge under motion and global power constraints. Power constraints are represented by the power constraint ratio (Pc/Pwc) and are scaled per
number of axes. ... 111 Figure 60: Energy production in Heave+Surge under motion and independent power
constraints. Power constraints are represented by the power constraint ratio (Pc/Pwc) and are
scaled per number of axes. ... 111 Figure 61: Energy production under power and motion constraints with a power constraint 0.5Pwc. ... 113
Figure 62: Energy production under power and motion constraints with a power constraint 1Pwc. ... 113
Figure 63: Energy production under power and motion constraints with a power constraint 1.5Pwc. ... 114
Figure 64: Energy production under power and motion constraints with a power constraint 2Pwc. ... 114
Figure 65: Energy production under power and motion constraints with a power constraint 2.5Pwc. ... 115
Figure 66: Energy production under power and motion constraints with a power constraint 3Pwc. ... 115
Figure 67: Energy production under power and motion constraints with a power constraint 3.5Pwc. ... 116
Figure 68: Energy production under power and motion constraints with a power constraint 4Pwc. ... 116
Daniel Richardson – May 2019 12
Table of Tables
Table 1: Formulae for various wave properties under linear theory (formulae from [17]). ... 26
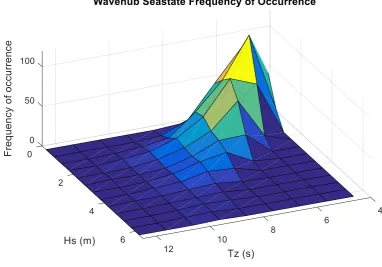
Table 2: Frequency table for the Wavehub test site plotting frequency of sea state occurrence in bins of significant wave height (Hs) and zero crossing period (Tz) [121]. ... 84
Table 3: Upper and lower bounds of the scaling factors relating the performance of the MA-PAWEC with that of the heave device. ... 129
Table 4: CAPEX scale factors for a MA-PAWEC device relative to a heave device. ... 136
Table 5: Relative LCOE matrix for the upper and lower bounds of the performance and CAPEX scaling factors. ... 137
Table 6: Relative LCOE matrix for Structure weighting of 10%, PTO of 66% ... 137
Table 7: Relative LCOE matrix for PTO weighting of 10%, Structure of 66% ... 138
Table 8: Values of the exponent k for the non-dimensional damping coefficient. ... 155
Daniel Richardson – May 2019 13
Notation
Unless otherwise specified:
Notation Description
* Denotes the conjugate transpose
A Incident wave amplitude (m)
A(ω) Frequency dependent added mass
a Radius of device (m)
AEP Annual Energy Production (J)
B(ω) Frequency dependent damping coefficient
𝐵𝑖𝑗 Frequency dependent damping coefficient for modes i,j
𝐵̅𝑖𝑗 Frequency dependent non-dimensional damping coefficient for modes i,j
B Frequency dependent damping matrix
C Buoyancy coefficient
c Celerity or phase velocity (m/s)
cg Group velocity (m/s)
Csf Capital cost scaling factor
d Water depth (m)
Ew Energy per unit width of wave (J/m)
e Euler’s number ~2.71828
Ek Kinetic Energy per unit width of wave (J/m)
Ep Potential Energy per unit width of wave (J/m)
EP Energy Production (J)
Fext External force
Ff Frequency dependent wave induced force component
FH Hydrostatic forces
FR Radiated forces
𝔽𝑅 Complex coefficient for radiated force
FS Exciting forces
FT Total force
fj Frequency of occurrence of sea state j
𝑓𝑖𝑗 Frequency of occurrence of wave with period i, height j
g Acceleration due to gravity (9.80665m/s2 to 5dp)
H Wave height (m)
Hs Significant wave height (m)
I Identity matrix
h Water depth (m)
i Imaginary number √−1
i Subscript index notation
j Subscript index notation
K PTO stiffness (N/m)
k Wavenumber (m-1)
L Capture width of a device (m)
Lopt Optimum capture width of a device (m)
Daniel Richardson – May 2019 14
N Number of degrees of freedom
P Mean power absorbed by device (W)
Pc Power constraint (W)
Pij Power absorbed from a wave with period i, height j
𝑃 𝑗 Converted useful power from sea state j (W)
Popt Optimum mean power absorption (W)
Psf Performance scaling factor
Pw Power per unit width of wave front (W/m)
Pwc Power of wave climate incident across the width of the device (W)
Re Denotes the real part of a complex variable
S Cross-sectional area at the unperturbed free surface (m2)
S(T) Spectral density (m2/Hz)
T Wave period (s)
Tp Peak period (s)
Ts Significant wave period (s)
Tz Zero-upcrossing period (s)
t Time (s)
U Complex N-vector describing the velocity of the body
UOpt Complex N-vector describing optimum velocity (m/s)
u Horizontal velocity component (m/s)
w Vertical velocity component (m/s)
X Displacement in the arbitrary X direction (m)
𝑋̇ First derivative w.r.t. time of X (m/s)
𝑋̈ Second derivative w.r.t. time of X (m/s2)
𝑋𝑖 Complex exciting force coefficient in mode i
𝑋̂𝑖 Complex exciting force coefficient in mode i for a unit amplitude wave
𝑋̅𝑖 Non-dimensional exciting force coefficient in mode i
𝕏 Complex N-vector describing exciting force
𝕏̂ Complex N-vector describing exciting force for a unit amplitude wave
𝕏𝑖𝑛𝑐 Complex coefficient for exciting force due to incident waves
𝕏𝑑𝑖𝑓𝑓 Complex coefficient for exciting force due to diffracted waves
x Displacement in the Cartesian x direction (m)
z Displacement in the Cartesian z direction (m)
α Proportion of device radius
𝛽 Wave heading (degrees) relative to device
η Free surface displacement (m)
λ Wavelength (m)
ξ Complex constant
π Pi
ρ Density (kg/m3)
ω Angular frequency (s-1)
μ Lagrange multiplier
γi Velocity constraint in each degree of freedom i
Daniel Richardson – May 2019 15
Glossary of Acronyms
Acronym Description
AEP Annual Energy Production
AWS Archimedes Wave Swing
BEM Boundary Element Method
CAPEX Capital expenditure/cost
CWR Capture Width Ratio
DECC Department of Energy and Climate Change
DNV Det Norske Veritas – an offshore standards body
DOF Degree of freedom
EOM Equation of motion
EP Energy Production
EPSRC Engineering and Physical Sciences Research Council
GHG Greenhouse gas(es)
IEA-OES International Energy Agency – Ocean Energy Systems
LCOE Levelised cost of energy
LCOEREL Relative levelised cost of energy
LUREG Lancaster University Renewable Energy Group
MA-PAWEC Multi-axis Point absorber wave energy converter
OPEX Operational expenditure/cost
OWC Oscillating water column
OWSC Oscillating wave surge converter
PAWEC Point absorber wave energy converter
SPAWEC Single point absorber wave energy converter
PTO Power-take-off
R&D Research and Development
RCW Relative Capture Width
SWL Still water level
WEC Wave Energy Converter
Daniel Richardson – May 2019 16
1
Introduction
This introductory chapter begins by setting out the motivations for research in to ocean waves as a renewable energy source before going on to introduce the concept of a multi-axis point absorber wave energy converter (WEC) which will be the central theme of this thesis. A brief history of the wave energy industry is then presented to provide context and is important for understanding the development of WECs. This is followed by a statement of the aims and objectives of this research along with a description of the layout of this thesis.
1.1
Motivation
In response to climate change and energy security concerns demand for renewable energy is increasing globally. The Paris Agreement of 2015 [1] to combat climate change resulted in many countries vowing to lower greenhouse gas (GHG) emissions and invest in a sustainable low carbon future. Worldwide investment in renewables now exceeds that for fossil fuels in a trend that is set to continue [2] [3]. The UK and EU have pledged to at least an 80% reduction in emissions from 1990 levels by 2050 with a large proportion of these reductions coming from replacing fossil fuels with renewable energy sources [4] [5] [6] [7]. For the UK, with its energetic wave climate, wave energy can play a significant part in the renewable energy mix. Many other countries could also exploit the wave energy on their shores with an estimated 2 TW of wave power available worldwide [8]. However, so far the industry has failed to develop as quickly as predicted with two of the UKs most advanced wave energy device companies going in to administration in 2014 [9] and 2015 [10]. In 2013 the UK Department of Energy and Climate Change (DECC) estimated 200-300 MW of wave energy could be installed in UK waters by 2020 [11]. By 2018 only 11.3 MW of wave energy capacity had been installed in all of Europe, with just 2.9 MW in the water, the remaining 8.4 MW having been decommissioned. Only one device was installed in the UK in 2018 and this was rated at 5.2 kW [12]. These installed values are orders of magnitude lower than estimates and insignificant relative to the scale of UK generation capacity (103.6 GW as of 2018 [13]). For comparison, 3.7 MW of new tidal stream capacity and 11.7 GW of new wind capacity was installed in Europe in 2018 [12] [14].
Daniel Richardson – May 2019 17 cost of energy in order to compete not only with fossil fuels but nuclear and other renewable technologies too. It is estimated that the cost of wave energy must be reduced by 50-75% by 2025 (from 2012 levels) in order to compete with offshore wind [15]. This thesis is intended to be a step along that path towards competitively priced wave energy.
1.2
Defining a MA-PAWEC
It will be convenient for the remainder of this thesis to reduce the cumbersome ‘Multi-Axis Point Absorber Wave Energy Converter’ to the acronym MA-PAWEC. This differentiates the concept as a subset of the more generally used acronym PAWEC (Point Absorber Wave Energy Converter). The definition of a point absorber WEC will be covered in Chapter 2, p38.
To the authors knowledge the acronym MA-PAWEC is introduced in this thesis (and derived paper). There is precedent in existing literature for the terms multi-axis, multi-mode and multi-DOF (Degree of Freedom) applied to point absorbers with the term ‘quasi point absorber’ sometimes used to refer to point absorbers that are not axisymmetric or that operate in modes other than vertically [16]. There has been little explicit work carried out on multi-axis WECs in the past and so it is necessary to specify a robust definition of the term MA-PAWEC in order to provide clarity on the boundaries of this work.
Rigid body motion can be described fully using six degrees of freedom; three translational and three rotational. These modes of motion are denoted as surge, sway, heave, roll, pitch and yaw respectively. They correspond to translation along and rotation about the x, y, z axes of the
Cartesian coordinate system centred on the body (Figure 1).The body motion and coordinate
system shown in Figure 1 was adopted by wave energy developers from the existing offshore hydrodynamic literature, upon which much of the wave energy industry theory is based. By convention, the wave train is in the direction of the positive x axis for head-on waves.
Daniel Richardson – May 2019 18 Figure 1: Degrees of freedom for a floating body.
motion of the body, and absorbing energy from multiple degrees of freedom of the PTO. A translational PTO operating on a 45 degree axis between the heave and surge axes would be able to absorb energy from both the heave and surge mode of the WEC body motions, but because it is only operating in a single degree of freedom it would not be classed as a multi-axis device under the definition used here.
The definition of a MA-PAWEC within this thesis going forward is taken as:
A point absorber wave energy converter that absorbs energy from multiple modes of
body motion using a power-take-off system operating in multiple degrees of freedom.
1.3
A Brief History of Wave Energy
Daniel Richardson – May 2019 19 The earliest wave energy patent dates back to 1799 in France [17], however modern wave energy can be considered to start with Yoshio Masuda in the 1940s in Japan. His work began with the development of a navigation buoy powered by what is now known as a floating oscillating water column (OWC) wave energy converter (WEC) [18]. In the 1970s the oil crisis prompted governments to plan alternative energy arrangements and a paper by Stephen Salter of the University of Edinburgh published in the journal ‘Nature’ in 1974 brought attention, and consequently funding, to wave energy research [19]. At the same time Christopher Cockerell’s experiments on a contouring raft were published in New Scientist. In 1975 the UK Department of Energy started a research programme into various methods of extracting wave energy and as development of ocean energy has continued other countries have started their own programmes. The early work was primarily done in the UK, Japan, Norway, US, Sweden and France [18].
In the UK, in 1978, there was a crisis of confidence in wave energy as early research indicated a high electricity cost of 20-50p/kWh. Within a year the cost estimates were down to 5-15p/kWh [20] but unfortunately for the industry the subsequent resolution of the oil crisis led to a decline in government funding in the early 1980s. The most notable achievements over the subsequent few years were the installation of several OWCs. Research activity picked up again in the early 1990s with the European Commission including wave energy in an R&D programme of renewable energies [18]. More recently still in 2001, the International Energy Agency (IEA) established an ‘Implementing agreement on Ocean Energy Systems
(IEA-OES)’ [21] .The aim of these programmes is to facilitate and coordinate ocean energy R&D
to enable commercialisation of the technology. For the present day, in the UK, wave energy is now receiving Government incentives for commercialisation of the technology via
additional tariffs for renewable energy and financing for development [22].Similar incentive
schemes are present in other countries. The UK has also invested in developing expertise in the wave energy industry with the EPSRC Supergen initiative to fund research in to marine energy [23] and which has funded this work.
Daniel Richardson – May 2019 20 Throughout this forty year period, and particularly in the latter half, after the demise of large-scale Government funded projects, there has been an overwhelming trend towards smaller devices utilising the heave response (vertical translation motion). There are many excellent reasons for choosing this configuration which will be discussed later in the thesis. In general however, it is possible to extract larger amounts of energy by utilising both the heave and
surge forces of the wave.This can be achieved with multiple PTO axes or by careful design of
a single PTO axis.
For a more detailed history and overview of wave energy the reader is referred to Cruz (ed.) [25], Salter [20], Falcao [18] and the IEA ocean energy reports [26].
1.4
Aims and Objectives
What history has showed is that the power from the many wave energy converters already proposed has proved too expensive to compete with other renewables and fossil fuels. Perhaps this cannot be said with certainty of the more recent devices as wave energy projects take years to develop and realise their full potential. However, the lack of design convergence suggests an opportunity to create improved WEC performance through novel configurations. As there are no obvious outstanding configurations it increases the probability that new designs could meet or exceed existing ones.
Aims
As a step on the path towards competitively priced wave energy, this thesis explores the concept of MA-PAWECs and in particular whether they could offer a more attractive development route for the industry. The aims of this research are:
1. To understand the design considerations inherent in developing multi-axis point
absorber wave energy converters.
2. To identify if multi-axis point absorber wave energy converters could potentially offer
Daniel Richardson – May 2019 21
Objectives
To meet these aims the following research objectives were selected:
1. Identify the criteria for selecting modes and axes for a MA-PAWEC and what is relevant to this choice.
2. Model the hydrodynamic performance of a generic MA-PAWEC against equivalent
single axis devices.
3. Model the energy output of a generic MA-PAWEC compared to equivalent single
axis devices and the implications of this on PTO choices.
4. Estimate if MA-PAWECs could generate electricity at a lower cost than the most popular PAWEC configuration today; the heaving buoy.
With the increasing demand for renewable energy and the ready availability of ocean waves as a resource, the potential for MA-PAWEC devices to decrease the cost of wave energy is something that should be researched. The current lack of knowledge of how beneficial (if at all) a multi-axis PAWEC could be over the conventional single-axis PAWEC, and the associated potential for a lower cost of energy, is the primary motivation for this research.
1.5
Thesis Layout
Daniel Richardson – May 2019 22
2
Literature Review
Chapter 2 comprises a review of existing literature relevant to MA-PAWECs. Although there is little explicit work on MA-PAWECs much of the existing work on point absorbers can be applied to the concept. During the period of writing this thesis (2011-2018) there has been an increase in the development of multi-axis devices including the launch of a new device for sea testing [27]. This is encouraging evidence that MA-PAWECs are a promising avenue of research.
As it is of fundamental importance to understand the resource you are trying to exploit, the chapter begins by examining the nature of the wave resource covering the available wave theories and resource characterisation. The engineering challenge of extracting energy from waves is then covered looking at types of device, hydrodynamics, geometry and power take off systems. For a general review of the wave energy industry the reader is referred to [28].
2.1
The Nature of the Resource
2.1.1 Wave Generation
There are many different kinds of waves present in the oceans including wind, tidal, internal, inertial and capillary [29]. Those of interest to wave energy developers are wind generated surface waves which are a product of the wind acting on the surface of the sea through pressure and shear stresses. As such, wave energy can be thought of as third generation solar energy; solar insolation heats the Earth creating thermal gradients which produce wind that create waves when blowing over a body of water. In each transition from solar to wind to waves there is an increase in the power intensity (W/m2) [17]. Thus, although the total energies of solar and wind are far larger than wave, the energy in waves is presented to us in a much denser form. High energy densities are desirable as they allow small structures to collect large quantities of energy (if they are well designed!) making the energy generation potentially more cost effective.
Daniel Richardson – May 2019 23 have travelled from their generation zone as ‘wind waves’ and ‘swell’ respectively. With knowledge of the weather patterns over the ocean fetch, swell waves at the WEC site can be predicted with good accuracy days in advance. Waves therefore have the advantage of being a more predictable source of energy than wind and solar.
2.1.2 Energy in a Wave
Waves are an energy transport phenomenon. Within a wave, energy is transferred by the orbital motion of the water particles (Figure 2). The radius of the orbit at the surface represents the amplitude of the wave, with motion decreasing exponentially with depth. Therefore below a depth of half a wavelength (λ), the water motion due to the wave can be considered negligible and in fact 95% of the energy is contained within a depth of one quarter wavelength. When the wave travels into water of depth less than half a wavelength the circular motion of the water becomes elliptical. Energy is lost through friction with the seabed and the wave slows, its wavelength decreases and it will eventually break, dissipating more energy [30]. In deep water (>λ/2) the energy is dissipated through viscous losses. As the viscosity of water is low these losses are small. Waves of period greater than nine seconds can travel long distances with little attenuation [30]. Shorter period waves dissipate much of their energy soon after leaving the generation area. White caps are the main source of dissipation – short waves lose energy on the crest of long waves [30].
Figure 2: Orbital motions of water particles in a wave in deep water and at the shore [31].
A surface water wave represents an exchange between kinetic and potential energy as it propagates. The waves of interest as a renewable energy source have a wavelength longer than 1 m so that the surface tension of the water can be neglected and gravity is the dominant
Daniel Richardson – May 2019 24 restoring force [30]. The total energy in a wave is the sum of the potential and kinetic energies. Energy per unit width of a wave front is given by the equation [17]:
𝐸𝑤= 𝐸𝑝+ 𝐸𝑘 = 𝜌𝑔𝐻2𝜆
8 ,
Equation 1
where 𝐸𝑝 is potential energy per unit width, 𝐸𝑘 is kinetic energy per unit width, 𝜌 is density of the water, 𝑔 acceleration due to gravity, H is wave height and λ is wavelength. A deep water sinusoidal wave is composed of equal parts potential and kinetic energy. Potential energy is represented by the wave height while kinetic energy is the motion of the water particles. The wave power, or energy flux, of a unit width of wave is given by [17]:
𝑃𝑤 =
𝜌𝑔𝐻2𝑐𝑔
8 ,
Equation 2
where the group velocity, 𝑐𝑔, is given by [17]:
𝑐𝑔=
𝑐 2[1 +
2𝑘ℎ sinh(2𝑘ℎ)]
Equation 3
With the deep and shallow water approximations respectively [17]:
𝑐𝑔=
𝑐 2
𝑐𝑔 = 𝑐
Equation 4
In these equations h refers to the water depth and k is the wavenumber 𝑘 = 2𝜋 𝜆⁄ in radians per metre. What arises from these equations is that in deep water the energy travels at half the speed of the wave. The result of this is that in a wave-group (a number of waves of slightly different wavelengths travelling together) waves will appear at the back of the group and disappear at the front.
2.1.3 Mathematical Representation
Daniel Richardson – May 2019 25
Linear waves
Linear wave theory (or Airy wave theory) is the simplest mathematical model of waves. In deep water this model assumes a sinusoidal profile to the surface displacement with an incompressible, irrotational and inviscid fluid. Linear theory is most accurate at describing waves with small surface displacements and so can be comfortably used with swell waves in deep water where λ/H > 50 [30]. For example, for a wave of wavelength 200 m, linear theory is remarkably accurate up to a wave height of 4 m. Accuracy of linear theory decreases with steeper waves as non-linear effects increase and the wave profile deviates further from the smooth sinusoidal wave assumption.
Linear waves have the property of superposition; waves of different heights and wavelengths can be superimposed to create other wave profiles [30]. The advantage of this superposition is the ability to analyse the WEC response to the individual wave components within a sea state and then superimpose these responses to get the resulting motion within the sea state. Table 1 shows the linear formulae for various wave properties under linear theory. The deep and shallow water approximations are also included.
The water particle velocity equations in Table 1 show that surface particle velocity increases as depth decreases. The point at which the maximum horizontal velocity exceeds the phase velocity is referred to as the break point. After this point the wave spills and energy is lost to turbulence.
Non-linear waves
While the sinusoidal profile of the linear wave is a good representation of a swell wave in deep water with a low H/λ ratio (steepness), it is not a good model for steeper waves or those in shallow water. Non-linear wave profiles tend to have narrower crests and broad troughs. As a wave moves in to shallow water it starts to be affected by the sea floor and its profile changes to having a narrow crest and wide trough. In order to better model waves that do not follow the linear profile, non-linear models have been developed.
Daniel Richardson – May 2019 26
Property Deep Water
Approximation
Transitional Shallow Water
Approximation
Validity
h/ λ > 1/2 - h/ λ < 1/20
Free Surface
Displacement (m) 𝜂 =𝐻
2cos ( 2𝜋𝑥
𝜆 − 2𝜋𝑡
𝑇 ) N/A
Period (s)
𝑇 = √2𝜋𝜆
𝑔 𝑇 = 2𝜋 [ 2𝜋𝑔
𝜆 tanh ( 2𝜋ℎ
𝜆 )]
−1
2 𝑇 = 𝜆
√𝑔ℎ
Wavelength (m)
𝜆 =𝑔𝑇
2
2𝜋 𝜆 = 𝑔𝑇2
2𝜋 tanh ( 2𝜋ℎ
𝜆 ) 𝜆 = √𝑔ℎ𝑇
Phase Velocity
(m/s)
𝑐 = 𝑔𝑇
2𝜋 𝑐 = 𝜆 𝑇=
𝑔𝑇 2𝜋tanh (
2𝜋ℎ
𝜆 ) 𝑐 = √𝑔ℎ
Group Velocity
(m/s)
𝑐𝑔=
𝑐
2 𝑐𝑔= 𝑐 2(1 +
2𝑘ℎ
sinh(2𝑘ℎ)) 𝑐𝑔= 𝑐
Water
Particle
Velocity
(m/s)
Horizontal
𝑢 =𝜋𝐻 𝑇 𝑒
𝑘𝑧 cos (𝑘𝑥 − 𝜔𝑡) 𝑢 =𝜋𝐻 𝑇
cosh[𝑘(𝑧 + ℎ)]
sinh(𝑘ℎ) cos (𝑘𝑥 − 𝜔𝑡) 𝑢 = 𝐻 2√
𝑔
ℎcos (𝑘𝑥 − 𝜔𝑡)
Vertical
𝑤 =𝜋𝐻 𝑇 𝑒
𝑘𝑧 sin (𝑘𝑥 − 𝜔𝑡) 𝑤 =𝜋𝐻 𝑇
sinh[𝑘(𝑧 + ℎ)]
sinh(𝑘ℎ) sin (𝑘𝑥 − 𝜔𝑡) 𝑤 = 𝜋𝐻
𝑇 𝑧 + ℎ
ℎ sin (𝑘𝑥 − 𝜔𝑡)
Table 1: Formulae for various wave properties under linear theory (formulae from [17]).
order theory for deep water includes a second term which is a correction to the linear profile and is given by [17]:
𝜂 =𝐻
2cos(𝑘𝑥 − 𝜔𝑡) + 3 16
𝐻2
𝑘2ℎ3cos [2(𝑘𝑥 − 𝜔𝑡)]
Daniel Richardson – May 2019 27 The corrections slightly flatten the trough and sharpen the crest. The expressions for celerity and wavelength are the same as those for linear theory. The horizontal water particle velocity according to Stoke’s second order theory for deep water is [17]:
𝑢 = 𝜔𝐻
2𝑘ℎcos(𝑘𝑥 − 𝜔𝑡) +
3 16
𝜔𝐻2
𝑘3ℎ4cos [2(𝑘𝑥 − 𝜔𝑡)]
Equation 6
A feature of Stoke’s second order theory is that it predicts the mass transport convection velocity of the waves; the orbital motions of the water particles have a net translation in the direction of wave travel. This is known as ‘Stoke’s Drift’.
As depth decreases and wave steepness increases the wave profile changes drastically from its linear sinusoidal form. The crest becomes narrower and higher while the trough becomes broader and flatter until such time as the wave breaks. For long waves in shallow water (h/λ < 0.04 [30]) the cnoidal wave theory has been developed of which the solitary wave theory is a limiting case [30]. The solitary wave is a shallow water wave of infinite length and period i.e. as its name suggests, a solitary wave is a one-time event. Theoretically the free surface of the solitary wave is entirely above the still water level (SWL). Solitary wave theory results compare well with observations of long waves in shallow water.
While non-linear wave models can be more accurate, in ‘deep water’ with swell waves the difference between the higher order wave models and linear wave models is small. As a deep water assumption is made for the modelling in this thesis and non-linear wave models are computationally more demanding than linear wave models, the modelling in this thesis assumes linear waves.
2.1.4 Model Validity
Daniel Richardson – May 2019 28 Figure 3: Graph showing ranges of validity for different wave theories (from [32]). In contrast to Table 1, in
this graph depth is denoted by d rather than h.
2.1.5 Wave Spectrums
The wave theories discussed in the previous section describe monochromatic waves i.e. regular waves with specified heights and periods. Obviously a sea state is usually not monochromatic but is composed of irregular waves of varying heights and periods. Regular wave patterns can be superimposed on each other to create irregular wave patterns. Figure 4 shows the difference between a monochromatic regular wave and the superimposed composition of many regular wave components to create irregular waves.
Irregular or random seas can be described using statistical parameters. The two most common measurable properties of water waves are height and period, and common parameters to describe irregular sea states are the significant wave height (Hs) and significant period (Ts). Significant wave height is the average height of the highest one third of waves. The significant wave period is the average period of the highest third of waves. These parameters correspond to what was visually observed by mariners taking the early wave records. As smaller waves tended to go unnoticed, the average wave parameters recorded tended to represent the average of the highest one third of the waves present.
Sea states can be represented as a spectrum of waves with the parameters height and period. The spectral density S(T) describes the occurrence of waves of particular frequency for a sea
https://www.flow3d.com/wp- content/uploads/2014/03/modeling-waves-FLOW-3D-development.jpg
Daniel Richardson – May 2019 29 Figure 4: Regular (top) and irregular (bottom) waves.
state. For fully developed seas a generic equation to describe the spectral density is [30]:
𝑆(𝑇) = 𝐴𝑇𝑚𝑒−𝐵𝑇𝑛
Equation 7
Here A and B are coefficients that depend on statistical wave properties which in turn depend on the associated wind. If measured data is available the exponent coefficients m and n can be found from curve fitting of the data. One of the most common spectrums is the Bretschneider
Overall Sea Profile at (X=0.00m, Y=0.00m)
Global Time (s)
20 15 10 5 0 S e a E le v a ti o n ( m ) 0.3 0.2 0.1 0 -0.1 -0.2 -0.3
OrcaFlex 9.8a: attempt at hemisphere vessel comparison.sim (modified 9:28 AM on 5/7/2018 by OrcaFlex 9.8a) Overall Sea Profile at (X=0.00m, Y=0.00m)
Global Time (s)
Daniel Richardson – May 2019 30 spectrum for fully developed seas for which m = 3 and n = 4. An example of a Bretschneider spectrum is shown in Figure 5.
Figure 5: Bretschneider spectrum with a spectral peak of 0.1579 Hz (period of 6.3339 s) and Hs of 0.5 m.
The peak period (Tp) of a spectrum is the period that yields the peak value in the spectral density function and represents the wave period where the energy in a wind-generated sea is at a maximum. This is of obvious interest to wave energy developers as it is where most of the energy in a sea is. It is expressed as [30]:
𝑇𝑝 = (
5 4𝐵)
1 4
Equation 8
The significant wave period (Ts) can be expressed as [30]:
𝑇𝑠= (
4 5) 1 4 𝑇𝑝 Equation 9
The directionality of the waves can play an important part in the functioning of a device if the mode of operation is directionally dependent. Many sites will have a dominant wave direction from which most of the energy is delivered but the extent of this directionality will vary between different sites due to bottom effects, fetch length in each direction and weather patterns. The directionality of the wave climate at a site can be displayed on rose diagrams.
OrcaFlex 9.8a: attempt at hemisphere vessel comparison.sim (modified 9:28 AM on 5/7/2018 by OrcaFlex 9.8a) Spectral Density for Wave Train 'Wave1'
Daniel Richardson – May 2019 31 The example rose diagrams in Figure 6 are for the Wavehub [33] test site situated 16 km off the coast of Cornwall on the south west tip of the UK and so is on the eastern edge of the Atlantic ocean. The rose diagrams are plotted for the peak period parameter. It is obvious that the dominant direction is due west, but there is spreading towards WSW which becomes more significant during the summer. What is also evident from the rose diagrams is the seasonal variation of the wave climate at this site that a WEC must operate in.
Figure 6: Quarterly rose diagrams for peak period at the Wavehub test site [34].
2.1.6 The Resource
Daniel Richardson – May 2019 32 could be optimised for. In reality the wave conditions at a particular location will vary with weather (both locally and along the fetch) over time periods as short as a matter of minutes. This variability over several time scales complicates the design process of a WEC which is trying to maximise energy generation (subject to other design considerations). The wave power available at a particular site is normally expressed as ‘average power per unit length of wave crest’. Typically wave energy developers consider a good offshore location to have a value between 20-70 kW/m (annual average) [17]. This level of energy is mostly found in moderate to high latitudes as shown below on the global wave power atlas in Figure 7. Seasonal variation is generally larger in the northern hemisphere than the southern and therefore the south coasts of South America, Africa and Australia are potentially promising wave energy sites.
Figure 7: Global wave resource atlas [36].
Daniel Richardson – May 2019 33 Figure 8: UK wave power resource [41].
WERATLAS contains detailed wave climate and wave energy statistics at 85 points off the Atlantic and Mediterranean coasts and is a useful tool for initial wave energy planning in Europe.
As waves propagate to shore they are modified by bottom effects (refraction, diffraction, bottom friction, wave breaking) and sheltering due to land (headlands and islands). Wave energy resource characterisation for nearshore/shallow water (<50 m) has only been done at specific sites. Portugal has one such nearshore wave atlas called ONDATLAS [42] which covers 500km of roughly straight Portuguese coastline with a bottom profile exhibiting little change over long stretches.
2.2
Wave Energy Absorption
2.2.1 Benefits of Wave Energy
As covered in 2.1.1 wave energy has a higher energy density than wind or solar. Solar energy
intensity is 0.1-0.3 kW/m2 [43] whereas wave energy has a much higher energy flow of about
2.3 kW/m2 for a vertical plane at the water surface [44]. It is therefore a more energy dense source of renewable energy. Waves can cross an ocean with little loss of energy and so with a
Daniel Richardson – May 2019 34 long fetch and knowledge of the weather patterns over it, wave resource can also be reliably predicted days in advance. There is limited negative environmental impact [35] with offshore devices generally having the lowest impact. In the UK there is a positive correlation between seasonal electricity demand and wave energy thus wave energy could be a very useful addition to renewable energy sources if we could engineer a device to produce electricity (or another appropriate energy vector) for a competitive price.
2.2.2 The Engineering Challenge
Conventional energy generation engineering traditionally uses high angular velocities with low torque and a regular motion. Waves present an irregular motion of low frequency (~0.1 Hz) and very high forces that must somehow be converted in to electricity of sufficient quality to be acceptable to the grid. There could be variations of this such as producing desalinated water, or powering a micro-grid with less stringent power quality requirements, however most devices to date have been designed with the aim of grid quality power. A successful WEC will accomplish this at a reasonable price which will be determined by the capital & operation costs vs. the revenue from the generated energy. The capital & operation costs will largely be driven by survivability whilst the revenue will be driven by device efficiency: a WEC must survive the worst day of the year and be efficient on the calmest. The offshore operating environment could range from waves as small as 1 kW/m crest width to storm waves with several MW/m crest width. In offshore locations wave direction can be highly variable. The saltwater will corrode materials and biomass will accumulate on any available surface, potentially adding tonnes of additional mass to the device along with increasing drag.
These are the challenges a WEC must overcome and the difficulty of meeting these challenges can be seen in the slow growth of the wave energy industry over the past 40 years.
2.2.3 Classification of Wave Energy Converters
Daniel Richardson – May 2019 35
Classification by Location
Location refers to the position of the device with respect to water depth and coastline. The three categories are Onshore, Nearshore and Offshore.
Onshore
These devices are mounted on the shoreline, either on the coast itself or in a breakwater. They have the benefit of being easily accessible for maintenance and for grid connection. The shallow water also protects them from extreme conditions by attenuating the waves. The level of this protection is obviously dependent on the local bathymetry. This attenuation can also be a disadvantage as it leads to lower wave powers than deeper water. Again, this is dependent on the site bathymetry; the attenuation due to shallow water can be compensated for by a natural focusing of the waves by the sea bed onto the site. Much like glass refracts a light wave, so the change in depth of water can bend a water wave [17]. An underwater ridge can focus the waves approaching perpendicular to it, much like a bay will spread the waves. Tidal range can also present problems. Due to the dependence on site characteristics, shoreline devices tend to be designed for a specific site and therefore may not be suitable for mass production [28]. This type of WEC could be useful for Island communities as a replacement for expensive diesel generators. Examples of onshore devices are the Islay OWC (Oscillating
Water Column) in Scotland, developed by Wavegen [43],the Pico OWC in the Azores [45]
and the Mutriku breakwater OWC in Spain [46]. They also typically have the largest visual and environmental impact due to the location on land and by reducing the natural coastline habitat.
Nearshore
Nearshore usually refers to the water depth in which the WEC is located rather than proximity to a coastline. There is a lack of consensus [28] surrounding the term ‘shallow water’ for the nearshore definition but it is suggested to be less than a quarter of the wavelength by Duckers
[37].The boundary obviously then depends on the wave travelling across it; short waves will
Daniel Richardson – May 2019 36 devices, nearshore devices will suffer from reduced wave power due to attenuation by the sea bed. However, it can be argued that the protection the device has from extreme conditions along with the lower directional spread of the waves outweigh the reduction in wave power [50]. The attenuation can also be used to the WEC’s advantage. For example, Oyster, a coupled Pitch and Surge nearshore device, benefits from the elliptical motion of the water created by the shallower water [51]. Careful site surveys to identify bottom effects are still required for nearshore devices to accurately predict wave climate. Depending on how close to land the device is located it may benefit from easier grid connection, low visual impact and low environmental impact. Maintenance is more challenging than shoreline devices but some nearshore devices compensate for this by locating some of their PTO onshore. For example, Oyster pumps high pressure sea water onshore to drive a Pelton wheel [52].
Offshore
Offshore devices are located in deep water, which, if following the shallow water definition for the nearshore zone, must begin at depths greater than one quarter wavelength. Other definitions are a depth exceeding 1/3 wavelength [44] or greater than 40 m [37]. Without bottom effects the wave climate offshore is more energetic and the visual impact is low, or none at all if sited far enough from land. However, the more energetic deep water waves may necessitate a stronger WEC and careful design of the moorings to withstand the largest storm waves. Despite the more extreme conditions in deep water making the device more structurally expensive Korde [53] has argued that the greater amount of energy available in deep water could still make it more structurally efficient (MWh/ton) than nearshore devices. Maintenance can be difficult in the offshore location if it is heavily dependent on weather windows with a high transit time to site and transmission costs may be higher for offshore sites as it will be further from a grid connection. Having an expanse of sea surrounding the device rather than being backed on to or near a shore can increase the directional spread of the waves for the WEC. Offshore typically has the lowest environmental impact.
By Principal Dimension
A WEC can be classified based on the principal dimension of the device with the three classes of device called attenuators, terminators and point absorbers [54].
Attenuator
Daniel Richardson – May 2019 37 width. The best known example of this class is the Pelamis sea snake (Figure 9), developed by Pelamis Wave Power [55]. It consists of four floating cylinders connected together at their ends by hydraulic pumps. As the wave passes along Pelamis, the different sections rise and fall and the relative motion between the cylinders is used to extract power (Pelamis also extracts energy from the wave with side-to-side motion through clever control of its hydraulic pumps and is thus a multi-axis device [56]). Attenuators typically align themselves with the incident wave direction by rotating around their mooring. Due to their shape this weather-vaning can be achieved passively. From a hydrodynamic perspective an attenuator can be thought of as the special case of a closely spaced line of point absorbers [57].
Figure 9: The Pelamis attenuating WEC [58].
Terminator
Terminators lie parallel to the wave crest (perpendicular to wave direction). These devices typically have a width much greater than their length. The Salter Duck, developed by Stephen Salter at the University of Edinburgh and the subject of his article in ‘Nature’ in 1974 [19] is a good example of a terminator (Figure 10). Because of its large width, a terminator can be approximated to 2D, and is therefore suitable for testing in narrow wave tanks. All shoreline
Figure 10: Artist’s impression of a row of Salter’s ducks acting as a terminating WEC [59].
Daniel Richardson – May 2019 38 devices are effectively terminators as the waves do not pass them; they are terminated (or partially reflected). Similar to the attenuators, incident wave direction typically is important. It can be more difficult to manoeuvre a terminator as it may not have a natural inclination to face the waves. A better strategy may be careful site selection to limit directional spread and a device design that can efficiently absorb waves from a wide angle. An example of a multi-axis terminator is the Bristol Cylinder, developed in the 1980’s by Evans [60]. This submerged cylinder can achieve close to 100% efficiency (2D), and under tank testing in a wide tank achieved capture widths exceeding the device dimensions. The same concept was more recently investigated by Heikkinen et al. [61].
Point Absorber
Point absorber wave energy converters (PAWECs or SPAWECs for ‘Single...’) have small dimensions relative to the wavelengths they are expected to operate in. There are different
values for defining what ‘small’ means. It can range from 1/20th
of a wavelength up to 1/3rd. Due to their small size it is often assumed that direction is not important for these devices. This is only true for axisymmetric devices and where the heave response is the only concern. The surge of the waves will apply an oscillating horizontal force in the direction of wave travel and if the device is asymmetric then this force will vary with wave direction and should be accounted for. An example of a directionally sensitive point absorber is the Solo Duck [62].Originally designed as a terminator, with many individual Ducks located on a flexible spine, the Solo Duck is a point absorber equivalent; a single Duck. The PowerBuoy (Figure
11) is an example of an axisymmetric PAWEC [63].It is a cylindrical buoy that operates in
heave by reacting against a submerged damper plate. The majority of PAWECs are similar to the PowerBuoy in that they are axisymmetric and operate in heave. However, some point absorbers have been designed to operate in pitch, surge, yaw, roll or a combination of these, such as the Pelican, at LUREG (Lancaster University Renewable Energy Group) [64]. Due to their lower capital cost and other perceived hydrodynamic benefits PAWECs became the
Daniel Richardson – May 2019 39 preferred option once the Government funding for large projects began to dry up. Point absorbers are small and modular allowing for gradual expansion and development of capacity rather than risking a lot of capital with a single large machine.
MA-PAWECs can be considered a subset of the point absorber WEC category. As was defined in section 1.2 a MA-PAWEC point absorber absorbs energy from multiple modes of body motion using a power-take-off system operating in multiple degrees of freedom. A recent example of a MA-PAWEC that has reached a ¼ size prototype stage for sea testing (as
of 2018) is the WaveSub developed by Marine Power Systems [27], shown in
Figure 12
.Figure 12: WaveSub by Marine Power Systems, a submerged body MA-PAWEC [66].
Classification by Mode of Operation
Further differentiation between devices is based on how the device operates to capture the wave energy. This is essentially a description of how the device provides a reaction against the force of the wave to generate energy. Falcao [18] divides the type of WEC operation in to three main categories with subcategories associated with each. These are shown in the diagram of Figure 13. Point absorbers generally come under the oscillating body category but there are examples of small floating oscillating water columns that can be counted as point absorbers [67].
Daniel Richardson – May 2019 40 Figure 13: Categories for mode of operation of WECs (from [18]).
Oscillating Water Column (OWC)
An OWC uses an air/water interface within a chamber to act as a piston (see Figure 14). The
Figure 14: (Top) A shoreline oscillating water column WEC [68], (Bottom) A floating oscillating water column WEC [18].
Daniel Richardson – May 2019 41 chamber is open at the bottom to the sea below the water line and at the top to the atmosphere via a turbine for power extraction. As waves impinge on the device the column of water inside the chamber rises and falls due to the open chamber bottom. This oscillating column of water within the chamber pressurises and de-pressurises the air above it, alternately pushing air out and drawing it back in to the chamber. The oscillating airflow passes through the turbine at the chamber top to generate power. Unless flow rectification is used the turbine configuration must be able to cope with oscillating air flows. Typically this is achieved with a Wells turbine, which rotates in the same direction regardless of the direction of fluid flow. The advantages of the OWC are its simplicity and robustness. It can be built into the shoreline as at Islay [43] or as a floating point absorber like the Backward Bent Duct Buoy [67]. Single OWCs cannot have multi-axis PTO applied to them as they use a single air/water interface to capture energy. However, multiple OWCs used together on the same WEC could be used to achieve a multi-axis device e.g. by positioning an OWC at either end of a pitching and heaving buoy.
Overtopping device
Overtopping devices consist of a reservoir raised above the waterline which is filled by the incident waves flowing up a ramp (see Figure 15). The water is then released back to the sea through low-head turbines, for example Kaplan turbines. These devices can be located
onshore as with Tapchan [18] or floating as with WaveDragon [69].WaveDragon uses a pair
of curved reflectors to focus the waves onto its central ramp.
Figure 15: The WaveDragon overtopping WEC [70].
Oscillating Bodies
This is the broadest category of WEC and consists of one or more oscillating bodies either submerged or floating. The wave action applies a force to the body which is reacted against using either the sea bed, another floating body, a damping plate or inertial mass. The category
Daniel Richardson – May 2019 42 is divided here in to Submerged Pressure Differential, Floating Bodies, Submerged Bodies, and Bottom Mounted Surge Collectors.
Submerged Pressure Differential
Submerged pressure differential devices operate using the difference in pressure between the crests and troughs of waves passing overhead. The Archimedes Wave Swing (AWS) [71] and Bombora [72] are examples of such devices. The AWS is a submerged point absorber (see Figure 16) consisting of an air filled vertical cylinder fixed to the sea bed with a moveable second cylinder (closed at the top end) fitting over it. These two parts form a chamber of air, whose volume can change depending on the applied pressure to the upper moveable cylinder. As a wave crest passes above the device the increased hydrostatic pressure presses against the moveable cylinder and compresses the air within. Once the crest has passed, the pressure from the water is reduced and the air expands again. Power is extracted using linear generators from the motion between the two cylinders. The Bombora [72] is a line absorber (attenuator) utilising the pressure differential to move air between chambers driving an air turbine in the process. Being submerged, pressure differential WECs are away from the slamming forces on the surface experienced by floating WECs and there is very little visual impact. Conversely, maintenance can be difficult. These devices are usually point or line absorbers and as these devices use the seabed as the reaction point they are typically located nearshore.
Figure 16: Submerged pressure differential WECs. Left: AWS point absorbers [73]. Right: Bombora line absorber [74].
Floating Oscillating Bodies
Floating bodies operate at the surface and are therefore exposed to maximum wave energy. An example of a point absorber floating body WEC is the Corpower heaving buoy [75] shown in Figure 17. The buoy drives a mechanical power-take-off (PTO) system deriving the reaction force from the seabed. The Pelamis [55] (see Figure 9) is an example of a line absorbing floating body WEC and it uses the phase difference between floating cylinders to provide the reaction force.The PowerBuoy [63] of Figure 11 is another floating oscillating body point absorber and uses a damping plate for its buoy to react against. Power is captured
http://www.awsocean.com/ uploads/9/1/7/6/91764510/f inal5-1024x768_2.jpg?183
Daniel Richardson – May 2019 43 from the relative movement. The Wello Penguin [76] instead uses a rotating mass inside its hull to provide a reaction against the wave induced roll, pitch and yaw of the device.
Figure 17: The Corpower heaving buoy WEC [75]
Submerged Oscillating Bodies
Submerged oscillating bodies operate beneath the surface and are therefore not exposed to potentially damaging breaking waves and slamming forces. Examples of submerged oscillating body WECs are the point absorbers CETO from Carnegie Wave Energy [77] and the multi-axis device from 40SouthEnergy [78], both shown in Figure 18. The CETO buoy drives a hydraulic PTO that pressurises water for desalination and power generation. Earlier versions pumped the water onshore but later designs incorporated energy generation equipment at sea. The multi-axis device from 40SouthEnergy uses the relative motion between two submerged bodies. The four mechanical PTO mechanisms allow it to absorb energy from the relative motion between the bodies in multiple modes.
Daniel Richardson – May 2019 44 Figure 18: Submerged oscillating body WECs. Left: the CETO device from Carnegie Wave [79]. Right: a
multi-axis device from 40SouthEnergy [78].
Bottom-mounted surging collector
The bottom-mounted surge collector generally consists of a vertical plate, hinged on the lower end (usually to the sea bed, possibly on a structure elevated above the sea bed) and aligned perpendicular to the wave direction, thus acting as a terminator (although if the dimensions are small enough it could be considered a single point absorber). The surge action of the waves causes the plate to oscillate back and forth. An example of this type of device is the Aquamarine Oyster [52] shown in Figure 19.
Figure 19: The Oyster bottom mounted surging WEC [80].