About the Authors
Mark Dodge has coauthored several popular books on Excel, including Microsoft Excel 2010 Inside Out. He is a former senior technical writer for the Microsoft Office User Assistance Group. Craig Stinson is a computer journalist and author who has written or cowritten more than 20 books, including Microsoft Excel 2010 Inside Out and Windows 7 Inside Out, Deluxe Edition.
microsoft.com/mspress
Dive into Excel 2013—and really put your spreadsheets and
data-analysis skills to work! This supremely organized reference
packs hundreds of timesaving solutions, troubleshooting tips, and
workarounds. It’s all muscle and no fluff. Discover how the experts
tackle Excel—and challenge yourself to new levels of mastery.
•
Write formulas for simple to complex calculations•
Use built-in functions or develop your own•
Apply best practices for design and formatting•
Master core to advanced charting techniques•
Embed, connect, or link to external data sources•
Work with PivotChart, PivotTable, and PowerPivot options•
Create graphics, SmartArt, and sparklines•
Perform statistical, what-if, and other data analyses•
Use Visual Basic for Applications (VBA) to write macrosMicrosoft Office/Microsoft Excel
ISBN: 978-0-7356-6905-5
U.S.A. $49.99 Canada $51.99
[Recommended]
Dodge Stinson
Micr
oso
ft Excel 2013
Inside
OUT
The ultimate, in-depth reference
Hundreds of timesaving solutions
Supremely organized, packed
with expert advice
Companion eBook + sample files
Microsoft
Excel 2013
Conquer Excel 2013—from the inside out!
OUT
Inside
Inside
OUT
For Intermediate and
Advanced Users
Companion eBook
Download using the instruction page in the back of the book.
Sample Spreadsheets
Available at
http://aka.ms/Excel2013InsideOut/files
Microsoft
Excel 2013
Redmond, Washington 98052-6399
Copyright © 2013 by Mark Dodge and Craig Stinson
All rights reserved. No part of the contents of this book may be reproduced or transmitted in any form or by any means without the written permission of the publisher.
Library of Congress Control Number: 2013935730 ISBN: 978-0-7356-6905-5
Printed and bound in the United States of America.
First Printing
Microsoft Press books are available through booksellers and distributors worldwide. If you need support related to this book, email Microsoft Press Book Support at [email protected]. Please tell us what you think of this book at http://www.microsoft.com/learning/booksurvey.
Microsoft and the trademarks listed at http://www.microsoft.com/en-us/legal/IntellectualProperty/Trademarks/ EN-US.aspx are trademarks of the Microsoft group of companies. All other marks are property of their respective owners.
The example companies, organizations, products, domain names, email addresses, logos, people, places, and events depicted herein are fictitious. No association with any real company, organization, product, domain name, email address, logo, person, place, or event is intended or should be inferred.
This book expresses the authors’ views and opinions. The information contained in this book is provided without any express, statutory, or implied warranties. Neither the authors, Microsoft Corporation, nor its resellers or distributors will be held liable for any damages caused or alleged to be caused either directly or indirectly by this book.
Acquisitions Editor: Rosemary Caperton Developmental Editor: Valerie Woolley Project Editor: Valerie Woolley
Editorial Production: Curtis Philips, Publishing.com
Technical Reviewer: Rozanne Whalen; Technical Review services provided by Content Master, a member of CM Group, Ltd.
—M
arkD
oDgeFor Kathy
v
Part 1: Examining the Excel
environment
Chapter 1What’s new in Microsoft Excel 2013 . . . .3 Chapter 2
Exploring Excel fundamentals . . . .15 Chapter 3
Custom-tailoring the Excel workspace . . . . . . . 75 Chapter 4
Security and privacy . . . .105
Part 2: Building worksheets
Chapter 5Planning your worksheet design . . . .123 Chapter 6
How to work a worksheet . . . .131 Chapter 7
How to work a workbook . . . .173
Part 3: Formatting and editing
worksheets
Chapter 8
Worksheet editing techniques . . . .191 Chapter 9
Worksheet formatting techniques . . . .285
Part 4: Adding graphics and printing
Chapter 10Creating and formatting graphics . . . .371 Chapter 11
Printing and presenting . . . .437
Part 5: Creating formulas and
performing data analysis
Chapter 12Building formulas . . . .467 Chapter 13
Using functions . . . .527 Chapter 14
Everyday functions . . . .537 Chapter 15
Formatting and calculating date
and time . . . .565 Chapter 16
Functions for financial analysis . . . .583 Chapter 17
Functions for analyzing statistics . . . .601 Chapter 18
Performing a what-if analysis . . . .633
Part 6: Creating charts
Chapter 19Designing charts . . . .667 Chapter 20
Formatting charts . . . .697 Chapter 21
Using sparklines . . . .711
Part 7: Managing databases
and tables
Chapter 22
Managing information in tables . . . .721 Chapter 23
Chapter 24
An introduction to PowerPivot . . . .805 Chapter 25
Working with external data . . . .839
Part 8: Using Excel collaboratively
Chapter 26Collaborating on a network or by email . . . .879 Chapter 27
Working in the cloud . . . .895
Part 9: Automating Excel
Chapter 28Recording macros . . . .913 Chapter 29
Creating custom functions . . . .935 Chapter 30
Debugging macros and custom
functions . . . .947
Part 10: Integrating and
extending Excel
Chapter 31
Linking, hyperlinking, and embedding . . . . .961 Chapter 32
Using Excel data in Word documents . . . .977
Appendixes
Appendix AMenu-to-ribbon command reference . . . .997 Appendix B
Keyboard shortcuts . . . .1013 Appendix C
vii
Table of contents
Introduction . . . xxiii
Who this book is for . . . xxiii
How this book is organized. . . xxiii
About the companion content . . . .xxv
Acknowledgments . . . .xxv
Support and feedback . . . .xxv
Part 1: Examining the Excel environment
Chapter 1:
What’s new in Microsoft Excel 2013
. . . .
3
New and improved for 2013 . . . .4
New templates. . . .4
Quick analysis . . . .5
Flash Fill. . . .5
Recommended charts . . . .6
New chart-formatting controls. . . .7
Timeline . . . .8
Other improvements . . . .8
Retired in 2013 . . . 10
If you missed the last upgrade . . . 10
If you missed the last two upgrades. . . 11
Moving onward with Office 2013. . . 14
Chapter 2:
Exploring Excel fundamentals
. . . .
15
Examining the Excel 2013 workspace. . . 15
Facts about worksheets . . . 15
Using the workbook window . . . 16
Exploring the ribbon . . . 22
What do you think of this book? We want to hear from you!
Microsoft is interested in hearing your feedback so we can continually improve our books and learning resources for you . To participate in a brief online survey, please visit:
Using the Quick Access Toolbar . . . 30
Accessing commands with the keyboard . . . 31
The joy of shortcut menus. . . 32
Using the Quick Analysis tool . . . 33
Meet the formula bar . . . 34
Facts about the status bar . . . 37
Introducing Backstage view . . . 39
Exploring file-management fundamentals. . . 40
Creating workbooks . . . 40
Saving files . . . 44
Opening files . . . 57
Importing and exporting files . . . 61
Importing and exporting files. . . 62
Sharing data with Excel for the Macintosh. . . 63
Sharing data beyond Excel . . . 64
Using the Help system . . . 67
Help on the surface . . . 67
Help in depth. . . 68
Recovering from crashes . . . 71
Understanding AutoRecover. . . 71
Managing versions . . . 72
Chapter 3:
Custom-tailoring the Excel workspace
. . . .
75
Customizing the ribbon . . . 75
Identifying items in the Customize Ribbon and Quick Access Toolbar categories . . 78
Creating a custom ribbon tab . . . 79
Creating a custom command group . . . 80
Adding existing command groups to custom tabs. . . 81
Resetting and recycling your customizations . . . 83
Customizing the Quick Access Toolbar . . . 84
Positioning the toolbar . . . 84
Adding tools to the toolbar. . . 86
Creating your own buttons . . . 90
Saving and resetting your custom Quick Access Toolbar . . . 91
Restoring the toolbar . . . 92
Exploring other toolbar and ribbon options . . . 94
Controlling other elements of the Excel 2010 interface . . . 95
Displaying underlying formulas . . . 97
Hiding zeros. . . 98
Enhancing accessibility . . . 99
Chapter 4:
Security and privacy
. . . .
105
The Trust Center. . . 105
Trusted publishers, locations, and documents. . . 107
App catalogs, add-ins, ActiveX settings, and macro settings . . . 108
Message bar. . . 111
External content . . . 111
File block settings . . . 112
Privacy options . . . 113
File security . . . 115
Removing personal information from your workbooks. . . 115
Using digital signatures . . . 116
Other security features . . . 120
Part 2: Building worksheets
Chapter 5:
Planning your worksheet design
. . . .
123
Which data should be in rows, and which in columns?. . . 123
Will you need to print the worksheet?. . . 125
Who is the audience? . . . 126
Would your worksheet survive without you? . . . 127
Does the worksheet rely on imported data? . . . 127
Do you need more than one worksheet? . . . 129
Have you allowed room for new data? . . . 129
Chapter 6:
How to work a worksheet
. . . .
131
Moving around regions . . . 131
Navigating regions with the keyboard . . . 132
Navigating regions with the mouse. . . 132
Navigating with special keys. . . 134
Understanding selection . . . 134
Selecting with the mouse . . . 135
Using the find and select commands . . . 138
Selecting with Go To Special. . . 139
Techniques for entering data. . . 143
Making entries in cells and in the formula bar . . . 143
Making entries in ranges . . . 151
Editing and undoing entries . . . 152
Managing worksheets. . . 154
Inserting and deleting worksheets . . . 154
Naming and renaming worksheets . . . 156
Moving and copying worksheets. . . 156
Viewing worksheets. . . 159
Splitting worksheets into panes . . . 159
Freezing panes. . . 160
Zooming worksheets . . . 162
Protecting worksheets . . . 165
Unlocking individual cells . . . 165
Protecting the workbook. . . 167
Allowing password access to specific cell ranges . . . 167
Hiding cells and worksheets . . . 170
Using passwords . . . 171
Chapter 7:
How to work a workbook
. . . .
173
Managing multiple workbooks . . . 173
Navigating between open workbooks . . . 173
Arranging workbook windows . . . 174
Comparing worksheets side by side . . . 176
Opening multiple windows for the same workbook . . . 178
Useful inconsistencies of new windows. . . 179
Hiding and protecting workbooks . . . 182
Hiding workbooks. . . 182
Protecting workbooks . . . 183
Encrypting workbooks . . . 184
Saving workbooks or windows as hidden. . . 185
Hiding worksheets . . . 185
Marking as final. . . 185
Part 3: Formatting and editing worksheets
Chapter 8:
Worksheet editing techniques
. . . .
191
Copying, cutting, and pasting . . . 191
Copying and pasting . . . 192
Cutting and pasting . . . 197
Pasting hyperlinks. . . 203
Moving and copying with the mouse . . . 204
Inserting and deleting. . . 206
Inserting columns and rows . . . 206
Inserting cells. . . 208
Deleting cells, columns, and rows . . . 210
Clearing cells . . . 214
Inserting, deleting, and clearing cells with the mouse. . . 214
Dragging with the right mouse button. . . 216
Undoing previous actions . . . 217
Redoing what you’ve undone. . . 218
Repeating your last action. . . 218
Editing cell contents . . . 219
Editing in cells or in the formula bar . . . 219
Editing options . . . 220
Filling cells and creating data series . . . 223
Controlling automatic formatting . . . 236
Finding and replacing stuff . . . 237
Specifying variables using wildcard characters . . . 242
Replacing what you find . . . 242
Getting the words right . . . 244
Fixing errors as you type . . . 244
Letting Excel help with typing chores . . . 247
Cheking yer speling . . . 249
Research resources . . . 250
Editing multiple worksheets. . . 253
Grouping worksheets for editing . . . 253
Filling a group . . . 258
Auditing and documenting worksheets. . . 259
Tracing cell references . . . 264
Adding comments to cells. . . 269
Outlining worksheets . . . 271
Outlining a worksheet with nonstandard layout. . . 273
Extending the outline to new worksheet areas . . . 274
Hiding an outline . . . 274
Collapsing and expanding outline levels . . . 274
Displaying a specific outline level . . . 275
Ungrouping and grouping columns and rows . . . 276
Consolidating worksheets . . . 276
Consolidating by position . . . 278
Consolidating by category . . . 280
Chapter 9:
Worksheet formatting techniques
. . . .
285
Formatting fundamentals. . . 286
Formatting tables . . . 288
Painting formats . . . 296
Using themes and cell styles . . . 296
Formatting with themes . . . 296
Formatting with cell styles. . . 299
Formatting conditionally . . . 306
Creating conditional formatting rules. . . 311
Managing conditional formatting rules . . . 312
Creating conditional formatting formulas . . . 315
Formatting in depth . . . 317
Formatting individual characters . . . 317
Formatting as you type . . . 318
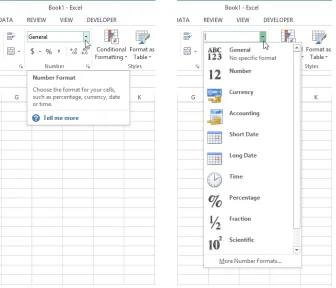
Understanding the General format . . . 319
Formatting numbers. . . 320
Aligning data in cells . . . 339
Aligning text vertically . . . 344
Using fonts . . . 348
Customizing borders . . . 350
Applying colors and patterns . . . 354
Controlling the size of cells . . . 359
Part 4: Adding graphics and printing
Chapter 10:
Creating and formatting graphics
. . . .
371
Using the Shapes tools . . . 372
Drawing constrained objects . . . 374
Drawing freehand lines and polygons . . . 376
Working with text boxes . . . 379
Working with shapes . . . 381
Creating WordArt . . . 386
Creating SmartArt . . . 388
Inserting other graphics . . . 393
Inserting online pictures and clip art. . . 393
Inserting pictures . . . 394
Inserting other objects. . . 396
Formatting graphics . . . 399
Using picture tools . . . 399
Using drawing tools . . . 405
Using SmartArt tools . . . 407
Formatting text in graphics. . . 407
Applying compression to pictures . . . 409
Using advanced object formatting effects. . . 410
Formatting embedded objects. . . 419
Working with graphic objects . . . 420
Selecting and grouping objects . . . 420
Positioning objects . . . 422
Protecting objects. . . 428
More tricks with graphic objects. . . 429
Assigning macros to objects . . . 429
Creating screenshots or pictures of your worksheets. . . 430
Chapter 11:
Printing and presenting
. . . .
437
Controlling the appearance of your pages . . . 437
Setting page options . . . 437
Working in Page Layout view . . . 441
Setting margins . . . 443
Creating a header and footer . . . 445
Setting worksheet options . . . 451
Controlling what and where to print . . . 455
Adjusting page breaks . . . 457
Using Page Break Preview . . . 457
Inserting and removing manual page breaks . . . 458
Using Print Preview . . . 459
Part 5: Creating formulas and performing data analysis
Chapter 12:
Building formulas
. . . .
467
Formula fundamentals . . . 467
Understanding the precedence of operators. . . 467
Using cell references in formulas . . . 469
Editing formulas . . . 477
Understanding error values. . . 480
Using functions: A preview. . . 480
Using the Sum button . . . 481
Inserting a function . . . 482
Using Formula AutoComplete . . . 483
Working with formulas . . . 484
Naming cells and cell ranges . . . 484
Getting explicit about intersections. . . 496
Creating three-dimensional formulas . . . 496
Formula-bar formatting. . . 497
Using structured references . . . 498
Worksheet calculation. . . 505
Recalculating manually . . . 506
Calculating part of a formula . . . 507
Working with circular references . . . 508
Understanding the precision of numeric values . . . 511
Using arrays. . . 512
One-dimensional arrays. . . 512
Array formula rules . . . 514
Two-dimensional arrays. . . 514
Single-cell array formulas . . . 515
Using array constants . . . 516
Understanding array expansion . . . 517
Linking workbooks . . . 517
Saving linked workbooks. . . 518
Opening a dependent workbook. . . 519
Editing links . . . 519
Copying, cutting, and pasting in linked workbooks . . . 520
Creating conditional tests. . . 521
Using conditional functions . . . 522
Using lookup functions . . . 525
Chapter 13:
Using functions
. . . .
527
Using the built-in function reference in Excel. . . 527
Exploring the syntax of functions . . . 531
Expressions as arguments . . . 531
Types of arguments . . . 532
Inserting functions. . . 533
Chapter 14:
Everyday functions
. . . .
537
Understanding mathematical functions . . . 537
Using the SUM function. . . 537
Using selected mathematical functions . . . 538
Using the rounding functions. . . 542
Understanding text functions . . . 545
Using selected text functions . . . 545
Using the substring text functions. . . 548
Understanding logical functions. . . 551
Using selected logical functions. . . 551
Understanding information functions . . . 554
Using selected information functions . . . 554
Using the IS information functions . . . 554
Understanding lookup and reference functions . . . 556
Using selected lookup and reference functions . . . 556
Chapter 15:
Formatting and calculating date and time
. . . .
565
Understanding how Excel records dates and times. . . 565
Entering dates and times . . . 566
Entering a series of dates. . . 568
Formatting dates and times. . . 571
Creating your own date and time formats . . . 572
Calculating with date and time . . . 576
Working with date and time functions . . . 577
Working with specialized date functions . . . 579
Chapter 16:
Functions for financial analysis
. . . .
583
Calculating investments . . . 583
The PV function. . . 584
The NPV function . . . 585
The FV function. . . 586
The PMT function . . . 586
The IPMT function. . . 587
The PPMT function . . . 588
The NPER function . . . 588
The RATE function. . . 588
The IRR function . . . 589
The MIRR function . . . 590
Calculating depreciation. . . 590
The SLN function. . . 591
The DDB and DB functions . . . 591
The VDB function . . . 592
The SYD function . . . 592
Analyzing securities. . . 593
The DOLLARDE and DOLLARFR functions . . . 594
The ACCRINT and ACCRINTM functions. . . 594
The INTRATE and RECEIVED functions . . . 595
The DISC function . . . 596
The YIELD, YIELDDISC, and YIELDMAT functions. . . 596
The TBILLEQ, TBILLPRICE, and TBILLYIELD functions . . . 596
The COUPDAYBS, COUPDAYS, COUPDAYSNC, COUPNCD, COUPNUM, and COUPPCD functions . . . 597
The DURATION and MDURATION functions . . . 597
Using the Euro Currency Tools add-in . . . 598
Chapter 17:
Functions for analyzing statistics
. . . .
601
Analyzing distributions of data . . . 601
Using built-in statistical functions . . . 601
Using functions that analyze rank and percentile. . . 604
Using sample and population statistical functions . . . 607
Understanding linear and exponential regression. . . 608
Calculating linear regression. . . 609
Calculating exponential regression . . . 615
Using the Analysis Toolpak data analysis tools. . . 616
Installing the Analysis Toolpak . . . 616
Using the Descriptive Statistics tool. . . 617
Creating histograms . . . 619
Using the Rank And Percentile tool. . . 622
Generating random numbers . . . 625
Sampling a population of numbers . . . 629
Calculating moving averages . . . 630
Chapter 18:
Performing a what-if analysis
. . . .
633
Using data tables . . . 633
Data tables based on one input variable . . . 633
Single-variable tables with more than one formula . . . 636
Data tables based on two input variables . . . 636
Editing tables . . . 638
Using the Scenario Manager . . . 639
Defining scenarios. . . 641
Browsing your scenarios . . . 643
Adding, editing, and deleting scenarios . . . 644
Routing and merging scenarios . . . 644
Creating scenario reports . . . 646
Using the Goal Seek command . . . 649
Precision and multiple solutions. . . 651
Using the Solver . . . 652
Stating the objective. . . 654
Specifying variable cells. . . 655
Specifying constraints . . . 655
Other Solver options . . . 658
Saving and reusing the Solver parameters. . . 661
Assigning the Solver results to named scenarios . . . 661
Part 6: Creating charts
Chapter 19:
Designing charts
. . . .
667
Selecting data for your chart . . . 667
Creating a new chart . . . 668
Changing the chart type. . . 672
Assigning a series to a secondary axis . . . 674
Switching rows and columns . . . 676
Choosing a chart layout . . . 678
Choosing a chart style. . . 678
Moving the chart to a separate chart sheet . . . 679
Adding, editing, and removing a chart title . . . 680
Adding, editing, and removing a legend. . . 681
Adding and positioning data labels . . . 682
Adding a data table. . . 682
Adding and removing gridlines. . . 682
Adding and editing axis titles . . . 683
Working with axes . . . 683
Changing the scale of a value axis . . . 684
Changing the scale of a category axis. . . 685
Modifying a chart’s data. . . 690
Using the mouse to add data points . . . 690
Filtering chart data . . . 691
Plotting noncontiguous source ranges . . . 692
Adding moving averages and other trendlines . . . 693
Adding error bars. . . 694
Chapter 20:
Formatting charts
. . . .
697
Formatting charts with the Chart Styles gallery. . . 697
Selecting chart elements . . . 698
Repositioning chart elements with the mouse. . . 699
Formatting lines and borders . . . 699
Formatting areas . . . 702
Choosing a solid fill. . . 702
Filling an area with a color gradient . . . 702
Filling an area with a texture or picture . . . 703
Making areas transparent . . . 704
Formatting text . . . 705
Using WordArt. . . 705
Changing the rotation of axis labels . . . 706
Changing the interval between axis labels. . . 707
Changing the position of axis labels . . . 708
Changing the numeric format used by axis labels . . . 709
Chapter 21:
Using sparklines
. . . .
711
Creating sparklines . . . 712
Creating groups of sparklines . . . 713
Expanding a set of sparklines . . . 713
Customizing sparklines . . . 714
Changing the sparkline color and weight. . . 714
Emphasizing particular points . . . 714
Customizing axes . . . 715
Adding text to sparklines. . . 717
Removing sparklines . . . 717
Part 7: Managing databases and tables
Chapter 22:
Managing information in tables
. . . .
721
How to organize a table . . . 723
Creating a table . . . 723
Overwriting default headers . . . 724
Turning a table back into an ordinary range . . . 724
Naming a table . . . 725
Expanding a table . . . 725
Adding totals to a table . . . 728
Sorting tables and other ranges . . . 730
Sorting on a single column . . . 730
Sorting on more than one column . . . 731
Sorting only part of a list. . . 733
Sorting by column . . . 733
Sorting cells that contain formulas . . . 735
Sorting months, weekdays, or custom lists . . . 737
Performing a case-sensitive sort . . . 738
Filtering a list or table . . . 739
Using filters . . . 739
Using the Advanced Filter command . . . 744
Removing duplicate records . . . 753
Using formulas with tables. . . 754
Referencing the total row . . . 756
Explicitly referencing the current row . . . 758
Referencing parts of a table . . . 759
Formatting tables. . . 760
Using themes to change style appearance. . . 762
Chapter 23:
Analyzing data with PivotTable reports
. . . .
767
Introducing PivotTables . . . 767
Creating a PivotTable. . . 771
Rearranging PivotTable fields . . . 775
Refreshing a PivotTable. . . 777
Changing the numeric format of PivotTable data . . . 778
Choosing report layout options . . . 778
Formatting a PivotTable . . . 779
Customizing the display of empty or error cells . . . 779
Merging and centering field labels . . . 779
Hiding outline controls . . . 780
Hiding the Row Labels and Column Labels headings. . . 780
Displaying totals and subtotals . . . 781
Customizing subtotals . . . 781
Sorting PivotTable fields. . . 784
Filtering PivotTable fields . . . 785
Filtering with the Report Filter axis . . . 785
Filtering with slicers . . . 786
Formatting slicers . . . 787
Filtering in the PivotTable Fields pane. . . 788
Changing PivotTable calculations . . . 792
Using a different summary function . . . 792
Applying multiple summary functions to the same field. . . 793
Using custom calculations . . . 793
Using calculated fields and items. . . 795
Grouping and ungrouping data . . . 798
Creating ad hoc item groupings . . . 798
Grouping items in date or time ranges. . . 799
Displaying the details behind a data value . . . 801
Creating PivotCharts . . . 801
Moving beyond PivotTables. . . 803
Chapter 24:
An introduction to PowerPivot
. . . .
805
Using a PivotTable on an Excel table . . . 806
Using PowerPivot in Office 2013. . . 808
Adding information to the Excel table . . . 810
Creating a data model with many tables . . . 812
Understanding relationships. . . 814
Understanding the data model. . . 816
Querying the data model . . . 817
The PowerPivot add-in . . . 819
Creating a Power View report . . . 822
Loading data from external sources. . . 827
Using the DAX language . . . 831
Creating a calculated column . . . 831
Creating a calculated field. . . 835
Chapter 25:
Working with external data
. . . .
839
Using and reusing Office Data Connections. . . 839
Setting refresh options. . . 841
Requiring or not requiring a password to refresh. . . 842
Refreshing on demand. . . 842
Opening an entire Access table in Excel . . . 843
Working with data in text files. . . 844
Using the Text Import Wizard. . . 844
Parsing Clipboard text . . . 848
Working with XML files. . . 848
Creating an ad hoc mapping of XML elements to table columns . . . 850
Importing XML data using an existing XML structure . . . 851
Using Microsoft Query to import data . . . 852
Choosing tables and fields (columns) . . . 854
Filtering records . . . 854
Sorting records . . . 856
Working directly with Microsoft Query . . . 857
Using a web query to return Internet data . . . 872
Using an existing web query. . . 872
Creating your own web query . . . 874
Part 8: Using Excel collaboratively
Chapter 26:
Collaborating on a network or by email
. . . .
879
Saving and retrieving files over a network . . . 879
Sharing workbooks on a network. . . 880
Using advanced sharing options . . . 884
Tracking changes. . . 886
Protecting the change history . . . 887
Reviewing changes . . . 888
Canceling the shared workbook session. . . 889
Combining changes made to multiple workbooks . . . 890
Distributing workbooks and worksheets by email. . . 892
Sending an entire workbook as an email attachment . . . 892
Sending a worksheet, chart, or range by email. . . 893
Sending a workbook for review . . . 894
Chapter 27:
Working in the cloud
. . . .
895
Using SkyDrive . . . 895
Working with the SkyDrive application. . . 896
Saving workbooks to and retrieving them from SkyDrive . . . 898
Working with your cloud-based SkyDrive . . . 898
Using Microsoft Office Web Apps . . . 907
Part 9: Automating Excel
Chapter 28:
Recording macros
. . . .
913
Configuring macro security. . . 914
Using the macro recorder. . . 917
Recording with relative references . . . 918
What to do when the macro recorder does not give you what you expect. . . 919
Introducing the Visual Basic Editor. . . 920
Learning the basics of Visual Basic . . . 921
Objects, methods, and properties . . . 921
The Object Browser . . . 923
Collections of objects. . . 924
Manipulating an object’s properties without selecting the object . . . 926
Naming arguments to methods. . . 926
Adding code to or editing recorded macros . . . 927
Using subroutines in macros . . . 930
Using the Personal Macro Workbook . . . 932
Going on from here. . . 932
Chapter 29:
Creating custom functions
. . . .
935
Creating a simple custom function. . . 935
Using custom functions . . . 937
Understanding custom function rules . . . 939
Using VBA keywords in custom functions. . . 939
Documenting macros and custom functions . . . 940
Creating custom functions with optional arguments . . . 941
Making your custom functions available anywhere . . . 943
Chapter 30:
Debugging macros and custom functions
. . . .
947
Using design-time tools . . . 947
Catching syntax errors . . . 948
Catching misspelled variable names . . . 949
Stepping through code . . . 950
Setting breakpoints with the Toggle Breakpoint command . . . 951
Setting conditional breakpoints using Debug.Assert . . . 952
Using the Watch Window to monitor variable values and object properties . . . 953
Using the Immediate window. . . 954
Part 10: Integrating and extending Excel
Chapter 31:
Linking, hyperlinking, and embedding
. . . .
961
Linking and embedding with OLE technology . . . 961
Embedding vs. linking . . . 961
Embedding vs. static pasting . . . 962
Embedding and linking from the Clipboard . . . 964
Embedding and linking with the Object command . . . 965
Managing links . . . 966
Linking with hyperlinks . . . 967
Creating a hyperlink in a cell. . . 968
Linking to a website or local file. . . 970
Assigning a hyperlink to a shape, image, or chart . . . 974
Selecting a cell or an object without triggering the hyperlink . . . 974
Using formulas to create hyperlinks . . . 974
Chapter 32:
Using Excel data in Word documents
. . . .
977
Using Excel tables in Word documents . . . 977
Pasting an Excel table from the Clipboard . . . 977
Using Paste Special to control the format of your table . . . 979
Using the Object command . . . 985
Using Excel charts in Word documents . . . 987
Using Excel to supply mail-merge data to Word . . . 990
Appendixes
Appendix A:
Menu-to-ribbon command reference
. . . .
997
Excel 2003 File menu. . . 997
Excel 2003 Edit menu . . . 999
Excel 2003 View menu . . . 1000
Excel 2003 Insert menu. . . 1002
Excel 2003 Format menu . . . 1003
Excel 2003 Tools menu . . . 1003
Excel 2003 Data menu . . . 1005
Excel 2003 Chart menu. . . 1007
Excel 2003 Window menu . . . 1008
Excel 2003 Help menu . . . 1008
Excel 2003 Standard toolbar . . . 1008
Excel 2003 Formatting toolbar . . . 1010
Appendix B:
Keyboard shortcuts
. . . .
1013
Shortcuts by key: Function keys . . . 1013
Shortcuts by key: Control and navigation keys . . . 1015
Shortcuts by key: Numeric keys. . . 1018
Shortcuts by key: Symbol keys and keypad. . . 1019
Shortcuts by task: Insert charts . . . 1021 Shortcuts by task: Work in dialog box text boxes . . . 1021 Shortcuts by task: Work in dialog boxes . . . 1021 Shortcuts by task: Edit data . . . 1022 Shortcuts by task: Work with formulas . . . 1022 Shortcuts by task: Enter data . . . 1023 Shortcuts by task: Select cells . . . 1024 Shortcuts by task: Filter tables. . . 1025 Shortcuts by task: Work with borders . . . 1025 Shortcuts by task: Format data . . . 1025 Shortcuts by task: Work with Help . . . 1026 Shortcuts by task: Insert, delete, and copy cells. . . 1026 Shortcuts by task: Work with macros . . . 1027 Shortcuts by task: Work with the ribbon . . . 1027 Shortcuts by task: Move and scroll in End mode . . . 1027 Shortcuts by task: Move and scroll in worksheets . . . 1028 Shortcuts by task: Move within a selected range. . . 1028 Shortcuts by task: Print . . . 1029 Shortcuts by task: Work in Backstage view. . . 1029 Shortcuts by task: Select cells, rows, columns, and objects . . . 1029 Shortcuts by task: Select cells with special characteristics . . . 1030 Shortcuts by task: Work with outlines . . . 1030 Shortcuts by task: Work with options menus . . . 1030 Shortcuts by task: Work with task panes . . . 1031 Shortcuts by task: Navigate Windows . . . 1031 Shortcuts by task: Work with worksheets . . . 1032
Appendix C:
Function reference
. . . .
1033
Alphabetical list of Excel 2013 functions . . . 1034
Index to troubleshooting topics
. . . .
1089
Index
. . . .
1091
What do you think of this book? We want to hear from you!
Microsoft is interested in hearing your feedback so we can continually improve our books and learning resources for you . To participate in a brief online survey, please visit:
xxiii
M
iCroSoft exCel 2013 has evolved from being a robust grid-based number-cruncher,to becoming the world’s most robust grid-based number-cruncher that also hap-pens to be pretty good at text manipulation, graphics, and many other things that were barely imaginable back in the days of Excel 1.0.
Excel is a tool that can be applied to many business tasks, including statistics, finance, data management, forecasting, analysis, inventory, billing, business intelligence, even word processing and graphic design. Excel is also one of the world’s most popular programs for keeping all kinds of business and personal lists, from professional contacts to family addresses to home inventories.
There are a lot of great features to learn about, so let’s get started.
Who this book is for
This book offers a comprehensive look at the features most people will use in Excel 2013 and serves as an excellent reference for users who need to understand how to accomplish what they need to do. In addition, this book goes a step or two further, providing useful information to advanced users who need to understand the bigger picture.
Assumptions about you
The Inside Out series is designed for readers who have some experience with Excel and are pretty comfortable finding their way around the program. You don’t have to be a power user or an Excel developer.
How this book is organized
This book gives you a comprehensive look at the various features you will use. This book is structured in a logical approach to all aspects of using and managing Excel 2013.
Part 1, “Examining the Excel environment,” covers the new features in the 2013 release, and also discusses the basics of using Excel.
Part 3, “Formatting and editing worksheets,” covers all aspects of editing text and data, and applying cosmetics to make your worksheets more user-friendly.
Part 4, “Adding graphics and printing,” describes how to work with Excel’s full-featured graphics tools and how to prepare your worksheets for printing.
Part 5, “Creating formulas and performing data analysis,” explains in detail how to construct formulas, and how to use Excel’s sophisticated analysis tools.
Part 6, “Creating charts,” shows how to get the most out of Excel’s robust charting tools.
Part 7, “Managing databases and tables,” covers the special properties of tables and Pivot-Tables, and describes how to work with external data.
Part 8, “Using Excel collaboratively,” discusses issues surrounding the use of Excel work-books and worksheets on the Internet and with email systems, and also covers Office 365.
Part 9, “Automating Excel,” covers recording and debugging macros and creating custom functions.
Part 10, “Integrating and extending Excel,” discusses the use of hyperlinks, the sharing of data among Office programs, and more.
Does your ribbon look different?
The screen images shown in this book were captured at the screen resolution,
magni-fication, and text size that are optimum for publication purposes. The ribbon on your
About the companion content
We have included this companion content to give you an opportunity to gain hands-on experience with some of the concepts explored in this book. You can download this book’s companion content from the following page:
http://aka.ms/Excel2013InsideOut/files
The companion content includes sample Excel workbooks and other sample content referred to in the text.
Acknowledgments
We are lucky to have the best editorial team in the business, making authors look better than they deserve and facing inevitable issues with grace and thoughtfulness. Many thanks to project manager and shepherd-in-chief Curtis Philips; eagle-eye tech editor Rozanne Whalen; our copy editor, the incessantly nit-picky Roger LeBlanc; our proofreader and last line of defense, Andrea Fox; and the intrepid Valerie Woolley and Rosemary Caperton, cranking the big ol’ book-making machine at Microsoft Press. It’s always a pleasure to play with the A-team.
Support and feedback
The following sections provide information on errata, book support, feedback, and contact information.
Errata & support
We’ve made every effort to ensure the accuracy of this book and its companion content. Any errors that have been reported since this book was published are listed on our Micro-soft Press site at oreilly.com:
http://aka.ms/Excel2013InsideOut/errata
If you find an error that is not already listed, you can report it to us through the same page.
If you need additional support, email Microsoft Press Book Support at
We want to hear from you
At Microsoft Press, your satisfaction is our top priority and your feedback our most valuable asset. Please tell us what you think of this book at
http://www.aka.ms/tellpress
The survey is short, and we read every one of your comments and ideas. Thanks in advance for your input!
Stay in touch
1 1
Examining the Excel
environment
CHAPTER 1
What’s new in Microsoft Excel 2013
. . . .
3
CHAPTER 2
Exploring Excel fundamentals
. . . .
15
CHAPTER 3
Custom-tailoring the Excel workspace
. . . .
75
CHAPTER 4
3
3
What’s new in Microsoft Excel 2013
C
onSiDering recent computing history, including the advent of Microsoft Windows 8and the increasing ubiquity of tablets and touch interfaces, the modest but impor-tant improvements made to Microsoft Excel 2013 might seem like a relative island of calm in rough digital seas. In 2007, there was truly a paradigm shift in Microsoft Excel and Office, and Office 2010 was a significant refinement. The 2013 version represents a fur -ther refinement, a “flatter” appearance, and an increased presence of the Office brand. Web Apps have been available for years now, becoming ever more capable, and are available to anyone with even a free Microsoft account. You can run Office apps on Windows phones, and Microsoft Surface tablets come with Office installed. More people are using Excel in more places. We’re happy to say, it’s better than ever.
New and improved for 2013 . . . . . . . . . . . . . . . . . . . . . . . . . .4
Retired in 2013 . . . .10
If you missed the last upgrade . . . .10
If you missed the last two upgrades . . . .11
Chap
ter
1
New and improved for 2013
First, we’ll highlight the new features in the 2013 release of Microsoft Excel. Later, we’ll talk about features that have been retired from the program and summarize the features that will be new to you if you skipped the last upgrade or two.
New templates
[image:30.531.111.458.272.508.2]It seems as if templates have always been a bit of an afterthought—as if someone slapped together some generic sheets quickly, after everything else was done. No more. Excel 2013 has a new interface for templates, as shown in Figure 1-1, and now it offers some of the most sophisticated and useful prepackaged workbooks you’ve ever seen. They succeed in banishing the typical wall of numbers from your desktop, while delivering a lot of useful, well-thought-out functionality. These templates are useful, and what’s more, you can learn from them. For more information, see “Creating workbooks” in Chapter 2, “Exploring Excel fundamentals.”
Chap
ter
1
Quick analysis
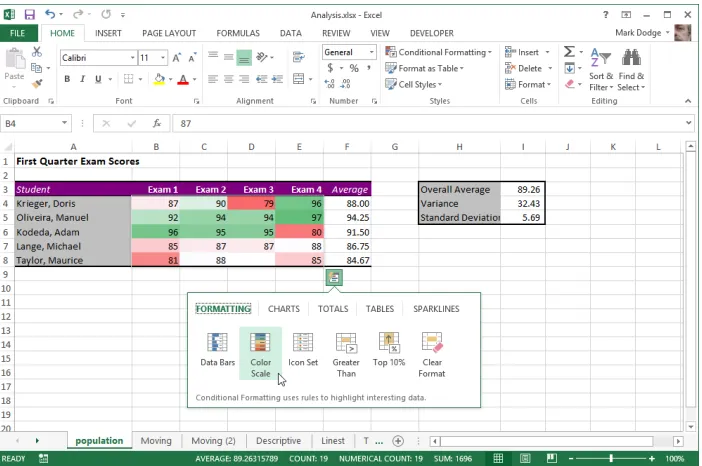
[image:31.531.122.473.174.407.2]If you select more than one nonempty cell, the new Quick Analysis tool appears at the lower right corner of the selected range. Clicking it displays a context-sensitive toolbar con-taining tabs and controls applicable to the contents of the selected cells. As you move the pointer over icons on the Quick Analysis toolbar, as shown in Figure 1-2, a live preview is applied to the selected data on the worksheet. Just click the icon to make it stick. For more information, see “Using the Quick Analysis tool” in Chapter 2.
Figure 1-2 Select a range and click the Quick Analysis button to display sets of applicable tools.
Flash Fill
Chap
ter
1
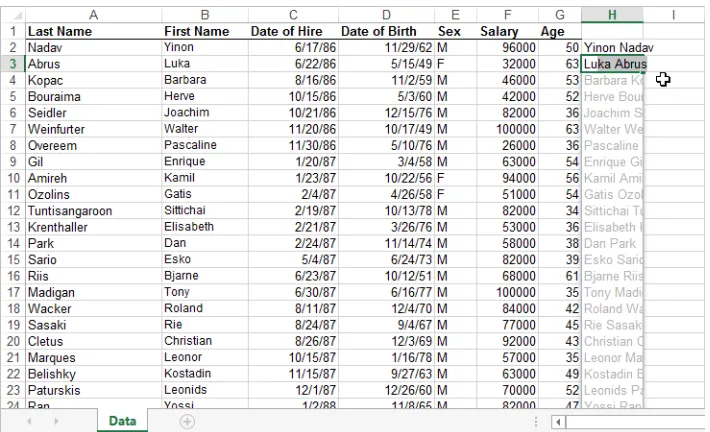
[image:32.531.111.466.101.317.2]more information, see “Automatic parsing and concatenation using Flash Fill” in Chapter 8, “Worksheet editing techniques.”
Figure 1-3 Typing one full name into cell H2 was all the information Flash Fill needed to correctly guess the desired results, which were suggested after only one letter was typed into cell H3.
Recommended charts
Chap
ter
1
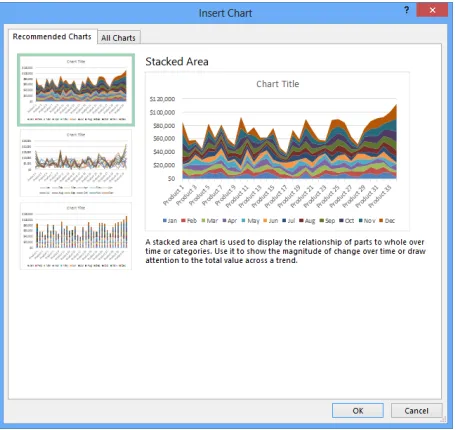
Figure 1-4 Recommended Charts analyzes your data and suggests a few appropriate charts.
New chart-formatting controls
[image:33.531.121.349.65.280.2]After you create a chart, it is now easier than ever to modify it. The Chart Elements and Chart Styles buttons appear to the right of a chart when it is selected, offering instant chart-formatting gratification, as shown in Figure 1-5. Click options to add or remove elements in the chart, or change the chart’s styles and colors. For more information, see “Adding, edit-ing, and removing a chart title” in Chapter 19.
Chap
ter
1
Timeline
You might call the new Timeline feature a date slicer. If your data includes dates, as in Fig-ure 1-6, you can include a Timeline with your PivotTable or PivotChart that is used to limit the displayed data to any date range you want—in days, months, quarters, or years. For more information, see ”Creating a Power View report” in Chapter 24, “Using PowerPivot.”
Figure 1-6 You can click any month segment on the Timeline bar to display only that month’s data, or drag a handle to include as many months as you want.
Other improvements
Here are more upgrades and enhancements you’ll find in Excel 2013:
● Recommended PivotTables Similar to the Recommended Charts feature,
Recom-mended PivotTables analyzes the selected data and offers appropriate suggestions. For more information, see Chapter 24.
● Table slicers Slicers were introduced in 2010, but they worked only with
Pivot-Tables. The interface has been upgraded for 2013, and you can now use slicers with other kinds of data tables as well. For more information, see “Creating a Power View report” in Chapter 24.
● One workbook, one window, one worksheet New workbooks contain a single
sheet in 2013, not three. And previously, all open workbooks were enclosed within a single Excel window. Now, each workbook is its own window, making it easier to work with multiple workbooks, particularly for multiple-monitor users. For more informa-tion, see Chapter 7, “How to work a workbook.”
● Rich chart data labels Data labels in charts are more customizable in 2013. You
Chap
ter
1
● Animations As you work in Excel 2013, you’ll notice subtle animations in various
situations, including updating charts, inserting data, and copying and pasting. For example, when you insert a row, the rows below the new row appear to scroll down-ward. This was formerly referred to as visceral feedback, which is a clue to its true value. The animations are not exactly essential, but they help illustrate the changes incurred by your actions.
● Standalone PivotCharts Now, your Pivot Charts do not need to remain tethered
to a PivotTable; you can copy and paste them as you wish, without the baggage. For more information, see “Creating PivotCharts” in Chapter 23, “Analyzing data with PivotTable reports.”
● New functions There are always new functions, and this time, most of them are
meant to increase compatibility with the Open Document format.
● The Excel Data Model Some of the power from the PowerPivot add-in that was
introduced in Excel 2010 has now been incorporated into Excel as the Excel Data Model, which you can use to address multiple tables of data from within Excel. For more information, see Chapter 24.
● Power View This new feature leverages the power of the Excel Data Model, which
you can use to construct elaborate presentation-ready reports that include graph-ics and data from multiple tables or external data sources. For more information, see “Creating a Power View report” in Chapter 24.
Does your ribbon look different?
In this book, we provide instructions based on traditional keyboard and mouse input methods . If you’re using Excel on a touch-enabled device, you might be using a
sty-lus or your finger to give commands. If so, substitute a tapping action any time we
Chap
ter
1
Retired in 2013
These are features whose services were no longer required this time around:
● Save Workspace Because of the new “One workbook, one window” interface, the
Save Workspace command lost most of its reason to exist.
● Window Split box Near the vertical scroll bar, lived a little box you could
double-click to split the worksheet into panes. Although you can do the job using the Split button on the View tab, the box was inexplicably removed—perhaps another casualty of the “one workbook, one window” interface.
If you missed the last upgrade
Just in case you leapfrogged a software upgrade and missed the last big Microsoft Office release, here is a brief description of a few features that are essentially new to you but were introduced in the previous release:
● Backstage view The File tab opens what Microsoft calls Backstage view, a single
location where you find essential controls and information about your documents and where most of Excel’s behind-the-scenes options and settings reside. The tra-ditional File menu commands are here, too—for opening, saving, and creating new files; using templates; printing; and sharing information with others.
● Ribbon customization Users of the static ribbon in Excel 2007 will be happy to
know they can now freely rearrange command groups; change the order and posi-tion of tabs; remove groups; create custom commands, groups, and tabs; and show or hide existing tabs.
● Sparklines Sparklines are tiny charts that fit within a cell and give you a visual sum
-mary alongside your data.
● Paste Preview In Excel, you now can preview how copied information will look
before you paste it. When you copy and then click the Paste menu (on the Home tab in the Clipboard group), hovering over the option buttons displays what each one will do on the worksheet if and when you actually click it.
● Improved picture editing Now when you want to insert a picture in a workbook,
you can edit it directly in Excel—you no longer need to prepare it in advance using a photo-editing program.
● Office Web Apps Providing a familiar Microsoft Office experience when you are
Chap
ter
1
PowerPoint, and OneNote files from just about anywhere, offering browser-based viewing and lightweight editing.
● Slicers Slicers provide an easy way to filter large PivotTables so that you can see
exactly the data you need without being distracted by data you don’t need.
● Improved conditional formatting New conditional formatting options let you
quickly visualize and comprehend data. You will find more styles, icons, and data bars, and you now have the ability to highlight specified items (such as the maximum or minimum value) in a few clicks.
● New functions and functional consistency Microsoft added a number of
statisti-cal and financial functions that extend or refine existing functionality. Most of the new functions are statistical distribution functions. For example, in addition to the existing COVAR function, a measure of deviation between data sets, you can now choose COVARIANCE.P or COVARIANCE.S, which applies to an entire population of data (P) or a representative sample (S).
● Improved math equation support Create and display math equations with a rich
set of equation-editing tools.
● Improved charting capacity Two-dimensional charts in Excel 2007 were limited to
32,000 data points per series. Chart series are now limited only by system memory.
● Additional SmartArt graphics Incorporate great-looking graphics into your
pro-fessional documents without a large consulting team or time commitment.
● 64-bit edition Excel 2010 introduced 64-bit scalability for the Excel guru or analyst
working with massive, memory-intensive datasets.
● Office Mobile Microsoft Office Mobile brought Office tools to the mini screen of
your mobile device.
If you missed the last two upgrades
If you are one of the people clinging to Excel 2007 and managed to hang in there all this time, well . . . hey, it’s time to upgrade. Here is a summary of the things that were changed in Excel 2007:
● Results-oriented user interface The old toolbars and menu bar have been
Chap
ter
1
Graphics enhancements Excel has improved greatly over the years as a platform for graphics and design, and the 2007 release incorporated a few subtle enhance-ments, including a robust SmartArt feature; improvements to conditional formatting, shapes, and charting; and new document themes and cell styles.
● Improved formatting Microsoft built a lot more intelligence into the formatting
features of Excel 2007—including themes, cell styles, and galleries. You can use Live Previews to rest the pointer on an item in a palette of options to see what will hap-pen when and if you click.
● Page Layout view Really more than a view, Page Layout view became a working
mode with rulers and page previews in which you have full editing functionality and control over the appearance of your documents.
● Increased capacity and speed The new XML file format and other internal
improvements gave Excel 2007 greatly increased capacities in just about every specification—for example, spreadsheets that can hold more than one million rows of data, 64 levels of nesting in formulas, and built-in support for multicore processors and multithreaded chipsets. Other major specification changes included
❍ The total number of available columns: 16,384 (was 256).
❍ The total number of available rows: 1,048,576 (was 65,536).
❍ The total amount of computer memory: Excel can now use the maximum
allowed by Windows (was 1 gigabyte).
❍ The number of unique colors allowed in a single workbook: 4.3 billion (was 56).
❍ The number of conditional format conditions on a cell: Limited only by
avail-able memory (was 3).
❍ The number of levels of sorting you can perform on a range or table: 64
(was 3).
❍ The number of items allowed in the Filter drop-down list: 10,000 (was 1,000).
❍ The total number of unique cell formats in a workbook: 64,000 (was 4,000). ❍ The maximum number of characters allowed in formulas: 8,000 (was 1,000).
❍ The number of levels of nesting that Excel allows in formulas: 64 (was 7).
Chap
ter
1
❍ The maximum number of items returned by the Find command: 2 billion (was
64,000).
❍ The number of rows allowed in a PivotTable: 1 million (was 64,000).
❍ The number of columns allowed in a PivotTable: 16,000 (was 255).
❍ The maximum number of unique items within a single PivotTable field: 1 mil
-lion (was 32,000).
❍ The maximum length of the MDX name for a PivotTable item, the string length
for a relational Pivot Table, the caption length, and the field label length: 32,000 (was 255).
❍ The number of fields that a single PivotTable can have: 16,000 (was 255).
❍ The number of array formulas that can refer to another worksheet: Limited only
by available memory (was 65,000).
❍ Limit to the number of rows that you can refer to in an array formula: None
(was 64,000).
❍ The number of categories allowed for custom functions: 255 (was 32).
❍ Excel now supports multicore processors and multithreaded chipsets.
● Better and easier tables Excel 2007 introduced a more robust table feature,
incor-porating PivotTable-like intelligence with easier formatting and editing. New features included the Table Styles gallery, structured referencing, the Remove Duplicates fea-ture, and more.
● Improved PivotTables and PivotCharts Excel 2007 added a few key
improve-ments to PivotTable filtering, design, and layout. The greatly improved appearance of the charting features enabled more compelling PivotCharts.
● Better database connectivity Along with better PivotTables, Excel 2007 provided
built-in access to SQL Server Analysis Services and included support for the Unified Dimensional Model (UDM), as well as for online analytical processing (OLAP) brows -ers and key performance indicators (KPIs).
● Formula AutoComplete Typing functions in formulas became a little easier in
Chap
ter
1
Tools for creating formulas In Excel 2007, the formula bar became manually resiz-able to let you display or hide lengthy formulas. This allowed you to enter longer formulas than before, with more levels of nesting (parenthetical expressions within expressions). The Name Manager dialog box provided greater organization and edit -ing possibilities. In addition, Excel 2007 included many small improvements in the way it works internally, including improvements in subtotals and regression formulas.
● Built-in Analysis Toolpak functions The trusty statistical functions of the
vener-able Analysis Toolpak were fully integrated into the program in 2007.
● Enhanced charting features Excel 2007 included lots of new chart types, updated
graphics, and a new set of Chart Tools contextual tabs, all of which made experimen-tation and modification a whole lot easier. Microsoft Office PowerPoint 2007 and Office Word 2007 started using the same charting engine as Excel.
● XLSX file format The Microsoft Office Open XML file formats (with the extension
.xlsx in Excel) provided better integration with external data sources and resulted in significantly smaller file sizes.
● Improved sorting and filtering The Sort command, which previously allowed only
three levels of sorting at a time, was improved to allow 64 levels in Excel 2007. The Filter feature was improved, and the Remove Duplicates button helped make man-aging database information easier, letting you specify in which columns to look for duplicate information.
● Enhanced security features Microsoft added a number of new features in Excel
2007, including the Trust Center and a digital signatures interface to help secure documents you share with others.
Moving onward with Office 2013
15
Exploring Excel fundamentals
B
efore you can get the feel of the controls, you need to know where they are andwhat they do. This chapter discusses the essential commands, controls, tools, and techniques you need to operate the Microsoft Excel 2013 machine.
Examining the Excel 2013 workspace
This section takes you on a tour of not only the dashboard of Excel 2010 but also the trunk and the glove compartment. We might even slip on some gloves and take a peek under the floor mats.
Facts about worksheets
Here are some tidbits of information about the grid called the worksheet, shown in Figure 2-1:
● Column letters range from A through XFD. (After column Z comes column AA, after
column ZZ comes column AAA, and so on, up to XFD.) Row numbers range from 1 through 1,048,576.
● The currently selected cell is referred to as the active cell. When you select a range of
cells, only the cell in the top-left corner is considered the active cell. The reference of the active cell appears in the Name box on the left end of the formula bar.
● The headings for the columns and rows containing selected cells are highlighted,
making it easier to identify the location of selected cells.
● With 16,000 columns and 1,048,576 rows, your worksheet contains more than 16
billion individual cells. Before you try to unravel the mysteries of the universe on a single worksheet, however, remember that the number of cells you can use at one time is limited by the amount of memory your computer has. Although Excel allo-cates memory only to cells containing data, you might have trouble actually using all the cells on one worksheet, no matter how much memory you have.
Examining the Excel 2013 workspace . . . .15
Exploring file-management fundamentals . . . .40
Importing and exporting files . . . .61
Using the Help system . . . .67
Chap
ter
[image:42.531.109.473.63.309.2]2
Figure 2-1 There is a huge amount of available space on a worksheet.
The porthole window
The workbook window is like a porthole through which you can see only a portion of a worksheet . To illustrate, suppose you were to cut a small, square hole in a piece of card-board and place the cardcard-board over this page . At any given time, you could see only a portion of the page through the hole . By moving the cardboard around the page, however, you could eventually read the entire page through the window in your piece of cardboard . Viewing worksheets in Excel is much the same . You can also open another window to view different sections of the same worksheet simultaneously .
Using the workbook window
Chap
ter
2
Select All box
Column headings Dialog box launcher Account Settings Title bar Status bar Ribbon Collapse Ribbon Formula bar Scroll box Scroll bar Scroll arrows Normal view Name box
Page Layout viewPage Break Preview Zoom controls New Sheet Sheet tab Row headings Tab scrolling buttons
Window Control menu Save
Undo Redo
Customize Quick Access Toolbar
Help
Ribbon Display Options Minimize
[image:43.531.125.478.72.385.2]Maximize Close
Figure 2-2 Workbooks initially comprise a single sheet, but you can add as many as you need.
For more information about using workbooks, see Chapter 7, “How to work a workbook .”
Workbooks are great organizational tools. For example, you can keep in the same work-book all the documents that relate to a specific project, department, or individual. Workbooks can eliminate a considerable amount of clutter on your hard disk. The more documents you have to manage, the more valuable workbooks become. You can use workbooks as a multiuser management tool. For example, you can organize worksheets in groups for individual tasks or individual users. You can also share a workbook so that more than one person can work on it at the same time.
If you routinely create folders on your hard disk to contain groups of related files, you can think of workbooks as folders where you can keep all related worksheets.
Chap
ter
2
Getting around in the workbook
At the bottom of the workbook window are controls you can use to move from sheet to sheet in a workbook. Just click any sheet tab to activate it, but if there are too many tabs to fit across your screen at once, sheet-navigation controls appear to help you get around, as shown in Figure 2-3. Note that the More Sheets (ellipsis …) buttons will not appear until there are too many sheets to display at once.
More Sheets Scroll Right Scroll Left
Tab split handle New Sheet More Sheets
Figure 2-3 Use the workbook navigational controls to move among undisplayed worksheets.
If you have a wheel mouse
If you have one, you can use the wheel on your Microsoft IntelliMouse (and most other wheeled pointing devices) to scroll through your worksheet . Turn the wheel toward you to scroll down or away from you to scroll up . To scroll left or right (called panning), press the wheel button, and drag the mouse in the direction you want to move . A gray four-headed arrow appears, anchored to the spot where you pressed the wheel but-ton . The speed of panning depends on how far you drag away from the anchor . As you press the button down and drag, a black arrow appears, pointing in the direction you’re dragging:
Chap
ter
2
Workbook navigation tips
Many features and controls can help you navigate through the rows, columns, and work-sheets in a workbook. Here are the highlights:
● Use the sheet tab navigation buttons to view all the sheet tabs in your workbook;
click a tab to view the contents of that worksheet.
● Drag the tab split handle to the right if you want to see more sheet tabs at the
expense of the horizontal scroll bar’s width. To return to the usual tab display, double-click the tab split handle.
● Press Ctrl+Page Down to activate the next worksheet in the workbook; press
Ctrl+Page Up to activate the previous worksheet.
● Press Ctrl+Home to jump to cell A1 from anywhere on a worksheet.
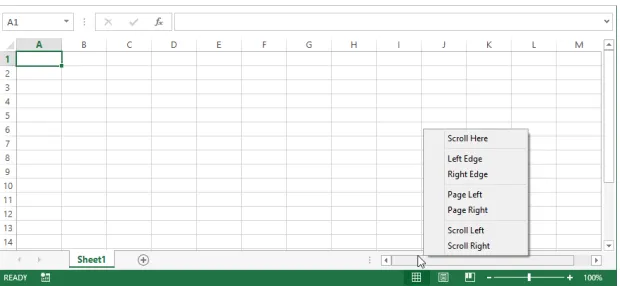
● Right-click any scroll bar to display a shortcut menu dedicated to scrolling actions, as
[image:45.531.145.455.292.435.2]shown in Figure 2-4.
Figure 2-4 Right-click a scroll bar to display a shortcut menu of navigational commands.
● Drag the scroll box (also known as the scroll thumb) to move around the worksheet.
Click the scroll bar anywhere outside the scroll box to move one screen at a time in the direction in which you clicked.
● The size of the scroll box changes depending on the size of the scrollable area. For
Chap
ter
2
proportionally smaller, giving you immediate feedback about the size of the work-sheet. A tiny scroll thumb indicates a huge workwork-sheet.
● Using the scroll arrows at either end of the scroll bars, you can move through the
worksheet one column or row at a time.
● The Name box at the left end of the formula bar always displays the active cell
refer-ence, regardless of where you scroll the window.
● To scroll the worksheet without changing the active cell, press Scroll Lock. For
exam-ple, to scroll to the right one full screen without moving the active cell, press Scroll Lock and then press Ctrl+Right Arrow.
Note
The active area of a worksheet is simply the rectangular area that encompasses all the data the worksheet contains . So, if you have just three rows and columns of actual data in the top-left corner of the worksheet, the active area would be A1:C3 . If, on the same worksheet, a stray character (even a space) happens to be in cell AB1299, the active area would be A1:AB1299 . On a new blank worksheet, however, Excel considers the default active area to be roughly what you can see on the screen, even before you enter any data .
Working with workbook windows
In Excel 2013, workbook windows behave differently than in any previous version. Previ-ously, there was one Excel window that contained all open worksheets, which appeared as separate windows within the Excel workspace. (Even the term “workspace” has been retired for 2013.) Each workbook appears as a separate instance of Excel in the 2013 version. If you have three workbooks open, there will be three windows, each with a complete Excel inter-face, including ribbon tabs, a formula bar, a status bar, and other such items.
Chap
ter
2
INSIDE OUT
See more rows on your screenYou can set the Windows taskbar at the bottom of the screen to automatically hide itself when not in use . Right-click the taskbar to display the shortcut menu, click the Properties command, and on the Taskbar tab of the Taskbar Properties dialog box select the Auto-Hide The Taskbar check box and then click OK . Now the taskbar stays hidden and opens only when you move the pointer to the bottom of the screen .
When you click the Minimize button (the one with a small line at the bottom), the window collapses and is relegated to an icon in the Windows taskbar, which you can click at any time to restore the window to its previous configuration. You can also drag the borders of any window to control its size.
Because you can open multiple windows for the same workbook, you might find it con -venient to view different parts of the workbook, or even different parts of an individual worksheet, side by side in separate windows, rather than switching between worksheets or scrolling back and forth in one large window.
For more information, see “Opening multiple