1
Title: Spatial reconstruction of Scottish summer temperatures from tree rings Short title: Spatial reconstruction of Scottish summer temperatures
Authors:
Miloš Rydval1,2, email: [email protected]; [email protected] tel. (00420)735872634
Björn E. Gunnarson3 Neil J. Loader4 Edward R. Cook5 Daniel L. Druckenbrod6 Rob Wilson1,5
1. School of Geography and Geosciences, University of St Andrews, UK
2. Faculty of Forestry and Wood Sciences, Czech University of Life Sciences Prague, Kamýcká 129, Praha 6–Suchdol, Prague, 16521, Czech Republic
3. Department of Physical Geography and Quaternary Geology, Stockholm University, Stockholm, Sweden
4. Department of Geography, Swansea University, Swansea, UK
2
Abstract: A detailed understanding of past temporal patterns and spatial expression of temperature variations is important to place recent anthropogenic climate change into a longer term context. In order to fill the current gap in our understanding of northwest European temperature variability, point-by-point principal component regression was used to reconstruct a spatial field of 0.5° temperature grids. A sequence of reconstructions utilizing several combinations of detrending and disturbance correction procedures, and a selection of tree-ring parameters (including ring-width (RW), maximum latewood density (MXD) and blue intensity (BI)) was used in an evaluation of reconstruction skill. The high resolution of the reconstructed field serves also as a diagnostic tool to spatially assess the temperature reconstruction potential of local chronologies. Best reconstruction results, reaching calibration r2 = 65.8% and verification r2 = 63.7% in central Scotland over the 1901-1976 period, were achieved using disturbance-corrected and signal free detrended RW chronologies merged with blue intensity data after low-pass (high-pass) filtering the RW (BI) chronologies. Calibration and verification r2 > 50% was attained for central, north and east Scotland, > 40% in west and northwest, and > 30% in southern Scotland with verification of nearly all grids showing some reconstruction skill. However, the full calibration potential of reconstructions outside central Scotland was reduced either due to residual disturbance trends undetected by the disturbance correction procedure or due to other climatic or non-climatic factors which may have adversely affected the strength of the climate signal.
3 Introduction
Anthropogenically induced climate change presents a monumental challenge for the international community (IPCC, 2014). To provide a context for recent climatic trends and their link to anthropogenic activity, it is essential to continue improving our understanding of ‘natural’ climatic variability and mean state changes in the past. Considering the temporal and spatial limitations of the available network of instrumental measurement stations, which provide direct records of past temperature variability, palaeoclimatic proxy archives in general, and in particular annually resolved and absolutely dated tree-ring records, represent a valuable resource for extending and improving our understanding of climatic behaviour in the past. Data from tree rings can additionally offer valuable information about climatic and environmental conditions in locations for which no instrumental records exist.
While large-scale hemispheric reconstructions of climatic variability have received considerable attention, the importance of moving the focus towards the development of finer scale, denser networks of regional reconstructions has been highlighted (e.g. Ahmed et al., 2013; Jones et al., 2009; Wilson and Luckman, 2003). By increasing the spatial resolution of reconstructions, a more accurate understanding of local and regional-scale climatic variability can be achieved if actual regional variations are captured.
4
(CCA - Barnett and Preisendorfer, 1987; Fritts, 1976) and orthogonal spatial regression (OSR - Briffa et al., 1986; Cook et al., 1994).
5
used to reconstruct temperature for China (Shi et al., 2012) and the broader East Asian region (Cook et al., 2013). A modified version of PPR has also been used to develop a 500 year multi-proxy temperature reconstruction for China (Yang et al., 2013). Utilisation of the PPR approach for the reconstruction of European climate has so far been limited and although Luterbacher et al. (2004) used OSR to perform a climate field reconstruction of European temperature, the work described in this study is the first instance of a PPR based spatial reconstruction of temperature in Europe.
6 Methods
2.1 Study area
Scotland experienced a protracted period of deforestation, reaching an all-time high in the first half of the 19th century followed by reforestation efforts in the 20th century and particularly after the Second World War (Mather, 2004). Total forest cover in Scotland likely reached a minimum of ~5% between the 17th and early 20th century (Mather, 2004; Smout et al., 2005), and increased to 17.8% by 2010 (Forestry Commission, 2011), though only ~1% of semi-natural forest cover remains in Scotland at present (Crone and Mills, 2002). The current forests mostly consist of residual semi-natural pine stands and represent the NW limit of the range of Scots pine in Eurasia (Kinloch et al., 1986).
7
more typical for the European continent. Wind is an important limiting factor which restricts the northern limit of pine in Scotland and also acts to lower the tree-line elevation (Körner, 1998; Moir, 2008) due to high wind stress in the west and northwest of the country (Quine and White, 1993).
NW Europe is particularly sensitive to the influences of synoptic scale atmospheric and oceanic phenomena and climatic modes of variability such as the North Atlantic Oscillation (NAO - Hurrell, 1995; Hurrell and van Loon, 1997), the Arctic Oscillation (Thompson and Wallace, 1998) and the Atlantic Multidecadal Oscillation (Schlesinger and Ramankutty, 1994). Climate in Scotland is strongly affected by weather patterns associated with the influence of North Atlantic climate. The NAO is a dominant pattern of atmospheric circulation in the North Atlantic and an important determinant of weather and climate in Scotland and other parts of Europe with the strongest influence in winter months. (Hurrell, et al., 2003; Hurrell and Deser, 2010). In Scotland, a positive phase of the NAO typically leads to increased precipitation, milder temperatures and increased wind-storm occurrence and severity, whereas a negative phase leads to more common incidence of seasonal temperature extremes (e.g. colder winter conditions) and reduced precipitation (Hurrell and Deser, 2010; Trigo et al., 2002). Tree-ring chronologies from Scotlandare ideally suited (due to their location and seasonal response) to reconstruct the summer counterpart of the NAO (SNAO), whose southern node is centred on Scotland (Folland et al., 2009; Linderholm et al., 2009).
2.2 Tree-ring network and chronologies
8
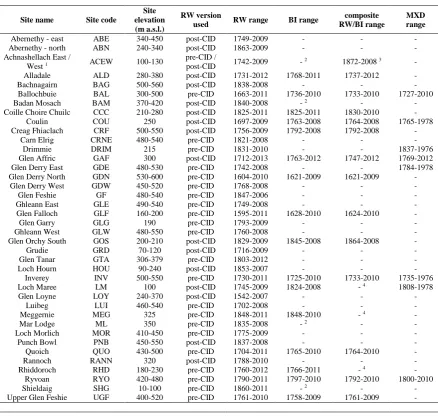
(see Table 1). Chronologies from 4 sites in the northwest Cairngorms were excluded from analysis and retained for the development of an independent temperature reconstruction extended with subfossil samples from the same area as part of a separate study (Rydval et al., in review). Additionally, 14 chronologies consisting of composite (combined high frequency (highpass) BI and low frequency (lowpass) RW data) from 14 of the sites were also used for the reconstruction of the temperature field. RW and MXD chronologies were supplemented with data from 7 sites previously used in the Hughes et al. (1984) Edinburgh summer temperature reconstruction, and which are available from the International Tree-Ring Data Bank (ITRDB, 2014).
2.3 RW chronology development
Measurement of samples was performed according to established dendrochronological practices (Stokes and Smiley, 1968) with either CooRecorder using scanned images (Larsson, 2014) or a Velmex traversing measuring stage (directly from sample) to a precision of 0.001 mm. CDendro (Larsson, 2014) and COFECHA (Holmes, 1983) were used to verify series crossdating. Ring-width chronologies were developed by detrending measurement series using negative exponential or linear functions (NX) in ARSTAN (Cook and Holmes, 1986) or NX with signal free standardisation (SF) (Melvin and Briffa, 2008).
9
chronologies which were attributed to a history of extensive woodland timber extraction over several centuries in Scotland. Since the presence of disturbance trends in RW chronologies can obscure decadal and longer term trends related to climatic variability, use of these ‘disturbance-corrected’ chronologies in temperature reconstructions is explored here.
The potential presence of disturbance trends (hypothesised to be primarily related to timber extraction and clearance) in some chronologies of the Scottish tree-ring network was assessed in Rydval et al. (2016) using the curve intervention detection (CID) method. This time-series-based intervention detection technique based on methods presented in Druckenbrod (2005) and Druckenbrod et al. (2013) objectively detects disturbance trends in individual RW series. As part of the disturbance detection procedure a constant of 1 mm is added to all series measurements to enable effective detection and correction without the loss of information. In the procedure individual series are power transformed (Cook and Peters, 1997) and detrended using negative exponential or linear function. For each series disturbance trends are identified as outliers from a distribution of running means (with window lengths from 9 to 30 years) based on a residual time series of AR model estimates and the detrended RW series (Druckenbrod et al., 2013). From this distribution, outliers are classified when a running mean value exceeds a scale of 3.29 from the bi-weight mean (Mosteller and Tukey, 1977) of the distribution. The disturbance trend is then removed by fitting a curve (Warren, 1980) to the RW series at the point where the disturbance-related growth release is identified. The procedure is performed iteratively for each series until no further outliers are identified.
10
disturbance. A detailed description of this method and its application to the Scottish RW chronologies used in this study is presented in Rydval et al. (2016). In that study, an assessment of whether the before correction (pre-CID) or after correction (post-CID) versions of SF chronologies should be utilised to reconstruct summer temperature was performed using correlation analysis to compare the RW chronologies with instrumental temperature data and a Scotland-wide MXD chronology composite. The selection of chronology versions to be used here for temperature reconstruction was based on that assessment and the results of this selection process are summarised in Table 1. A summary of pre- and post-CID chronologies, representing three regional groupings, and a comparison with instrumental temperature data is presented as supplementary Figure S1.
2.4 BI and MXD chronology development
The process for the development of BI chronologies and the set of procedures associated with it have evolved over time (i.e. sample treatment and measurement techniques have changed and developed). Wilson et al. (2012) noted that limitations in the low frequency component existed in some of the earlier generated Scottish BI chronologies because of inadequate resin extraction and this observation was supported by a more detailed examination of BI in Rydval et al. (2014). Consequently, the expression of low frequency trends in these data may be limited and express non-climatic trends related to colour differences between the heartwood and sapwood.
Although older MXD series data (Hughes et al., 1984) were obtained from the ITRDB tree-ring archive, the remaining (more recently developed) MXD and BI chronologies were developed following the procedures described in Rydval et al.
11
newer MXD data following standard sample preparation techniques (Schweingruber et al., 1978). A twin-bladed circular saw was used to cut 1.2 mm thick laths followed by 24 hour resin extraction treatment with ethanol in a Soxhlet apparatus. After air drying to 12% water content, the laths were X-rayed in the ITRAX system to produce 1270 dpi inverted grey scale images subsequently calibrated using a 1.274 g/cm3 cellulose acetate calibration wedge from Walesch Electronic (Schweingruber, 1988). The density data were measured from the images using WinDendro (Guay et al., 1992). For two sites (Ballochbuie and Glen Affric) for which both archived and newly developed MXD data exist, the older and newer subsets were combined as no significant differences were identified between the subsets.
For BI measurement, samples were immersed in acetone for a 72 hour period to extract resins and sanded after drying up to 1200 grit grade. The samples were scanned with a Canon CanoScan 9000F flatbed scanner along with SilverFast Ai (v.8.0.1.24) software. A Kodak IT8.7/2 calibration target was used with the SilverFast IT8 calibration procedure to calibrate the scanner and samples scanned with 2400 dpi resolution. A box with a non-reflective inner surface was used while scanning to avoid ambient light biases. BI was measured with CooRecorder software (Larsson, 2014) and BI series were then inverted. For the purposes of this study, detrending of MXD and BI series (after inversion) was performed by fitting negatively sloping (or zero slope) linear functions. Index calculation was carried out by subtraction in ARSTAN and stabilisation of chronology variance was performed (Osborn et al., 1997).
12
useable chronology span and due to the fact that the common regional signal is effectively increased as a result of the utilisation of PCR rather than utilising chronologies individually.
2.5 Composite highpass BI / lowpass RW chronology development
Previous research by Guiot (1985) demonstrated potential advantages of applying digital filtering techniques to perform a climate reconstruction by decomposing a predictor and predictand into separate frequency bands using mutually exclusive filters. This technique was further explored by Osborn and Briffa (2000) who investigated timescale-dependence in the context of temperature reconstruction development by performing regression separately on several frequency bands of decomposed predictor / predictand timeseries, noting that this can lead to improved estimation of past temperature. The approach of Guiot (1985) was also successfully applied by Guiot (2012) to perform a multi-proxy reconstruction of April to September European temperature. Herein, however, a variation on the approach applied in Briffa et al. (2013) is explored by combining separate frequency bands from chronologies of two parameters. This procedure was performed in an attempt to exploit some of the advantages of BI (i.e. stronger high frequency response to temperature than RW - Rydval et al., 2014) and RW chronologies (i.e. stronger expression of low frequency trends and not biased by colour changes in the wood) after undertaking non-climatic disturbance trend removal (Rydval et al., 2016).
13
program AnClim (Štěpánek, 2008). Although the optimal seasonal response of the two tree-ring parameters differed for some site chronologies, in such cases a compromise was reached to find a common climatic season in order to assess coherency at a range of frequencies between the tree-ring and instrumental temperature data of the respective 0.5° grid.For this purpose, coherence analysis was applied to predictor (BI / RW) and predictand (mean seasonal temperature) data to determine a common frequency cut-off. This cut-off was identified for each pair of site chronologies as the intersection of decreasing coherence between BI and instrumental data from higher to lower frequencies and decreasing coherence between RW and instrumental data from lower to higher frequencies (see figure S2 in Supplementary Information for an example). The RW (BI) chronologies were then lowpass (highpass) filtered using a Gaussian filter with the identified frequency cutoff. The 0.5° grid seasonal instrumental temperature series were also filtered to produce lowpass and highpass filtered versions using the same cutoff for the common season identified for each respective pair of RW / BI chronologies. The lowpass (highpass) filtered RW (BI) series were then scaled (same mean and standard deviation; Esper et al., 2005) to their corresponding lowpass (highpass) filtered seasonal temperature series and the lowpass RW and highpass BI components subsequently added together to form a single composite BI / RW chronology.
2.6 Reconstruction procedure
14
Jones and Lister (2004), which are composed of 5 instrumental records from mainland stations (Auchincruive/Paisley, Braemar, Eskdalemuir/Dumfries, Leuchars/Edinburgh and Wick - see inset map in Figure 1 for approximate record locations. Note that the Auchincruive, Eskdalemuir and Leuchars series were extended with the Paisley, Dumfries and Edinburgh series respectively - see Jones and Lister (2004) for details). Although some variability regarding the optimal season for the range of site and parameter chronologies was identified, overall, July-August (JA) was found to be the predominant consistent optimal season for BI, MXD and composite (highpass BI / lowpass RW) chronologies. A good response to JA temperatures was also evident in the RW data. The JA season was therefore selected as the compromise reconstruction target. This selection was also partly motivated as Hughes et al. (1984) reconstructed this season.
For the PPR procedure, an initial search radius of 35 km was used to identify chronologies within or in close proximity to each reconstructed grid. If within this search radius a suitable number of chronologies could not be found, the radius was expanded by an additional 50 km. By restricting the search radius in this way and including only proximal chronologies, a more spatially explicit spatial reconstruction can be achieved.
15
year of ring formation. In order to maximise the temporal extent of each grid-box reconstruction, a nested approach was performed. This procedure iteratively re-calculates the PCR as each shorter series is removed, producing an ensemble of multiple reconstructions for each grid-box, each based on decreasing numbers of predictor chronologies back in time (Cook et al., 2002). The different sections of reconstructions were scaled and spliced to the most recent (maximum predictor) reconstruction in order to correct for systematic changes in the variance structure which can occur due to changing (likely weakening) calibration strength related to the reducing number of predictors back in time.
2.7 Reconstruction calibration and verification
16
was omitted in this study in favour of utilising the more stringent CE metric. An additional 'early' independent verification period (1872-1900) was used to further assess reconstruction performance using the full (1901-2006) calibration period. For this early (1872-1900) independent period, all gridded July-August mean temperature series were extended by scaling the SMT data to each gridded temperature series according to their common period of overlap.
To allow the incorporation of 'older' MXD chronologies not updated since the late 1970s, while simultaneously also providing an even more stringent verification procedure, the 1901-1976 period was used for calibration and verification for the final reconstruction. For this set of reconstructions, 'forward' (1901-1938 cal. / 1939-1976 ver.) and 'reverse' (1939-1976 cal. / 1901-1938 ver.) split-period calibration and verification was performed followed by a final calibration over the full 1901-1976 period. In this case, two independent verification periods (late: 1977-2006 and early: 1872-1900) were used for an additional evaluation of reconstruction skill outside the full 1901-1976 calibration period.
Results
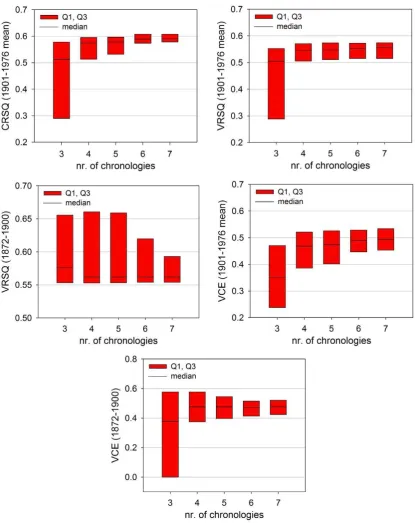
17
median when increasing the number of chronologies from three to four. There is also a decrease in the upper quartile as the number of chronologies increases to six and decreases further still with seven chronologies. Based on this ensemble of calibration and verification test results, a minimum of four chronologies was selected as a suitable limit to perform PPR. For all further PPR analysis, the search radius was therefore iteratively expanded until a minimum of 4 chronologies were identified and entered into the PCR procedure.
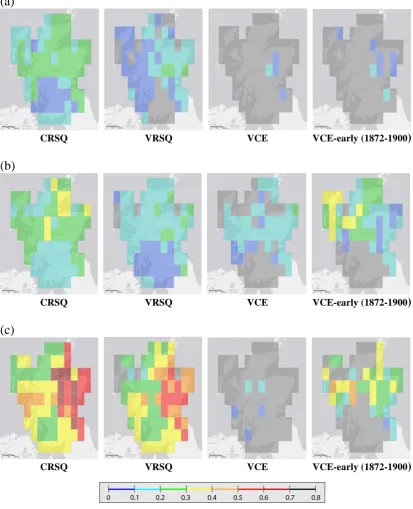
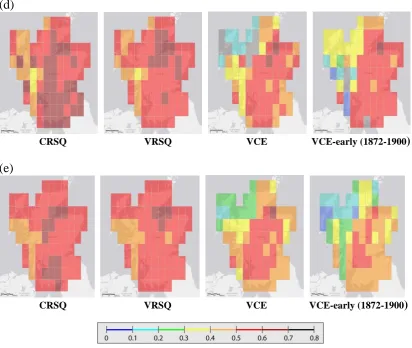
The spatial representation of a series of tests involving calibration and verification statistics (Figure 3), using various tree-ring parameters and standardisation techniques, indicates a sensitivity of results to the characteristics, treatment and type of the input data used. Specifically, the weakest results are obtained when only using RW chronologies with NX detrending and without CID correction, with the vast majority of grids portraying weak calibrated coherence and failing verification CE (VCE).
18
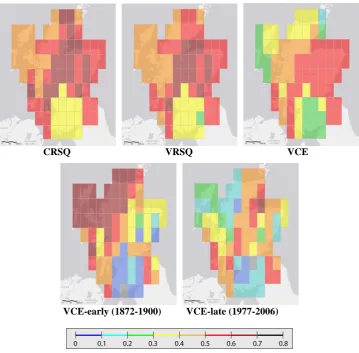
To allow the inclusion of additional MXD data used by Hughes et al. (1984), the analysis from Figure 3e was repeated with a shorter (1901-1976) calibration and verification period (Figure 4). The calibration and verification r2 and VCE are broadly similar to their Figure 3e counterparts, although notably somewhat weaker for southern and northwest Scotland. In contrast to the results of Figure 3e, early period VCE results appear stronger in the west and northwest and weaker in the east and south of Scotland. A pattern of weaker late independent period VCE is apparent in the northwest and also in southern Scotland.
19
instrumental temperature datasets, as well as the relative strengths and weaknesses of the tree-ring chronologies, can be gained. Despite some minor differences, these results broadly agree with the patterns identified in Figure 4.
Using the same input chronologies as in Figure 4, the early (1872-1900) and late (1977-2006) verification CE displayed in 50 year steps from 1850 back to 1650 express the decreasing spatial coverage and (generally) decreasing strength of the nested reconstructions as the number of chronologies in each nest declines in earlier time periods (Figure 5). While the VCE results for 1850 are largely comparable to those of the most recent nest in Figure 4, by 1800 a group of grids in the south do not pass late independent period VCE. For the reconstruction nests extending back to 1750, weakening of the verification results is apparent, with early independent verification period CE dropping to ≤ 0 in a set of grids in the east and northeast of Scotland. Most of the grid reconstructions in northern and northeast Scotland end between 1700 and 1750, although VCE results for most of the remaining grids do not show any considerable weakening and in fact some show improvement compared to the 1750 nests in certain areas (e.g. eastern Scotland).
20
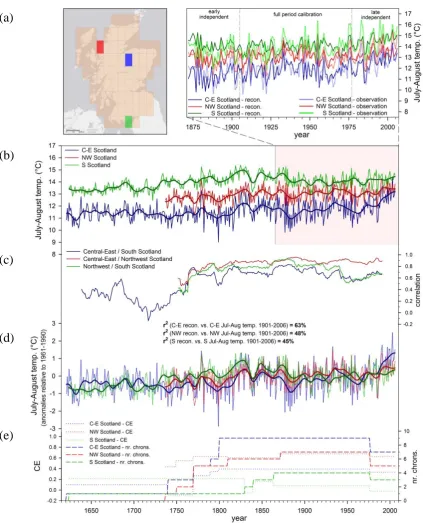
apparent. Temperatures are reconstructed as relatively higher from ~1730 until 1900 for the south in relation to reconstructions from the two regions farther north, which also exhibit greater overall similarity. Additionally, the late 19th century stands out as a relatively cooler period in the central-eastern Highlands. Although 1799 is reconstructed as the coldest year for the July-August season in the nearly 400 year reconstruction for central-eastern Scotland, this negative departure is less prominent in the northwest version and virtually absent in the southern reconstruction. Furthermore, some differences in trend are apparent, particularly in the southern grid reconstruction, around the mid-20th century and also in the early and mid-18th century. These differences may represent an expression of the weaker calibration / verification results of the southern grids (Figure 4 and 5).
21
agreement of the southern reconstruction in relation to the other two versions is evident in the second half of the 20th century. The correlation between the south and central-east reconstructions decreases markedly for much of the period prior to ~1760.
Discussion
Ensemble test results have been shown to enable an informed decision about selecting a suitable minimum number of input chronologies while also attempting to retain information about patterns of spatial variability which may otherwise be lost with the integration of information from chronologies over a larger area. The greatest gains are achieved when the minimum number of chronologies used increases from three to four. Increasing the number of chronologies beyond four may still result in some, though limited, improvement (Figure 2). One exception are the weaker VRSQ (1872-1900) results as the number of predictor chronologies increases. This may simply reflect the inclusion of chronologies, which happen to be weaker over this particular period, in a larger number of grid-box reconstructions. For the reconstruction of this particular temperature grid, the selection of four chronologies as the minimum number of predictors is, therefore, a reasonable compromise between preserving regional detail in spatial patterns of variability and developing statistically robust temperature reconstructions.
22
addition of BI chronologies helps to improve the strength of CRSQ and VRSQ (Figure 3c) due to the stronger high to intermediate frequency response of BI to temperature. However, BI chronologies alone (as traditionally developed) do not augment the results of the verification tests (i.e. VCE) due to the weaker expression of lower frequency trends related to heartwood / sapwood colour differences (Rydval et al., 2014). The combination of BI and RW data to form composite chronologies substantially improves both calibration and verification results (Figure 3d) beyond that achieved using each parameter separately by reducing some of the limitations of each parameter. In the absence of MXD data, this BI / RW composite still provides improved temperature reconstructions for most parts of Scotland, although the addition of MXD chronologies (Figure 3e) does improve verification of some grids in the northwest. Thus, the latter option is currently the most appropriate for reconstructing temperature with tree-ring data in Scotland.
23
the northwest reconstruction) to capture the late 20th century temperature increase as indicated by the linear residual trend.
Although some grid-box reconstructions represent an interpolation of chronology predictors located outside the grid-boxes, others (such as the example southern series in Figure 6) are essentially spatial extrapolations with respect to the location of sites used to reconstruct them (Figure 1). Although these extrapolated grid-box reconstructions express some skill, the absence of chronologies from peripheral locations could contribute to reduced calibration and verification strength for those areas.
24
marginal) areas of Scotland. However, because similar results to those achieved when using the CRU TS3.10 gridded temperature data (Figure 4) were obtained when using only SMT data for each grid (see Figure S3 in Supplementary Information), this again suggests that areas with weaker calibration and verification results likely reflect limitations of the tree-ring chronologies rather than any limitations of the actual instrumental data.
Calibration and verification is strongest around central Scotland and generally weaker in the northwest and particularly the south, which is expressed in Figure 6 by flatter late 20th century reconstructed temperatures for both areas in addition to a relatively warmer 19th century in the south. The weaker reconstructions (particularly in the south) could be attributed to some combination of three primary factors including; 1) differences in site elevation (and perhaps also latitude) (Table 1) that may affect the importance of temperature in limiting growth, 2) limitations of the CID procedure (which would arguably affect the West Highland chronologies more than sites in the Cairngorms as they generally experienced a greater degree of human related disturbance particularly around the Napoleonic Wars at the beginning of the 19th century – Rydval
25
results may partly be related to a potentially weaker temperature signal in lower elevation and / or more southern site chronologies (i.e. farther away from the treeline).
Likewise, differences in the variance of the reconstructions in Figure 6 could also be explained by differences in site elevation / latitude and perhaps related differences in chronology sensitivity to temperature since the southern reconstruction is the least variable (σ2(1901-2006) = 0.26) followed by the northwest reconstruction (σ2 (1901-2006) = 0.32) while in contrast the central-east reconstruction contains the most variance (σ2(1901-2006) = 0.71). This would presumably be due to variations in the ability (of stands at different sites) to capture temperature information. Although the variance of the gridded instrumental data (σ2(northwest) = 0.69; σ2(central-east) = 1.02; σ2(south) = 0.93 for 1901-2006) also differs and a lower amount of explained variance from the regression (Figure 6d) would also lead to a reduction in variance, the differences alone are not sufficient to explain these variations, particularly between the central-east and south reconstructions. However, these factors may largely account for the lower variance of the northwest reconstruction. Although previous research has suggested that differences in site elevation may not have a strong influence on growth response to temperature in Scotland (Grace and Norton, 1990), these conclusions were reached from only a small number of sites in the NW Cairngorms where calibration is strong. Although a detailed examination of such effects is beyond the scope of this study, the importance of such factors should, however, be investigated and re-evaluated in the future using a more extensive network of sites.
26
reconstructions. Although a general improvement was observed by using CID-corrected chronologies (Rydval et al., 2016), the method may not have accurately identified all disturbance events. More importantly, some disturbance trends may have remained because pre-correction chronologies were used for reconstruction (see Table 1) when post-correction versions showed no improvement. The Glen Falloch chronology, which is the longest of the southern sites, is one example where the pre-correction version was used. There is therefore a need to focus on updating and extending chronologies at other southern sites such as Glen Orchy and Coille Coire Chuilc, where additional suitable older stands exist (or which could be extended with historical material), in order to develop 'cleaner' reconstructions for this region.
While not specifically assessed as part of the work presented herein, the importance of additional factors such as high wind stress and high rates of precipitation leading to excessive soil moisture in parts of the Highlands should not be underestimated and may require additional examination in the future. The most practical approach for improving reconstructions in areas with currently weaker results or limited reconstruction length would involve the development of additional chronologies and increasing early period replication in chronologies containing relatively few older tree series. New sites from more marginal parts of the network could also be sampled (where living stands exist) or existing chronologies extended using subfossil or historical material where possible.
27
reconstruction. Substantial sub-fossil material has been sampled from Glen Affric which should enable a significant extension of this record. However, severe disturbance effects at this location, which may not have been completely removed using CID (Rydval et al., 2016), are still an issue which would need to be addressed in the future. Temporal extension of chronologies from both these regions may also be possible using samples from historical structures. A further effective option to improve the quality of reconstructions would involve re-processing existing samples to develop either new MXD chronologies or developing additional BI chronologies in order to increase the total number of sites for which composite BI / RW chronologies could be produced.
On the whole, the analysis presented herein highlights the importance of developing an awareness and appreciation of tree growth response within the interplay of often confounding climatic, ecological and anthropogenic factors in order to appropriately assess the suitability of tree-ring data for climate reconstruction. Such intricacies have often been overlooked by dendroclimatologists in the past.
Conclusion
28
Weaker calibration results in the northwest likely resulted from limitations in the currently available tree-ring data rather than the gridded temperatures. Limited improvement of some grid reconstructions can be partly attributed to imperfect disturbance detection in CID-corrected chronologies and the use of pre-correction RW chronologies in some instances. However, the CID approach generally improved temperature reconstruction results. Additional factors probably also contributed to weaker results in some areas and so the relationships between tree growth, climatic and non-climatic factors should be investigated further.
29 Acknowledgements
We wish to thank The Carnegie Trust for the Universities of Scotland for providing funding for Miloš Rydval's PhD. The Scottish pine network expansion has been an ongoing task since 2006 and funding must be acknowledged to the following projects: EU project ‘Millennium’ (017008-2), Leverhulme Trust project ‘RELiC: Reconstructing 8000 years of Environmental and Landscape change in the Cairngorms (F/00 268/BG)’ and the NERC project ‘SCOT2K: Reconstructing 2000 years of Scottish climate from tree rings (NE/K003097/1)’. We also thank Rider University for a faculty research fellowship that supported Daniel Druckenbrod, and Paul J. Krusic for compiling and making available a PC version of the point-by-point PCR software. Lamont-Doherty Earth Observatory contribution No. 8032.
Supporting Information
The following supporting information is available as part of the online article:
Figure S1: Pre- and post-CID chronologies for three Scottish regions and their comparison with the SMT July-August mean temperature series.
Figure S2: Coherency analysis of RW and BI chronologies from central Scotland with SMT July-August temperature data.
Figure S3: Calibration and verification results using the SMT mean July-August temperature series as the reconstruction target for all grids.
Figure S4: Spatial correlation plot of SMT July-August mean temperature series with 0.5° CRU TS3.10 mean temperature grid boxes.
30 References
Ahmed M, Anchukaitis KJ, Asrat A, Borgaonkar H, Braida M, Buckley BM, Büntgen U, Chase BM, Christie DA, Cook ER, Curran MAJ, Diaz HF, Esper J, Fan ZX, Gaire NP, Ge Q, Gergis J, González-Rouco JF, Goosse H, Grab SW, Graham N, Graham R, Grosjean M, Hanhijärvi ST, Kaufman DS, Kiefer T, Kimura K, Korhola AA, Krusic PJ, Lara A, Lézine AM, Ljungqvist FC, Lorrey AM, Luterbacher J, Masson-Delmotte V, McCarroll D, McConnell JR, McKay NP, Morales MS, Moy AD, Mulvaney R, Mundo IA, Nakatsuka T, Nash DJ, Neukom R, Nicholson SE, Oerter H, Palmer JG, Phipps SJ, Prieto MR, Rivera A, Sano M, Severi M, Shanahan TM, Shao X, Shi F, Sigl M, Smerdon JE, Solomina ON, Steig EJ, Stenni B, Thamban M, Trouet V, Turney CS, Umer M, Van Ommen T, Verschuren D, Viau AE, Villalba R, Vinther BM, von Gunten L, Wagner S, Wahl ER, Wanner H, Werner JP, White JW, Yasue K, Zorita E. 2013. Continental-scale temperature variability during the past two millennia.
Nature Geoscience6(5): 339-346.
Barnett TP, Preisendorfer R. 1987. Origins and levels of monthly and seasonal forecast skill for United States surface air temperatures determined by canonical correlation analysis. Monthly Weather Review115(9): 1825-1850.
Briffa KR, Jones PD, Pilcher JR, Hughes MK. 1988. Reconstructing summer temperatures in northern Fennoscandinavia back to AD 1700 using tree-ring data from Scots pine. Arctic and Alpine Research 20(4): 385-394.
31
Briffa, KR, Melvin TM, Osborn TJ, Hantemirov RM, Kirdyanov AV, Mazepa VS, Shiyatov SG, Esper J. 2013. Reassessing the evidence for tree-growth and inferred temperature change during the Common Era in Yamalia, northwest Siberia. Quaternary Science Reviews72(8): 83-107.
Cook ER, Anchukaitis KJ, Buckley BM, D'Arrigo RD, Jacoby GC, Wright WE. 2010. Asian monsoon failure and megadrought during the last millennium.
Science328(5977): 486-489.
Cook BI, Anchukaitis KJ, Touchan R, Meko DM, Cook ER. 2016. Spatiotemporal drought variability in the Mediterranean over the last 900 years. Journal of Geophysical Research: Atmospheres 121(5): 2060-2074.
Cook ER, Briffa KR, Jones PD. 1994. Spatial regression methods in dendroclimatology: a review and comparison of two techniques. International Journal of Climatology14(4): 379-402.
Cook ER, D'Arrigo RD, Mann ME. 2002. A well-verified, multiproxy reconstruction of the winter North Atlantic Oscillation Index since ad 1400*. Journal of Climate15(13): 1754-1764.
Cook ER, Esper J, D'Arrigo RD. 2004. Extra-tropical Northern Hemisphere land temperature variability over the past 1000 years. Quaternary Science Reviews23(20): 2063-2074.
Cook ER, Holmes RL. 1986. Users manual for program ARSTAN. In Tree-ring chronologies of western North America, Holmes RL, Adams RK, Fritts HC (eds). University of Arizona, Tucson, AZ; 50-65.
32
Cook ER, Meko DM, Stahle DW, Cleaveland MK. 1999. Drought reconstructions for the continental United States*. Journal of Climate12(4): 1145-1162.
Cook ER, Peters K. 1997. Calculating unbiased tree-ring indices for the study of climatic and environmental change. The Holocene 7(3): 361-370.
Cook ER, Seager R, Kushnir Y, Briffa KR, Buntgen U, Frank D, Krusic PJ, Tegel W, van der Schrier G, Andreu-Hayles L, Baillie M, Baittinger C, Bleicher N, Bonde N, Brown D, Carrer M, Cooper R, Čufar K, Dittmar C, Esper J, Griggs C, Gunnarson B, Günther B, Gutierrez E, Haneca K, Helama S, Herzig F, Heussner K-U, Hofmann J, Janda P, Kontic R, Köse N, Kyncl T, Levanič T, Linderholm H, Manning S, Melvin TM, Miles D, Neuwirth B, Nicolussi K, Nola P, Panayotov M, Popa I, Rothe A, Seftigen K, Seim A, Svarva H, Svoboda M, Thun T, Timonen M, Touchan R, Trotsiuk V, Trouet V, Walder F, Ważny T, Wilson R, Zang C. 2015. Old World megadroughts and pluvials during the Common Era. Science advances1(10). DOI: 10.1126/sciadv.1500561.
Crone A, Mills CM. 2002. Seeing the wood and the trees: dendrochronological studies in Scotland. Antiquity76(293): 788-794.
Dannenberg MP, Wise EK. 2013. Performance of climate field reconstruction methods over multiple seasons and climate variables. Journal of Geophysical Research: Atmospheres118(17): 9595-9610.
Dawson AGD. 2009. So Foul and Fair a Day: A History of Scotland's Weather and Climate. Birlinn: Edinburgh, 230 pp.
33
Druckenbrod DL, Pederson N, Rentch J, Cook ER. 2013. A comparison of times series approaches for dendroecological reconstructions of past canopy disturbance events. Forest Ecology and Management302: 23-33.
Esper J, Frank DC, Wilson RJ, Briffa, KR. 2005. Effect of scaling and regression on reconstructed temperature amplitude for the past millennium. Geophysical
Research Letters32(7): L07711. DOI: 10.1029/2004GL021236.
Fang K, Gou X, Chen F, Cook E, Li J, Buckley B, D'Arrigo R. 2011. Large-scale precipitation variability over northwest China inferred from tree rings. Journal of Climate24(13): 3457-3468.
Folland CK, Knight J, Linderholm HW, Fereday D, Ineson S, Hurrell JW. 2009. The summer North Atlantic Oscillation: past, present, and future. Journal of Climate 22(5): 1082-1103.
Forestry Commission. 2011. National Forest Inventory Woodland Area Statistics: Scotland. Forestry Commission: Edinburgh, 17 pp.
Fritts HC. 1976. Tree rings and climate. Academic Press: London, UK, 567 pp.
Gallardo C, Gil V, Hagel E, Tejeda C, de Castro M. 2013. Assessment of climate change in Europe from an ensemble of regional climate models by the use of Köppen–Trewartha classification. International Journal of Climatology 33(9): 2157-2166.
Grace J, Norton DA. 1990. Climate and growth of Pinus sylvestris at its upper altitudinal limit in Scotland: evidence from tree growth-rings. The Journal of Ecology78(3): 601-610.
34
Guiot J. 1985. The extrapolation of recent climatological series with spectral canonical regression. Journal of Climatology5(3): 325-335.
Guiot J. 2012. A robust spatial reconstruction of April to September temperature in Europe: Comparisons between the medieval period and the recent warming with a focus on extreme values. Global and Planetary Change84: 14-22.
Gunnarson BE, Josefsson T, Linderholm HW, Östlund L. 2012. Legacies of pre-industrial land use can bias modern tree-ring climate calibrations. Climate Research53(1): 63-76.
Harris I, Jones PD, Osborn TJ, Lister DH. 2014. Updated high-resolution grids of monthly climatic observations – the CRU TS3.10 Dataset. International Journal of Climatology34(3): 623-642.
Holmes RL. 1983. Computer-assisted quality control in tree-ring dating and measurement. Tree-Ring Bulletin 43: 69–75.
Hughes MK, Schweingruber FH, Cartwright D, Kelly PM. 1984. July-August temperature at Edinburgh between 1721 and 1975 from tree-ring density and width data. Nature308: 341-344.
Hurrell JW. 1995. Decadal trends in the North Atlantic Oscillation: regional temperatures and precipitation. Science269(5224): 676-679.
Hurrell JW, Deser C. 2010. North Atlantic climate variability: the role of the North Atlantic Oscillation. Journal of Marine Systems79(3): 231-244.
Hurrell JW, van Loon H. 1997. Decadal variations in climate associated with the North Atlantic Oscillation. Climatic Change36(3-4): 301-326.
35
Geophysical Monograph Series 134, American Geophysical Union: Washington D.C., 1-35.
IPCC – Pachauri RK, Meyer LA (eds). 2014. Climate Change 2014: Synthesis Report. Contribution of Working Groups I, II and III to the Fifth Assessment Report of
the Intergovernmental Panel on Climate Change. IPCC: Geneva, Switzerland, 151 pp.
ITRDB - International Tree-Ring Data Bank. 2014. National Climatic Data Center.
[Online].http://www.ncdc.noaa.gov/data-access/paleoclimatology-data/datasets/tree-ring. (accessed 20 October 2014).
Jones PD, Briffa KR, Osborn TJ, Lough JM, van Ommen TD, Vinther BM, Luterbacher J, Wahl ER, Zwiers FW, Mann ME, Schmidt GA, Ammann CM, Buckley BM, Cobb KM, Esper J, Goosse H, Graham N, Jansen E, Kiefer T, Kull C, Küttel M, Mosley-Thompson E, Overpeck JT, Riedwyl N, Schulz M, Tudhope AW, Villalba R, Wanner H, Wolff E, Xoplaki E. 2009. High-resolution palaeoclimatology of the last millennium: a review of current status and future prospects. The Holocene 19(1): 3-49.
Jones PD, Lister D. 2004. The development of monthly temperature series for Scotland and Northern Ireland. International Journal of Climatology24(5): 569-590. Josefsson T, Gunnarson B, Liedgren L, Bergman I, Östlund L. 2010. Historical human
influence on forest composition and structure in boreal Fennoscandia. Canadian Journal of Forest Research40(5): 872-884.
Kinloch BB, Westfall RD, Forrest GI. 1986. Caledonian Scots pine: origins and genetic structure. New Phytologist.104(4): 703-729.
36
Larsson L. 2014. CooRecorder and Cdendro programs of the CooRecorder / Cdendro package version 7.7. [Online]. Available at http://www.cybis.se/forfun/dendro. Accessed 3 January 2014).
Linderholm HW, Folland CK, Walther A. 2009. A multicentury perspective on the summer North Atlantic Oscillation (SNAO) and drought in the eastern Atlantic Region. Journal of Quaternary Science24(5): 415-425.
Luterbacher J, Dietrich D, Xoplaki E, Grosjean M, Wanner H. 2004. European seasonal and annual temperature variability, trends, and extremes since 1500. Science 303(5663): 1499-1503.
Mather AS. 2004. Forest transition theory and the reforesting of Scotland. Scot. Geographical Magazine 120(1-2): 83-98.
Melvin TM, Briffa KR. 2008. A "signal-free" approach to dendroclimatic standardisation. Dendrochronologia26(2): 71-86.
Met Office. 2015. UK Regional Climates [Online].
http://www.metoffice.gov.uk/climate/uk/regional-climates (accessed 10 April 2015).
Moir AK. 2008. The dendroclimatology of Modern and Neolithic Scots pine (Pinus sylvestris L.) in the peatlands of northern Scotland. Ph D. Thesis, Brunel University, London, UK.
Mosteller F, Tukey JW. 1977. Data Analysis and Regression. Addison-Wesley: Reading, MA, USA.
Osborn TJ, Briffa KR, Jones PD. 1997. Adjusting variance for sample size in tree-ring chronologies and other regional mean timeseries. Dendrochronologia15: 89-99. Osborn TJ, Briffa KR. 2000. Revisiting timescale-dependent reconstruction of climate
37
Quine CP, White IMS. 1993. Revised windiness scores for the windthrow hazard classification: The revised scoring method. Forestry Commission Research Information Note No. 230, Forestry Commission: Edinburgh, 6 pp.
Rydval M, Loader NJ, Gunnarson BE, Druckenbrod DL, Linderholm HW, Moreton SG, Wood CV, Wilson R. in review. Reconstructing 800 years of summer temperatures in Scotland. Submitted to Climate Dynamics.
Rydval M, Druckenbrod D, Anchukaitis KJ, Wilson R. 2016. Detection and removal of disturbance trends in tree-ring series for dendroclimatology. Canadian Journal of Forest Research46(3): 387-401.
Rydval M, Larsson LÅ, McGlynn L, Gunnarson BE, Loader NJ, Young GH, Wilson R. 2014. Blue Intensity for dendroclimatology: Should we have the blues? Experiments from Scotland. Dendrochronologia32(3): 191-204.
Schlesinger ME, Ramankutty N. 1994. An oscillation in the global climate system of period 65-70 years. Nature367(6465): 723-726.
Schneider T. 2001. Analysis of incomplete climate data: Estimation of mean values and covariance matrices and imputation of missing values. Journal of Climate14(5): 853-871.
Schweingruber FH. 1988. Tree Rings-Basics and Applications of Dendrochronology. Reidel, Dordrecht, Netherlands, 276 pp.
Schweingruber FH, Fritts HC, Bräker OU, Drew LG, Schär E. 1978. The X-ray technique as applied to dendroclimatology. Tree-Ring Bulletin 38: 61–91.
38
Shi F, Yang B, Von Gunten L. 2012. Preliminary multiproxy surface air temperature field reconstruction for China over the past millennium. Science China Earth Sciences55(12): 2058-2067.
Smout TC, MacDonald AR, Watson F. 2005. A history of the native woodlands of Scotland, 1500-1920. Edinburgh University Press: Edinburgh, 434 pp.
Štěpánek P. 2008. AnClim - Software for Time Series Analysis. Department of Geography, Faculty of Natural Sciences, Masaryk University: Brno, Czech Republic.
Steven HM, Carlisle A. 1959. The native pinewoods of Scotland. Oliver and Boyd: Edinburgh, 368 pp.
Stokes MA, Smiley TL. 1968. An introduction to tree-ring dating. University of Chicago Press: Chicago, IL, 95 pp.
Thompson DW, Wallace JM. 1998. The Arctic Oscillation signature in the wintertime geopotential height and temperature fields. Geophysical Research Letters 25(9): 1297-1300.
Touchan R, Anchukaitis KJ, Meko DM, Sabir M, Attalah S, Aloui A. 2011. Spatiotemporal drought variability in northwestern Africa over the last nine centuries. Climate Dynamics 37(1-2): 237-252.
Trigo RM, Osborn TJ, Corte-Real JM. 2002. The North Atlantic Oscillation influence on Europe: climate impacts and associated physical mechanisms. Climate Research20(1): 9-17.
39
Wilson R, Loader NJ, Rydval M, Patton H, Frith A, Mills CM, Crone A, Edwards C, Larsson L, Gunnarson BE. 2012. Reconstructing Holocene climate from tree rings: The potential for a long chronology from the Scottish Highlands. The Holocene 22(1): 3-11.
Wilson R, Luckman B. 2003. Dendroclimatic reconstruction of maximum summer temperatures from upper treeline sites in Interior British Columbia, Canada. The Holocene 13(6): 851-861.
Yang F, Wang N, Shi F, Ljungqvist FC, Wang S, Fan Z, Lu J. 2013. Multi-Proxy Temperature Reconstruction from the West Qinling Mountains, China, for the Past 500 Years. PLoS ONE8(2). DOI: 10.1371/journal.pone.0057638.
40
[image:40.595.156.444.68.641.2]
41
42
(a)
CRSQ VRSQ VCE VCE-early (1872-1900)
(b)
CRSQ VRSQ VCE VCE-early (1872-1900)
(c)
[image:42.595.85.499.91.601.2]
CRSQ VRSQ VCE VCE-early (1872-1900)
Figure 3: Mean of forward (cal. 1901-1953 / ver. 1954-2006) and reverse (cal. 1901-1953 / ver. 1954-2006) calibration (CRSQ), verification (VRSQ) r2 and verification CE (VCE),
43 Figure 3 (continued):
(d)
CRSQ VRSQ VCE VCE-early (1872-1900)
(e)
[image:43.595.86.499.112.460.2]
44
CRSQ VRSQ VCE
[image:44.595.117.477.69.422.2]
VCE-early (1872-1900) VCE-late (1977-2006)
Figure 4: Mean of forward (cal. 1901-1938 / ver. 1939-1976) and reverse (cal. 1939-1976 / ver. 1901-1938) calibration (CRSQ), verification (VRSQ) r2 and verification CE (VCE),
45
(a)
VCE-late 1850 VCE-late 1800 VCE-late 1750
VCE-late 1700 VCE-late 1650
(b)
VCE-early 1850 VCE-early 1800 VCE-early 1750
[image:45.595.120.456.72.690.2]
VCE-early 1700 VCE-early 1650
46
(a)
(b)
(c)
(d)
[image:46.595.86.510.76.600.2](e)
47 Site name Site code
Site elevation
(m a.s.l.)
RW version
used RW range BI range
composite RW/BI range
MXD range
Abernethy - east ABE 340-450 post-CID 1749-2009 - - - Abernethy - north ABN 240-340 post-CID 1863-2009 - - - Achnashellach East /
West 1 ACEW 100-130
pre-CID /
post-CID 1742-2009 -
2 1872-2008 3 -
Alladale ALD 280-380 post-CID 1731-2012 1768-2011 1737-2012 - Bachnagairn BAG 500-560 post-CID 1838-2008 - - - Ballochbuie BAL 300-500 pre-CID 1663-2011 1736-2010 1733-2010 1727-2010 Badan Mosach BAM 370-420 post-CID 1840-2008 - 2 - -
Coille Choire Chuilc CCC 210-280 post-CID 1825-2011 1825-2011 1830-2010 - Coulin COU 250 post-CID 1697-2009 1763-2008 1764-2008 1765-1978 Creag Fhiaclach CRF 500-550 post-CID 1756-2009 1792-2008 1792-2008 -
Carn Elrig CRNE 480-540 pre-CID 1821-2008 - - - Drimmie DRIM 215 pre-CID 1831-2010 - - 1837-1976 Glen Affric GAF 300 post-CID 1712-2013 1763-2012 1747-2012 1769-2012 Glen Derry East GDE 480-530 pre-CID 1742-2008 - - 1784-1978 Glen Derry North GDN 530-600 pre-CID 1604-2010 1621-2009 1621-2009 - Glen Derry West GDW 450-520 pre-CID 1768-2008 - - - Glen Feshie GF 480-540 pre-CID 1847-2006 - - - Ghleann East GLE 490-540 pre-CID 1749-2008 - - - Glen Falloch GLF 160-200 pre-CID 1595-2011 1628-2010 1624-2010 -
Glen Garry GLG 190 pre-CID 1793-2009 - - -
Ghleann West GLW 480-550 pre-CID 1760-2008 - - - Glen Orchy South GOS 200-210 post-CID 1829-2009 1845-2008 1864-2008 -
Grudie GRD 70-120 post-CID 1716-2009 - - -
Glen Tanar GTA 306-379 pre-CID 1803-2012 - - - Loch Hourn HOU 90-240 post-CID 1853-2007 - - -
Inverey INV 500-550 pre-CID 1730-2011 1725-2010 1733-2010 1735-1976 Loch Maree LM 100 post-CID 1745-2009 1824-2008 - 4 1808-1978
Glen Loyne LOY 240-370 post-CID 1542-2007 - - -
Luibeg LUI 460-540 pre-CID 1702-2008 - - -
Meggernie MEG 325 pre-CID 1848-2011 1848-2010 - 4 -
Mar Lodge ML 350 pre-CID 1835-2008 - 2 - -
Loch Morlich MOR 410-450 pre-CID 1775-2009 - - - Punch Bowl PNB 450-550 post-CID 1837-2008 - - - Quoich QUO 430-500 pre-CID 1704-2011 1765-2010 1764-2010 -
Rannoch RANN 320 post-CID 1788-2010 - - -
Rhiddoroch RHD 180-230 pre-CID 1760-2012 1766-2011 - 4 -
Ryvoan RYO 420-480 pre-CID 1790-2011 1797-2010 1792-2010 1800-2010 Shieldaig SHG 10-100 pre-CID 1860-2011 - 2 - -
Upper Glen Feshie UGF 400-520 pre-CID 1761-2010 1758-2009 1761-2009 - Table 1: Summary of site elevation, RW chronology versions (pre- or post-CID correction)
used for temperature reconstruction and RW, BI, composite RW/BI and MXD chronology range used for reconstruction after truncation - EPS ≥ 0.7 and minimum number of RW, BI series ≥ 8 and MXD series ≥ 5 (1 For this study both
Achnashellach sites were composited together to improve replication. 2 BI chronology
not used due to poor signal strength and / or insufficient chronology length. 3 Signal
strength sufficiently strong to include BI high frequency in composite RW/BI chronology. 4 Composite RW/BI chronology not developed due to poor coherence of
[image:47.595.79.518.97.516.2]48
(a)
(b)
[image:48.595.86.506.74.433.2](c)
49
[image:49.595.137.458.73.339.2]50
CRSQ VRSQ VCE
VCE-early (1872-1900) VCE-late (1977-2006)
Figure S3: Mean of forward (cal. 1901-1938 / ver. 1939-1976) and reverse (cal. 1939-1976 / ver. 1901-1938) calibration (CRSQ), verification (VRSQ) r2 and verification CE
[image:50.595.122.476.69.409.2]51
[image:51.595.168.425.71.292.2]52