ISSN Online: 2164-5175 ISSN Print: 2164-5167
DOI: 10.4236/ajibm.2019.94054 Apr. 8, 2019 809 American Journal of Industrial and Business Management
Production Efficiency Improvement by Using
Tecnomatix
Simulation Software and RPWM
Line Balancing Technique: A Case Study
Md. Sadekul Islam, Shipra Sarker, Mahmud Parvez
Department of Industrial Engineering and Management, Khulna University of Engineering & Technology, Khulna, Bangladesh
Abstract
One of the most used production systems is the assembly line balancing which is used to improve or balance different production line of different in-dustries all over the world. This paper is about improving the productivity of a particular sewing line of a Duffle Trolley (DFT) bag of VIP Industries Ban-gladesh Private Limited by balancing the line. By balancing the line product can be produced at a high production rate in the shortest time with an opti-mum productive way which is also cheap and demanded quality. This paper identifies the opportunities for improvement of current sewing line by per-forming RPWM (Ranked Positional Weight Method) line balancing tech-nique and testing feasibility using Tecnomatix simulation software. In this study, at first-time study of each operation was performed. For each process SMV (standard minute value), the existing line efficiency and production cycle time also labor productivity were calculated. Then using the precedence diagram and RPWM a balanced line layout was found and the line was tested by Tecnomatix software for validity. The final result obtained was an opti-mized and improved balance line layout for the sewing line. Finally, following this, the company will be able to produce the product at a high production rate through the minimum cost and meet the daily production target.
Keywords
Line Balancing Simulation Software, Production Line, SMV, Time Study, RPWM, Precedence Diagram
1. Introduction
Line balancing means the work element to be allocated equally in many work stations also to balance a line for better productivity. Assembly line balancing is
How to cite this paper: Islam, Md.S., Sarker, S. and Parvez, M. (2019) Produc-tion Efficiency Improvement by Using Tecnomatix Simulation Software and RPWM Line Balancing Technique: A Case Study. American Journal of Industrial and Business Management, 9, 809-820.
https://doi.org/10.4236/ajibm.2019.94054
Received: March 3, 2019 Accepted: April 5, 2019 Published: April 8, 2019
Copyright © 2019 by author(s) and Scientific Research Publishing Inc. This work is licensed under the Creative Commons Attribution International License (CC BY 4.0).
DOI: 10.4236/ajibm.2019.94054 810 American Journal of Industrial and Business Management now become the most challenging task in today’s industrial world for many in-dustrial engineers. The main problem which is faced while balancing an assem-bly line is to be able to assign a set of tasks or works to particular workstations so that precedence relationship is satisfied also desired performance is obtained [1]. The production line is usually balanced for obtaining a better-balanced layout which will not only increase line efficiency but also improve productivity. The balanced layout is necessary for any manufacturing company for measuring its utility through simulation software [2]. So, for achieving Just in Time (JIT) in manufacturing system it is essential to build a balanced line. Unequal workload in workstations of a sewing line or production line in an industry will not only increase Work-in-Process but also waiting time. Thus, both production cycle time and cost are increased. So, Industrial Engineers are now worried about ba-lancing the lines by appointing the workloads to workstations as equally as possible [3]. Our main focus is on balancing the line and layout modification. Manufacturing firms need to improve its overall efficiency to cope with the in-creasing demand of products to fulfill all demand across the world [4]. Er-lendsson, J. et al. (2006) have mentioned that Productivity means a relation be-tween outputs and inputs. It should be viewed as value adding in addition to op-timizing. Examples are innovation, cost, quality and delivery. Productivity anal-ysis is important for dealing for potential productivity improvement projects based on statistical data. Some core areas of delays are also involved in the anal-ysis. Many industries try to solving ALB problems using different logics, tech-niques. Bottlenecks, excessive and inefficient workers are the main causes which lead to low productivity. So, line balancing presents a significant way to reduce workers, idle time, reduce work in process, increase productivity etc. For achieving desired productivity production line must be designed readily and new layout needs to be implemented to obtain the line efficiency and productivity difference between new layout and current layout. For achieving this, the work-ers have to be multi-skilled and trained to do large variety of works. The needs of improving the current system lead to this study. So, main purposes of this study are to perform work study on the manual operators’ activities, to establish standard time for manual process, to determine the current operator’s utiliza-tion, to make recommendations to achieve efficient manpower planning, to test the feasibility of layout by computer simulation and to improve productivity and efficiency of existing layout by implementing new layout.
So, the main objectives of our research are 1) to establish a standard time for the manual process, 2) to increase working time and reduce idle time, 3) to in-crease line efficiency, and 4) to test the feasibility of layout by computer simula-tion. This paper is organized into 5 sections, Section-1 cover introduction, tion-2 literature review, Section-3 methodology, Section-4 case study, and Sec-tion-5 cover conclusion and all of these are described below.
2. Literature Review
DOI: 10.4236/ajibm.2019.94054 812 American Journal of Industrial and Business Management Algorithms also can be used for line balancing problem. Such algorithms are Neutral Networks, Ant Colony Optimization, and Genetic Algorithm (GA). But among these GA is best for solving [12]. This paper focuses on single model line balancing problem with real application in garment manufacturing industry. Naresh stated that, as sewing department involves manual labor, the process of-ten resulted in a high cycle time and low productivity. There are lots of different operations done manually and sewing operations needs high skill as well as quality work [13]. Since sewing process is related to manual labor, without ma-terial costs, the cost structure of the sewing process is also important. Tyler et al. (1991) have stated that sewing process is of critical importance and needs to be planned more carefully [14]. Each operator is needed to carry workloads prop-erly thus asynchronous flow is gained throughout the entire production line.
3. Methodology
The whole process of study work can be explained by the following flowchart:
In order to obtain the objectives and goal of the article, a methodology flow chart has been planned and designed. The main purpose to do the methodology flowchart is to be a guideline and direction to make sure the article run smoothly and successfully. In this paper for balancing the production line RPWM (Ranked Position Weight Method) is used. The research study area is sewing section of VIP Industries Bangladesh Private Limited and Production line no. 5 was se-lected. All relevant data was collected from this line. From the production line 2the collected data are total work element, the time required for each individual work element, the individual work element production rate, the target produc-tion rate, the total no of operator required to meet the demand. All these data are illustrated in Table 1. Then, balancing the line using Ranked Positional Weight Method (RPWM) of line balancing technique and makes a line layout according to this. After this, line efficiency, labor productivity, manpower re-quired, working time and idle time ware calculated. Finally, testing feasibility of this layout using Tecnomatix simulation software.
4. Case Study
DOI: 10.4236/ajibm.2019.94054 813 American Journal of Industrial and Business Management
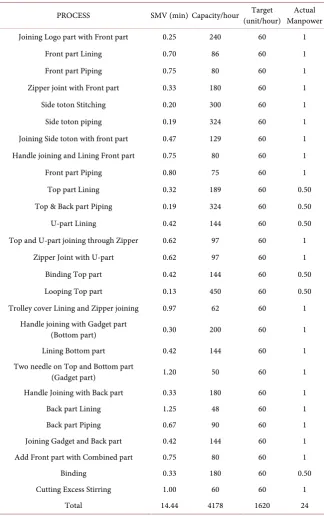
Table 1. Production data.
PROCESS SMV (min) Capacity/hour Target (unit/hour) Manpower Actual
Joining Logo part with Front part 0.25 240 60 1 Front part Lining 0.70 86 60 1 Front part Piping 0.75 80 60 1 Zipper joint with Front part 0.33 180 60 1 Side toton Stitching 0.20 300 60 1 Side toton piping 0.19 324 60 1 Joining Side toton with front part 0.47 129 60 1 Handle joining and Lining Front part 0.75 80 60 1 Front part Piping 0.80 75 60 1 Top part Lining 0.32 189 60 0.50 Top & Back part Piping 0.19 324 60 0.50 U-part Lining 0.42 144 60 0.50 Top and U-part joining through Zipper 0.62 97 60 1
Zipper Joint with U-part 0.62 97 60 1 Binding Top part 0.42 144 60 0.50 Looping Top part 0.13 450 60 0.50 Trolley cover Lining and Zipper joining 0.97 62 60 1
Handle joining with Gadget part
(Bottom part) 0.30 200 60 1 Lining Bottom part 0.42 144 60 1 Two needle on Top and Bottom part
(Gadget part) 1.20 50 60 1 Handle Joining with Back part 0.33 180 60 1 Back part Lining 1.25 48 60 1 Back part Piping 0.67 90 60 1 Joining Gadget and Back part 0.42 144 60 1 Add Front part with Combined part 0.75 80 60 1
Binding 0.33 180 60 0.50
Cutting Excess Stirring 1.00 60 60 1
Total 14.44 4178 1620 24
data. Table 1 Represent the production data. The line consists of 27 number of workstations. Also, man power whom was involved in line-5. Individual capacity of each process was also presented in this table for the same line. This whole data is of production line-5.
4.1. Production Line Balancing
DOI: 10.4236/ajibm.2019.94054 814 American Journal of Industrial and Business Management line. According to this method work element are assigned to different worksta-tions by their RPW value. Largest RPW value at of the list. Table 2 shows the RPW of each element and arranging the work element according to largest RPW value.
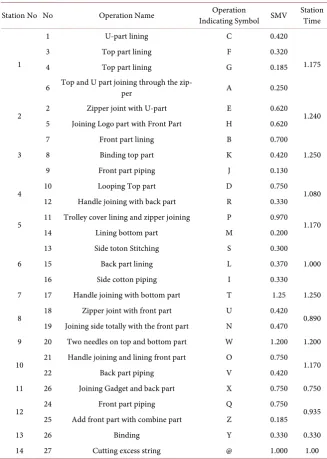
Table 3 shows the workstations that cluster according to RPWM technique of line balancing. The work element of production line 2 of VIP BAG Industries is clustered here. Table 3 is given bellow.
4.2. Simulation Model of Existing Line and Simulation Results
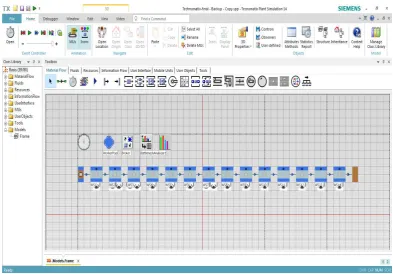
[image:6.595.199.537.269.733.2]A simulation model is developed using Tecnomatix simulation software accord-ing to the collected data. Figure 1 shows the simulation model before balancaccord-ing
Table 2. List of work element rank according to RPWM.
No Operation Name Indication Symbol S.M.V Operation Predecessors RPW Immediate
1 U-part lining C 0.420 ... 6.645 2 Zipper joint with U-part E 0.620 1 6.225 3 Top part lining F 0.320 ... 6.110
4 Top part lining G 0.185 3 5.79
5 Top and U part joining through the zipper A 0.620 ... 5.605 6 Joining Logo part with Front Part H 0.250 ... 5.510 7 Front part lining B 0.700 6 5.415 8 Binding top part K 0.420 5 4.985 9 Looping Top part D 0.130 8 4.565 10 Front part piping J 0.750 7 4.560 11 Trolley cover lining and zipper joining P 0.970 9 4.435 12 Handle joining with back part R 0.330 ... 4.265 13 Lining bottom part M 0.300 ... 4.185 14 Side toton Stitching S 0.200 ... 4.085 15 Back part lining L 1.250 12 3.935 16 Side toton piping I 0.370 14 3.885 17 Handle joining with bottom part T 0.420 13 3.885 18 Zipper joint with the front part U 0.330 10 3.810 19 Joining side toton with front part N 0.470 16, 18 3.635 20 Two needles on top and bottom part W 1.200 11, 17 3.465 21 Handle joining and lining front part O 0.750 9 3.015 22 Back part piping V 0.420 17 2.685 23 Joining Gadget and back part X 0.750 20,22 2.266 24 Front part piping Q 0.750 21 2.265 25 Add front part with combine part Z 0.185 23, 24 1.515
26 Binding Y 0.330 25 1.330
DOI: 10.4236/ajibm.2019.94054 815 American Journal of Industrial and Business Management
Table 3. Work element assign to station according to RPW.
Station No No Operation Name Indicating Symbol SMV Operation Station Time
1
1 U-part lining C 0.420
1.175
3 Top part lining F 0.320
4 Top part lining G 0.185
6 Top and U part joining through the zip-per A 0.250
2 2 Zipper joint with U-part E 0.620 1.240 5 Joining Logo part with Front Part H 0.620
3
7 Front part lining B 0.700 1.250 8 Binding top part K 0.420 9 Front part piping J 0.130
4 10 Looping Top part D 0.750 1.080 12 Handle joining with back part R 0.330
5 11 Trolley cover lining and zipper joining P 0.970 1.170 14 Lining bottom part M 0.200
6
13 Side toton Stitching S 0.300 1.000 15 Back part lining L 0.370 16 Side cotton piping I 0.330 7 17 Handle joining with bottom part T 1.25 1.250
8 18 Zipper joint with front part U 0.420 0.890 19 Joining side totally with the front part N 0.470 9 20 Two needles on top and bottom part W 1.200 1.200
10 21 Handle joining and lining front part O 0.750 1.170 22 Back part piping V 0.420 11 26 Joining Gadget and back part X 0.750 0.750
12 24 Front part piping Q 0.750 0.935 25 Add front part with combine part Z 0.185
13 26 Binding Y 0.330 0.330
14 27 Cutting excess string @ 1.000 1.00
the production line 2 of VIP BAG Industries. This line layout is developed from current layout from line-5. Figure 2 shows the balanced line layout of the pro-duction line.
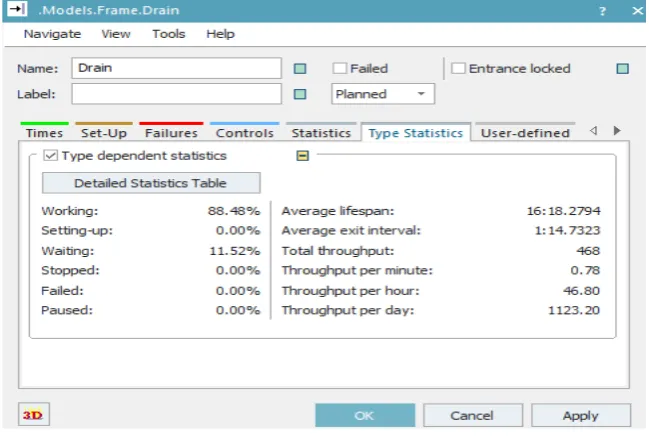
Current non-balanced data (through-put) are shown in Figure 3 by using tecnomatix simulation software. Figure 4 represent the through-put per day af-ter balancing the production line. These figures are given below.
4.3. Analysis and Comparison of Balanced and Non-Balanced
Production Line
DOI: 10.4236/ajibm.2019.94054 816 American Journal of Industrial and Business Management
Figure 1. Simulation model of the layout before balancing the line.
Figure 2. Simulation model of balanced line.
[image:8.595.145.539.374.648.2]DOI: 10.4236/ajibm.2019.94054 817 American Journal of Industrial and Business Management
[image:9.595.211.534.317.515.2]Figure 3. Throughput per day before balancing the line.
Figure 4. Result of the balanced simulation line.
[image:9.595.216.536.551.706.2]DOI: 10.4236/ajibm.2019.94054 818 American Journal of Industrial and Business Management
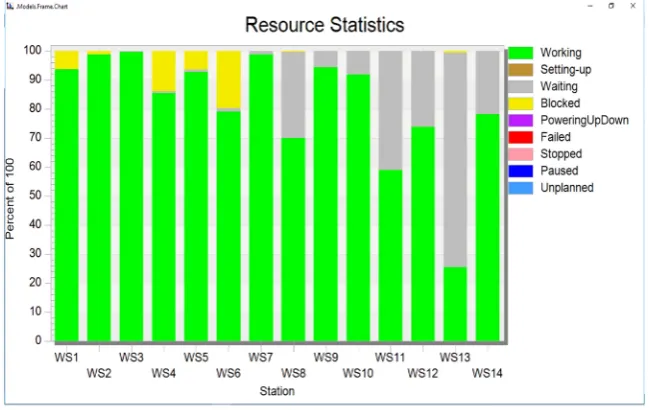
Figure 6. Percentage of time distribution in before balancing the line.
Figure 7. Percentage of time distribution of the balanced production line.
from 350 to 384 again after balancing the production line obtain from Tecnoma-tix simulation software.
5. Conclusion
DOI: 10.4236/ajibm.2019.94054 819 American Journal of Industrial and Business Management they recruit manpower more than they needed again they can’t meet the daily production target from this line. Finally, labor productivity, line efficiency, and working hour of the production line have increased significantly after balancing the assembly line which initially offered very low. The number of throughputs per day also increased and it meets the target quantity. The idle hour of the as-sembly line also reduced. Finally, the simulation model ensured that these results are feasible. This assembly line further optimized through time sharing and us-ing buffer inventory.
Conflicts of Interest
The authors declare no conflicts of interest regarding the publication of this pa-per.
References
[1] Ponnambalam, S.G., Aravindan, P. and Naidu, G.M. (2000) A Multi-Objective Ge-netic Algorithm for Solving Assembly Line Balancing Problem. TheInternational JournalofAdvancedManufacturingTechnology, 16, 341-352.
https://doi.org/10.1007/s001700050166
[2] Kitaw, D., Matebu, A. and Tadesse, S. (2010) Assembly Line Balancing Using Simu-lation Technique in a Garment Manufacturing Firm. ZedeJournal, 27, 69-80. [3] Jaganathan, V.P. (2014) Line Balancing Using Largest Candidate Rule Algorithm in
a Garment Industry: A Case Study. International Journal of Lean Thinking, 5, 25-35.
[4] Unuigbe, A.I., Unuigbe, H.A., Aigboje, E.O. and Ehizibue, P.A. (2016) Assembly Line Balancing Using Fuzzy Logic: A Case Study of a Tricycle Assembly Line. Open JournalofOptimization, 5, 59-70.https://doi.org/10.4236/ojop.2016.52008
[5] Bahadir, S.K. (2011) Assembly Line Balancing in Garment Production by Simula-tion. InTech, London.
[6] Kumar, N. and Mahto, D. (2013) Assembly Line Balancing: A Review of Develop-ments and Trends in Approach to Industrial Application. GlobalJournal of Re-searchinEngineering, 12, 29-50.
[7] Pearce, B. (2015) A Study on General Assembly Line Balancing Modeling Methods and Techniques.
[8] Groover, M.P. (2008) Automation, Production Systems, and Computer-Integrated Manufacturing. 3rd Edition,Pearson Education, New Delhi.
[9] Ramlan, R. and Tan, G.F. (2012) Cycle Time Reduction of a Garment Manufactur-ing Company UsManufactur-ing Simulation Technique.
[10] Rekiek, B. and Delchambre, A. (2006) Assembly Line Design: The Balancing of Mixed-Model Hybrid Assembly Lines with Genetic Algorithms. Springer Science & Business Media, Berlin.
[11] Van Hop, N. (2006) A Heuristic Solution for Fuzzy Mixed-Model Line Balancing Problem. EuropeanJournalofOperationalResearch, 168, 798-810.
https://doi.org/10.1016/j.ejor.2004.07.029
DOI: 10.4236/ajibm.2019.94054 820 American Journal of Industrial and Business Management
59, 335-349.https://doi.org/10.1007/s00170-011-3499-8
[13] Khanna, O.P. (1992) Industrial Engineering & Management. Revised Edition, Dhanpat Rai & Sons, New Delhi, 20-17.