The impact of partner spatial, social and network
differences on the joint R&D project performance:
an analysis of university-industry collaborations
Igors Skute
University of Twente P.O. Box 217, 7500AE Enschede
The Netherlands
[email protected]
ABSTRACT
The importance of University-Industry (U-I) collaborations is widely accepted among scholars and practitioners. Firms increasingly engage in the joint R&D partnerships with universities and research institutions to access the knowledge externalities generated by researchers, and leverage their research competencies. There is an on-going debate concerning the factors that determine the innovative and commercial performance of such research collaborations. The purpose of this paper is to investigate the impact of partner spatial, social and network characteristics on the product development and commercial performance of the joint research projects from the Dutch Technology Foundation STW. In order to test the identified hypotheses, 419 research projects and 798 unique partners were analysed. Findings indicate a statistically significant negative impact of larger spatial distances between the project applicant and other participants. The closeness centrality indicates an inverted U-shaped effect, and previous repeated collaborative ties have a statistically significant negative effect on the joint R&D project product development and commercial results.
Supervisors: Dr. A.M. (Ariane) von Raesfeld Meijer
Dr. K. (Kasia) Zalewska-Kurek
T. (Tamara) Oukes, PhD Researcher
Keywords
1.
INTRODUCTION
In the last decade firms compete in increasingly dynamic and inter-connected business environment which stimulates different types of collaborations between partners seeking to access new, innovative ideas and knowledge with a potential to develop new competitive advantage or launch a successful R&D project (Capaldo & Petruzzelli, 2014b; Wang & Chen, 2015). The latest technological breakthroughs, shifts in economic and political scenes in line with the urbanisation and natural resource consumption trends, have an inevitable impact on the future development of business alliances and innovation networks (‘PwC 5 global megatrends’, 2015; Lin, Wu, Chang, Wang, & Lee, 2012). In light of these factors, firms are challenged to develop alternative sources of knowledge production to improve their existing or compensate lacking innovation capabilities and stay on top of competition (Lin et al., 2012; Sampson, 2007). Joining a business network and engaging in multiple partnerships enables organisations to access complementary resources, benefit from economies of scale in R&D, reduce product development time and risks, and improve their bargaining power on the market (Aarikka-Stenroos, Sandberg, & Lehtimäki, 2014; Sampson, 2007). Additionally, by combining resources and technological knowledge with partners, business network participants can leverage their innovative capabilities and significantly improve technological and commercial performance (Cui & O'Connor, 2012; Mishra, Chandrasekaran, & MacCormack, 2015). In the knowledge intensive industries an important role is devoted to university – industry collaborations (D'Este, Guy, & Iammarino, 2012; von Raesfeld, Geurts, Jansen, Boshuizen, & Luttge, 2012). Universities are often considered as organisations possessing capabilities to conduct an in-depth analysis and advanced research and produce pivotal knowledge for many industries (Audretsch, Lehmann, & Warning, 2005; D'Este & Iammarino, 2010; Petruzzelli, 2011). Previous studies suggest that business networks can benefit from the knowledge spillovers from academic research, therefore enhancing results of the R&D efforts (Maietta, 2015; Ponds, Van Oort, & Frenken, 2010).
However, collaborative research partnerships within business and innovation networks are complex by nature and often the innovative and commercial performance of the R&D projects differ to a large extent (Capaldo & Petruzzelli, 2014b; D'Este & Iammarino, 2010). Explaining factors that determine success of such R&D partnerships still remains a key challenge for researchers showing controversial findings (Autant‐Bernard, Billand, Frachisse, & Massard, 2007; van Rijnsoever, van den Berg, Koch, & Hekkert, 2015; von Raesfeld, Geurts, Jansen, et al., 2012). From the perspective of economic geography the spatial proximity is a crucial factor that potentially affects the success of collaborative R&D projects (Beugelsdijk, McCann, & Mudambi, 2010; Boschma, 2005). Geographically concentrated location of actors favours inter-organisational communication, process coordination and sharing of information, especially non-codified and tacit (Ben Letaifa & Rabeau, 2013; Boschma, 2005; Schwartz, Peglow, Fritsch, & Günther, 2012). Nevertheless of some positive impact of geographical proximity, it does not predict the firm collaboration patterns and the results of R&D projects within business networks entirely. Thus, spatial proximity should not be analysed exclusively considering that other types of proximities have a similar or complementary impact (Boschma, 2005). From the perspective of network formation, the position an actor holds considering the linkages to other actors within the network is a notable determinant that potentially explains
the patterns of collaboration and R&D resource sharing between actors (Autant‐Bernard et al., 2007; Bala & Goyal, 2000). A more central position in the network of inter-firm ties enables an actor to access the latest R&D insights and provide with the capability to re-combine the knowledge resources of diverse partners. Further collaboration with previous partners also enhances the knowledge sharing as a result creating conditions for more successful innovation and product development than spatially and socially distant collaborations (Ahuja, 2000; Mazzola, Perrone, & Kamuriwo, 2015).
Although the impact of spatial distance and network configuration on the innovation performance has been widely acknowledged by researchers, the impact of these proximities on the joint product development and commercialisation of the university-industry R&D projects is explored in a relatively limited manner (Capaldo & Petruzzelli, 2014b; von Raesfeld, Geurts, Jansen, et al., 2012; Wang & Chen, 2015). Additionally, geographically concentrated partners with previous collaboration experience can optimise their working practices and project coordination, but also might hinder their innovation potential due to technological lock-in and limited resources to absorb new and diverse technological developments (Boschma, 2005; Sampson, 2007). Thus, additional research is necessary to evaluate the specific impact of partner proximities. The main purpose of this paper is to explore the impact of geographical distance between project actors and their previous collaboration experience and position within the business network on the innovative and commercial performance of the collaborative university-industry R&D projects. In more details, this paper is intended to address the following research questions:
RQ 1: What is the effect of spatial proximity on value creation performance of collaborative R&D projects? RQ 2: What is the effect of partner closeness centrality on value creation performance of collaborative R&D projects? RQ 3: What is the effect of social proximity on value creation performance of collaborative R&D projects?
The paper is structured as follows. In the next section, an extensive literature review will be conducted. The key concepts of business network and its composition will be explored. A special role is devoted to understanding the business alliances with university-industry research collaborations. Further, the impact of partner spatial and social proximity will be explored together with the concept of closeness centrality and the potential impact on innovation and commercial performance will be analysed, thus leading to the proposed hypotheses. Further, data methodology section will be introduced, elaborating on the study objects and applied research methods. Next, the results of study will be presented in addition to the descriptive statistics of the researched projects and their participants. Finally, the concluding section provides an in-depth discussion of the key findings that are targeted to minimise the gap in the research, the main implications for academics and practitioners, limitations of the research and avenues for future research.
2.
THEORY AND HYPOTHESES
2.1. University–Industry (U-I) Collaboration
Business network is characterised as a complex system of inter-connected nodes related to each other by specific threads (Håkansson & Ford, 2002). Types of nodes or network members might be institutions, individuals, research projects etc. The underlying assumption is that parties involved in the network composition share tangible and intangible investments that by means of inter-connection between the parties provide opportunities to multiply the effect of the investments (Håkansson, Ford, Gadde, Snehota, & Waluszewski, 2009). In the research on business networks and research alliances, an important role is devoted to university – industry (U-I) collaborations (D'Este et al., 2012; Perkmann & Schildt, 2015; Petruzzelli, 2011). Depending on the collaboration goals and partner composition, the interaction can have several modes, such as joint research aimed at collaborative work on R&D projects or contract research that refers mainly to firm-driven projects. Compared to joint research that is frequently publicly funded, contract research is primarily supported by the involved parties (D’este & Perkmann, 2011). Additional modes are information and knowledge dissemination through patenting and licensing, including access to lab and research facilities, human capital movement, and spin-off creation by academic institutions (D’Este & Patel, 2007; D’este & Perkmann, 2011; Schartinger, Schibany, & Gassler, 2001; von Raesfeld, Geurts, Jansen, et al., 2012).
It is recognised that U-I collaborations might be established to achieve a variety of purposes (Cunningham & Link, 2015; D'Este & Iammarino, 2010; Perkmann, Neely, & Walsh, 2011). For instance, Philips research centre in Eindhoven cooperates with more than 100 different universities and external partners to develop new technological innovations for three Philips market sectors of Healthcare, Lighting, and Consumer Lifestyle (‘Philips Research’, 2016). Shell collaborates with academic
partners across the globe to perform a joint research in oil and gas production technologies (‘Shell Research’, 2016). DSM
recently launched a joint research project on nutrient mapping with Medical Centre Groningen (‘DSM Research’, 2015).
Scholars previously explored a range of drivers and potential benefits that foster U-I collaborations across different disciplines (Audretsch et al., 2005; Ponds et al., 2010). In the literature, the key determinant of U-I collaborations is the degree of knowledge spillovers - intentional or unintentional sources of specific information that co-located partners might acquire within a certain network (local or non-local) (Audretsch et al., 2005; D'Este et al., 2012). Perkmann et al. (2011) developed a classification of drivers for firms launching partnerships with universities. First, firms can leverage their R&D funding, based on regional and national governmental science and technology development policies that support and encourage U-I collaborations by means of financing or other rewards. In line with this argument is the fact that universities also participate in economy and business developments on continuous basis following policy guidelines and entrepreneurial goals (D’este & Perkmann, 2011; von Raesfeld, Geurts, Jansen, et al., 2012). Second, academic organisations are recognised as sources of advanced scientific knowledge, therefore their partners are able to enhance their knowledge base and gain vital insights into emerging technological and scientific trends (Perkmann et al., 2011; Petruzzelli, 2011). Third, collaboration with academic organisations provides to their partners lacking R&D competencies and complex, multi-level problem solving skills by means of advisory and support during the entire research process. Fourth, U-I collaborations improve the partner firm research techniques and methods, provide access to specialised human capital, and broaden the business network. In a similar vein, academic organisations are
driven both by research-related and commercialisation reasons (Audretsch et al., 2005; D’este & Perkmann, 2011; Ponds et al., 2010). According to the findings by D’Este and Perkmann (2011), academics engage in collaborative R&D projects to apply their R&D results to industry and thus, enhance the quality of the research and learn new insights. However, patenting and spin-off creation predominantly is based on commercialisation purposes.
Nevertheless of variety of collaboration drivers, the U-I collaboration results differ to a large extent across different disciplines and alliances due to a list of challenges. The key implications are degree of absorptive capacity of partners and optimised knowledge and resource exchange (D'Este et al., 2012; Sampson, 2007). By engaging in joint research projects, partners re-combine diverse resources to explore new combinations with a potential to develop new products or acquire a new competitive advantage (Cui & O'Connor, 2012; Sampson, 2007). However, there is a risk that partners possess limited capacity to effectively absorb new knowledge and practices, therefore overly diverse partners might even hinder the innovation and collaboration processes (Balland, Boschma, & Frenken, 2014; Boschma, 2005; D'Este et al., 2012). Another common issue between U-I partnerships is a risk of goal misalignment. Universities share open-data principles and predominantly long-term vision, while firms tend to support commercial and internal information sharing approach, seeking for mid or short-term goals from joint projects (D'Este et al., 2012; Perkmann & Schildt, 2015). Additionally, scholars previously identified that U-I partnerships might suffer from technological lock-in situations when partners are not able to find new innovative and technological solutions due to the limited competencies to generate new resource combinations or limited capability to assimilate new technologies within an organisation. Power asymmetry based on asymmetric knowledge or position within the business network can influence partner information and resource exchange, dependency and collaboration (Boschma, 2005; von Raesfeld, Geurts, Jansen, et al., 2012). Hence, it is crucial to seek for a right balance between partner technological and organisational diversity and optimise the complementary factors to enhance the collaboration and joint research processes. To achieve optimised collaboration process, partners need to ensure effective resource sharing, communication and project coordination. This, in turn, requires a development of common knowledge base and sufficient level of trust (Boschma, 2005; Lin, Wu, Chang, Wang, & Lee, 2012). There is an on-going debate concerning several types of proximities that foster U-I collaborations and enhance the collaborative project results (Beugelsdijk et al., 2010; Boschma, 2005; Wang & Rajagopalan, 2015). This paper is intended to further investigate the impact of partner proximity and contribute to the existing knowledge base with new empirical evidence within a field of joint R&D project performance.
2.2. The Impact of Geographical Proximity
on
the
Collaborative
R&D
Project
Performance
Petruzzelli, 2014a; Maietta, 2015). Boschma (2005) identified the following five types of proximity dimensions: cognitive, organisational, social, institutional and geographical. Proximity between the actors tends to impact several inter-firm collaboration decisions, ranging from new venture or spin-off creation close to dense business networks or advanced knowledge organisations; partnering decisions; communication frequency and communication channels; degree of knowledge and resource sharing; IP rights distribution; and finally joint product development and innovation plans (Balland et al., 2014; Boschma, 2005; Capaldo & Petruzzelli, 2014b; Cui & O'Connor, 2012). Thus, proximity has a notable impact on the inter-firm collaboration performance. There is a high ambiguity among scholars concerning the impact of partner proximity in collaborative R&D projects. The necessary degree of proximity for successful joint research project execution and project result enhancement remains under continuous debate (Autant‐Bernard et al., 2007; Boschma, 2005; Petruzzelli, 2011; van Rijnsoever et al., 2015). Existing research emphasises the importance of geographical and social dimensions as empirically confirmed factors influencing the joint research project innovation potential (Aarikka-Stenroos, Sandberg, & Lehtimäki, 2014; Audretsch et al., 2005; Capaldo & Petruzzelli, 2014b; Maietta, 2015; Pulles & Schiele, 2013).
Geographical (also spatial) proximity is defined as the spatial or physical distance between economic partners, both in absolute and relative meaning (Boschma, 2005). From the perspective of economic geography and business network development, geographical proximity is considered as a vital driver of inter-firm interactions. Inevitably, geographically more closely located actors are exposed to more frequent encounters and interdependencies with actors located within the same region, compared to more distant ones (D'Este et al., 2012). This, in turn, promotes cluster development within a particular geographic region (Ben Letaifa & Rabeau, 2013; Schiele, 2008). Cluster refers to geographic concentrations of interrelated companies and institutions in a certain sector that facilitate entrepreneurship and innovation, especially in knowledge-intensive industries (Ben Letaifa & Rabeau, 2013; Casanueva, Castro, & Galán, 2013; Longhi, 1999; Porter, 1998). Spatially closer distance between actors facilitates face-to-face communication, both formal and informal (Capaldo & Petruzzelli, 2014b; Schwartz et al., 2012). Such geographically bounded interactions lead to a development of spatial ecosystem with inter-connected linkages between the actors with specific commonalities and complementarities (Ben Letaifa & Rabeau, 2013; Porter, 1998). Being a part of such business cluster, organisations experience an increase of trust and understanding of shared business environment that acts as a catalyst for future interactions. This bolsters intensive information and knowledge exchange, interactive learning and partnership development (Capaldo & Petruzzelli, 2014b; Petruzzelli, 2011; Schwartz et al., 2012). The knowledge externalities being generated within the cluster provide the network participants with new capabilities to recombine their R&D resources and leverage the innovation potential, that being successfully exploited could lead to better commercial results (Capaldo & Petruzzelli, 2014b; D'Este et al., 2012; Petruzzelli, 2011). Previous studies show that linkages within a cluster enable actors to access new knowledge and the necessary resources at lower costs, thus positively contributing to the overall partnership performance (Audretsch et al., 2005; Steinle & Schiele, 2002).
However, the impact of spatial proximity should not be considered straightforward. The effect of geographical distance between the actors on the partner collaboration results could be
mediated by the several inter-related factors, such as the implemented communication channels, type of knowledge exchanged or type of industry (Audretsch et al., 2005; D’este & Perkmann, 2011; Maietta, 2015; Ponds et al., 2010). The recent technological advancements in IT and Web 2.0 in particular help to overcome the geographical barriers by increased capabilities to access distant partners all around the globe and exchange vast amount of knowledge and information, including a direct access to databases and its moderation digitally (Ben Letaifa & Rabeau, 2013; Conway & Steward, 2009). The effectiveness of spatial proximity in knowledge exchange processes also depends from a degree of information codification. Codified information could be transmitted without any major restrictions and at a low cost. More tacit information sharing and its accumulation are enhanced by closer geo-distances between the actors due to the similar institutional and cultural environments, in addition to established business routines and practices within a cluster (Boschma, 2005; Cowan, David, & Foray, 2000; Maietta, 2015). In the university-industry (U-I) interactions, the effect of spatial proximity is influenced not only by regional, but also by partnering firm and university characteristics (Audretsch et al., 2005; D’Este & Patel, 2007; D’este & Perkmann, 2011). Previous research indicates that in high-tech, knowledge-intensive industries, U-I collaboration can be established due to sufficient level of common knowledge base and absorptive capacity (Laursen, Reichstein, & Salter, 2011; Lin et al., 2012). Distant collaborations are formed to access the cutting-edge research and technologies where spatial proximity is mediated by cognitive and organisational proximities, i.e. similar and complementary bodies of knowledge and organisational inter-dependencies that enable to understand, process and exchange new knowledge (Boschma, 2005; Nooteboom, Van Haverbeke, Duysters, Gilsing, & Van den Oord, 2007). Yet, large spatial distance implications are twofold. Interacting with distant partners might provide an access to new information, latest research insights, and product development resources. Thus, increasing partner innovation potential and helping to avoid spatial lock-in – a situation when partner innovative competencies are limited to the local cluster (Boschma, 2005; Schiele, 2008). On the other hand, large spatial distance hinders a trust-based collaboration development and reduces the potential for repeated interaction (Capaldo & Petruzzelli, 2014a; Sampson, 2007). This, in turn, can stimulate more opportunistic behaviour by partners and limit a development of collaborative practices. Partners being involved in such networking conditions tend to decrease the extent of research and information exchange, leading to lower product development and commercial results, compared to collaboration within a cluster (Ben Letaifa & Rabeau, 2013; Boschma, 2005; Capaldo & Petruzzelli, 2014a; Perkmann et al., 2011).
when interactions between the actors are simultaneously co-operative and competitive (Crevoisier, 2004; Steinle & Schiele, 2002). Thereby, based on these findings, it is possible to develop the following hypotheses:
H1: Geographical distance between R&D project partners has a negative impact on the joint R&D project product development performance.
H2: Geographical distance between R&D project partners has a negative impact on the joint R&D project commercial performance.
2.3. The Impact of Social Proximity on the
Joint R&D Project Performance – Partner
Closeness
and
Previous
Collaboration
Experience
2.3.1. The Interplay of Social Proximity and
Structured Network Embeddedness on the R&D
project performance
Spatial proximity has a critical role in facilitating interactions between geographically co-located actors. A degree of spatial proximity determines a level of regional or national clustering, affecting a development of inter-firm linkages and knowledge flows (Ben Letaifa & Rabeau, 2013; Boschma, 2005). Clusters and business networks on regional or national level could be seen as socio-technical systems with embedded relationships and a history of mutual adaptation by their actors (Steinle & Schiele, 2008). Such networked systems possess not only spatial, but also technical and social impediments to integrate within the established system (Capaldo & Petruzzelli, 2014a; Steinle & Schiele, 2008). Although the importance of spatial proximity cannot be neglected, some firms fail to enter a cluster or a business network while being co-located geographically, but missing the sufficient level of social and tech-cognitive proximities (Autant‐Bernard et al., 2007; Maietta, 2015). Social proximity refers to socially embedded relations between actors involving trust based on friendship, kinship and experience (Balland, 2012; Boschma, 2005). A degree of social proximity a particular actor holds within a network might influence a range of business outcomes and interaction effectiveness, it might affect a business outcome on a solely basis and it could be a complementary or facilitating factor to other types of proximities (Balland et al., 2014; Ben Letaifa & Rabeau, 2013).
In increasingly dynamic and competitive market environment, business networks are the sources of new knowledge and resources that enable firms to make novel combinations leading to new innovative products and solutions (Aarikka-Stenroos & Jaakkola, 2012; Salavisa, Sousa, & Fontes, 2012). Structural network embeddedness describes the configuration of existing linkages between the network actors, outlining the structure of existing ties, closeness, centrality and hierarchy (Mazzola et al., 2015; Nahapiet & Ghoshal, 1998; van Rijnsoever et al., 2015). Mazzola et al. (2015) provide an extensive overview of studies on this subject. The underlying assumption is that firms can benefit possessing a central position within a network by having superior capabilities to collect and recombine resources and information (Caner, Sun, & Prescott, 2014; Gilsing, Nooteboom, Vanhaverbeke, Duysters, & van den Oord, 2008; Wang & Chen, 2015). In this paper the central focus is on the closeness centrality between the joint research project partners. Closeness centrality refers to lengths of paths between the actors within the network (Borgatti, 2005; Okamoto, Chen, &
Li, 2008). Those actors positioned closer to other key actors or being in positions that are more reachable by others exercise favoured positions (Brandes, 2001; Freeman, 1978). Possessing higher closeness centrality enables an actor to access a high degree of novel information and knowledge that is generated and intentionally or unintentionally shared within the network (Baum, Calabrese, & Silverman, 2000; Gilsing, Nooteboom, Vanhaverbeke, Duysters, & van den Oord, 2008; Mazzola et al., 2015). It also improves the capability to access other types of resources, including specialised human capital, facilities and new business connections (Ragatz, Handfield, & Petersen, 2002; Schwartz et al., 2012; Vanhaverbeke, Belderbos, Duysters, & Beerkens, 2014). High closeness centrality provides a privilege to maintain shorter paths to other actors and maintain shorter links to other central actors within the network (Borgatti, 2005; Okamoto et al., 2008). In turn, a well-managed closeness centrality optimises an actor’s network of ties by means of reducing the number of redundant connections and network maintenance costs (Ahuja, 2000; Borgatti, 2005; Mazzola et al., 2015). Having a short access to a vast amount of novel information, an actor with high closeness centrality can monitor the latest developments within the network; get updates on the latest successes or failures without the need to engage in new partnerships, therefore avoiding the potential collaboration failures and increased costs associated with additional partnerships or information searches (Baum et al., 2000; Gilsing et al., 2008; Vanhaverbeke et al., 2014). Additionally, higher closeness centrality enables an actor to maintain a network of potential partners who possess specialised knowledge with lower costs. Thus, higher closeness centrality stimulates a development of innovation capability in an efficient manner (Gilsing et al, 2008, Lin et al., 2008; Baum et al., 2000; Mazzola et al., 2015). From the perspective of the joint research collaborations, a partner with high closeness centrality could be a valuable source of information and resource leverage shared between the project partners.
However, within a scope of a business network, after a certain threshold of similar closeness centrality profiles, the joint collaboration performance could lead to a detrimental effect (Boschma, 2005; Gilsing et al., 2008). Too high similarity of closeness centrality scores between the joint R&D project participants could lead to a limited potential to enrich the shared knowledge base and generate new information and resource combinations. Within a social network, actors with similar centrality profiles are exposed also to similar degree of information absorption and development of their individual ties, resulting in occasional overlaps. In order to generate new innovative ideas, new tangible and intangible resources would be necessary (Gilsing et al., 2008; Lin et al., 2012; Mazzola et al., 2015). However, additional searches could lead to major constraints due to path dependencies and increasing costs of acquiring new sources of information, while receiving lower returns (Gilsing et al., 2008; Cui & O'Connor, 2012; Sampson, 2005). Additionally, after developing shared working practices and a certain level of social proximity, participants of a specific R&D project develop trust-based, routine relationships. Such relationships occasionally reduce the new connection development outside the partnership network, therefore minimising the inflow of new ideas, which results in inward-looking product development approach. In such conditions, the collaborative innovative performance would be limited to the joint innovation potential (Boschma, 2005; Balland, 2012; Baum et al., 2000). Therefore, a balanced project partner composition is expected to generate more unique combinations of information and resources, hence improving the results of product development and commercial success respectively. Based on these findings, the following hypotheses are developed:
H3: The closeness centrality distance between R&D project partners has an inverted U-shaped effect on the joint R&D research project product development performance H4: The closeness centrality distance between R&D project partners has an inverted U-shaped effect on the joint R&D research project commercial performance
2.3.2. The Impact of Repeated Collaboration on
the R&D Project Performance
Inevitably, in the joint R&D projects with multiple partners a certain level of social proximity is necessary to establish efficient knowledge and information exchange. Social proximity might reduce the risk of partner opportunism, and in some cases, the product technological characteristics are too complex, and these are adapted to the local environment, which requires social proximity to assimilate the product specifics (Steinle & Schiele, 2002, 2008). Social proximity plays a pivotal role also for U-I partnerships. Often the research results generated in the universities are complex, and knowledge-intensive, therefore common knowledge base and absorptive capacity might be necessary, even to absorb specialised, codified knowledge (Audretsch et al., 2005; D'Este et al., 2012). The key mechanism to raise the social proximity within a group of project partners is to attract participants with existing collaboration experience (Cui & O'Connor, 2012; Mazzola et al., 2015; Petruzzelli, 2011).
The existing previous collaboration experience is expected to generate positive impact on the collaborative R&D project performance (Petruzzelli, 2011; Schwartz et al., 2012). Previous collaboration experience raises the social proximity, and therefore enhances the trust between partnering actors that
develops over a longer period of time (Cui & O'Connor, 2012). Organisations engaging in repeating partnerships possess shared mutual understanding, share similar knowledge base and are aware of partner’ expectations and applied business practices (Boschma, 2005). Such knowledge stimulates a development of business routines and helps to minimise the transaction and coordination costs (Barajas & Huergo, 2010). Existing research shows that previous collaboration ties could be particularly beneficial for complex management tasks and assignments due to developed knowledge and experience of working in ambiguous situations previously (Cui & O'Connor, 2012; Sampson, 2005). Based on these findings, the following hypotheses are developed:
H5: The existing repeated collaboration ties between R&D project partners have a positive impact on the joint R&D project product development performance
H6: The existing repeated collaboration ties between R&D project partners have a positive impact on the joint R&D project commercial performance.
3.
DATA METHODOLOGY
3.1. Subjects of study
In order to test the identified hypotheses, collaborative technology research projects, funded by the Dutch Technology Foundation STW, are analysed. The technology research project members are Dutch universities and their spin-offs, selected scientific research institutes and selected tech companies and their spin-offs, including Philips, DSM, TNO etc. STW possesses about 55 million euros budget which is generated from the Netherlands Organisation for Scientific Research (NWO) and the Ministry of Education, Culture and Science (OCW), 22 million euros from the Ministry for Economic Affairs (EZ), 10 million euros from third parties and 14 million from cash co-financing by companies participating in research projects (‘STW Organization’, 2015).
The project participants are composed from researchers and potential users of the results who are not directly a part of the research group. Besides partner input, financial or other contributions are conducted to the project. Knowledge institutions, large, medium and small businesses, parties involved in R&D and other potential users of the knowledge are eligible for participation in a R&D project. Partners have an opportunity to work alongside the researchers and be the first who learn from the generated results (von Raesfeld, Geurts, Jansen, et al., 2012).
3.2. Data Measurements
3.2.1. Dependent Variables
Product Development Score is defined as a degree to what the R&D project leads to a tangible product such as software, patent, prototype or process description (von Raesfeld, Geurts, & Jansen, 2012; von Raesfeld, Geurts, Jansen, et al., 2012). The performance measurement scale of the product development score is based on the STW database and the previous research of Raesfeld et al. (2012), distinguishing the following scale: (1) project prematurely terminated; (2) no tangible product; (3) a temporary design or principle was developed, verification still needed; and (4) a product was developed, such as software, a prototype, a process description or a patent. Due to the fact that both level 1 and 2 include no product generated, these scores are combined into one. This leads to the final scale of product development score ranging from 1 to 3.
Revenue Development Score is defined as a degree to what the R&D project generated revenues. Similarly, the revenue generation performance scale is based on the STW database and the research of Raesfeld et al. (2012), leading to the following scale: (1) project failed; (2) no revenues; (3) occasionally, bits of knowledge are sold but no revenues from exploitation; (4) continuous stream of revenues from knowledge exploitation. Due to the fact that both level 1 and 2 generate no revenues, these scores are combined into one score. Additionally, the dataset identified a small number of observations at level 4, therefore the level 3 and 4 were combined. Thus, the final revenue development performance is measured by a binary scale with values of 0 and 1.
3.2.2. Independent Variables
Euclidean Spatial Distance is defined as Euclidean distance per project, which is measured using the geographical distance between the project applicant and other participating partners in the project. The metric is calculated as the root of squared sum of the distances between the project applicant (i) and each of the other participating partners in the project (j), divided by the total number (n) of distances (Harrison & Klein, 2007). Distances between the project applicant and project participants are calculated in kilometres, using – as the crow flies – method. Distance preciseness ranges up to 100 metres. Since the research is based mainly on the Dutch firms and universities, the maximum distance between the partners was set to 250 kilometres.
This could be summarised by the following formula:
EDspatial (nProject) =
√
∑( ) ( ) ;Euclidean Closeness Distance is defined as Euclidean distance per project, which is measured using the closeness centrality distance between the project applicant and other participating partners in the project. The metric is calculated as the root of squared sum of the distances between the project applicant (i) and each of the other participating partners in the project (j), divided by the total number (n) of distances (Harrison & Klein, 2007).
Equally to previous variable, this could be summarised by the following formula:
EDcloseness (nProject) =
√
∑( )( ) ;
Euclidean Closeness Distance score per project is measured using the closeness centrality scores of the project partners. The closeness centrality score of individual partner refers to a position an actor holds in a social network in relation to other actors (Borgatti, 2005; Brandes, 2001; Freeman, 1978; Leydesdorff, 2007). The closeness centrality of a vertex in a graph is defined as the inverse of the average shortest-path (in links) distance from the vertex to any other vertex in a graph (Borgatti, 2005; Okamoto et al., 2008). A larger closeness centrality of a vertex presupposes shorter distance from the vertex to any other vertex, thus ensuring more central position within the network (Borgatti, 2005; Leydesdorff, 2007; Okamoto et al., 2008). Okamoto et al. (2008) provide an overview of various closeness centrality algorithms. In this study, closeness centrality is computed in UCINET 6 software tool.
Repeated Collaboration Score is defined as a degree of repeated collaboration experience in other on-going or finished projects among any of participants of a certain project. The metric is measured as the sum per project of repeated collaboration experiences among any participants of the specified project in another project included in the dataset divided by the number of participants. In case two or more project participants have established collaboration ties, and repeatedly collaborate within another or several projects, the analysed project gets a value of 1, if otherwise 0. Hence, the sum of repeated collaboration scores divided by the number of participants generates the final score per project.
3.2.3. Control Variable
An additional control variable was introduced to control for the other effects that might affect the product development and commercial performance of the collaborative R&D projects.
Number of Project Participants (Number of Participants) is measured as the sum of total number of actors participating in a specific project. Existing research indicates that a total number of participants affects the collaborative project performance (Capaldo & Petruzzelli, 2014a; Singh, 2008; Tatikonda & Rosenthal, 2000). A larger number of project participants enables to access more diverse knowledge and partner resources, benefit from economies of scale in R&D, and develop new ties in the network. Yet, increased partner number leads to more complex decision making and higher coordination costs that requires additional conformity between actors and might generate a detrimental effect (Capaldo & Petruzzelli, 2014a; Sampson, 2005; Singh, 2008; Tatikonda & Rosenthal, 2000; van Rijnsoever et al., 2015).
3.3. Data Collection
All data concerning the investigated R&D projects, firms, universities and other research institutions participating in the specific projects, technological diversity, and project results is collected from an extensive STW database. To test the proposed hypotheses of this research project, database is enriched with additional geographic information. The spatial distance (in kilometres) between all participants of a certain project was calculated using the postcode of the firms’ location. In case a right postcode was missing, an address was used as an alternative data entry method. All the distance calculations were performed using a website:
Table 3
Range, means, standard deviation and correlations of the variables (n = 419).
Range Mean S.D. 1 2 3 4 5 6 7
Product Development Score 1 - 3 2.076 0.728 1
Revenue Development Score 0 - 1 0.284 0.451 .465** 1
Euclidean Spatial Distance .70 - 250.00 107.278 46.529 -.064 -.046 1
Euclidean Closeness Distance 0.004 - 0.445 0.124 0.052 .048 -.054 .123* 1
Euclidean Closeness Distance Squared .00 - .20 0.018 0.015 .033 -.065 .096 .932** 1
Repeated Collaboration Score 0.00 - 35.60 10.310 7.301 -.139** -.085 -.026 -.058 -.070 1
Number of Participants 2.00 - 23.00 6.427 2.596 .094 .025 .124* .165** .109* -.008** 1
N of cases 419
** Correlation is significant at the 0.01 level (2-tailed).
Table 4
Determinants of Product Development Score of the joint R&D projects (n = 419).
Table 5
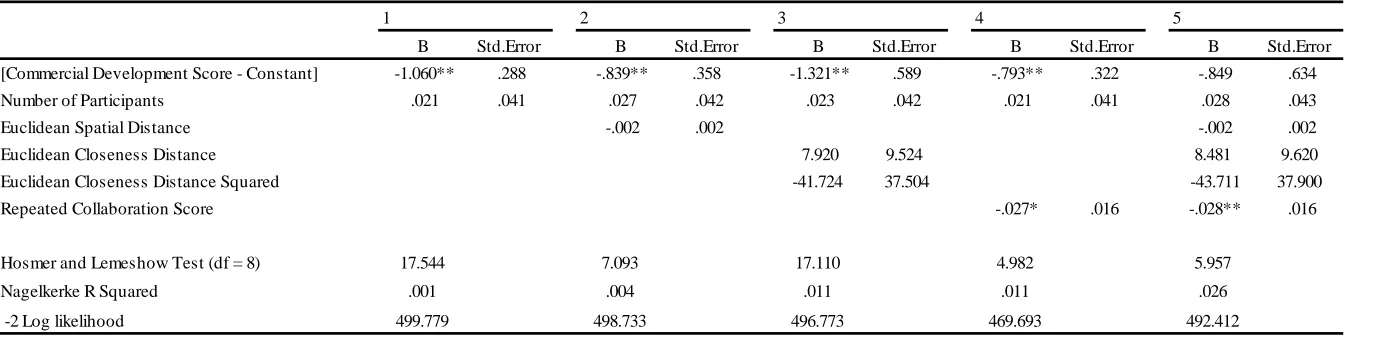
Determinants of Commercial Development Score of the joint R&D projects (n = 419).
1 2 3 4 5
Estimate Std.Error Estimate Std.Error Estimate Std.Error Estimate Std.Error Estimate Std.Error [Product Development Score = 1] -.786** .251 -1.098** .315 -.568 .397 -1.198** .288 -1.296** .453 [Product Development Score = 2] 1.262** .256 .961** .313 1.482** .403 .882** .285 .800* .449
Number of Participants .067* .036 .075** .036 .061* .036 .065* .068** .037
Euclidean Spatial Distance -.003* .002 -.004* .002
Euclidean Closeness Distance 3.201 4.968 3.681 4.999
Euclidean Closeness Distance Squared -6.787 16.474 -9.510 16.551
Repeated Collaboration Score -.036** .013 -.036** .013
Nagelkerke .009 .017 .011 .031 .041
Chi-Square 3.508* 6.205** 4.044 11.703** 15.292**
* Sigificant at 10%. ** Significant at 5%.
1 2 3 4 5
B Std.Error B Std.Error B Std.Error B Std.Error B Std.Error
[Commercial Development Score - Constant] -1.060** .288 -.839** .358 -1.321** .589 -.793** .322 -.849 .634
Number of Participants .021 .041 .027 .042 .023 .042 .021 .041 .028 .043
Euclidean Spatial Distance -.002 .002 -.002 .002
Euclidean Closeness Distance 7.920 9.524 8.481 9.620
Euclidean Closeness Distance Squared -41.724 37.504 -43.711 37.900
Repeated Collaboration Score -.027* .016 -.028** .016
Hosmer and Lemeshow Test (df = 8) 17.544 7.093 17.110 4.982 5.957
Nagelkerke R Squared .001 .004 .011 .011 .026
-2 Log likelihood 499.779 498.733 496.773 469.693 492.412
[image:9.792.61.748.339.508.2]for the social network analysis purposes was prepared and data was analysed with UCINET 6 software package.
3.4. Data Analysis
To test proposed hypotheses, regression analysis was performed using the SPSS 22 software package. For non-linear relationships, logistic regression was applied. In order to test the impact of independent variables on product development performance, which is a three level ordinal variable, an ordered logistic regression was performed. In order to test the impact of independent variables on the project commercial performance, which is a two level ordinal variable, a binary logistic regression was selected as the method of analysis.
Additionally, to investigate the network composition of collaborative technology research project members and their interactive relationships between them a scientific network analysis was conducted. The UCINET 6 software package enables to perform all the necessary calculations and network data processing leading to in-depth understanding and representation of the network structure, composition and the interaction between its elements (Borgatti et al., 2002). Finally, some descriptive statistics are used in the research to describe the collaborative technology research project network, its members and their affinity to different R&D projects.
4.
RESULTS
[image:10.612.336.544.103.194.2]Table 1 presents descriptive statistics for the analysed R&D projects. The sample used for analysis consists of 419 collaborative projects with participants ranging from 2 to 23. The mean is 6.43 participants per project and standard deviation is 2.60.
Table 1
R&D Project Descriptive Statistics.
Table 2 presents descriptive statistics for the project participants. For analysis purposes 798 unique partners, (i.e. universities, firms, research institutions) were included in the dataset. The number of projects a specific partner participated in ranges from 1 to 165. The mean value of projects per partner is 3.37 with standard deviation of 11.14.
Table 2
R&D Participating Partner Descriptive Statistics.
Table 3 reports descriptive statistics and correlations of all the variables included in the analysis. The observed correlation values between independent variables are relatively low, falling below .70 threshold, thus indicating acceptable levels (Cohen, Cohen, West, & Aiken, 2013). Higher correlation between Euclidean Closeness Distance and its squared variable is expected. Additionally, to check for the potential multicollinearity issues, variance inflation factor (VIF) values were tested. Observed values were below the established threshold of 10, therefore identified variables could be included in the model simultaneously (Field, 2009; Lin et al., 2012).
The results of ordinal logistic regression are reported in Table 4, while the results of binary logistic regression are reported in Table 5. In the analysis of both dependent variables, Model 1 in Tables 4 & 5 present the effect of control variable, whereas Models 2 – 4 evaluate the effect of each independent variable. In both cases, all variables are combined in the Model 5. Overall, full models show a good fit with data. Further discussion will be based on the full Model 5 results.
Hypotheses 1 and 2 investigated the impact of geographical distance on the R&D project performance. Hypothesis 1 predicted a negative impact of geographical distance between project partners on the collaborative R&D project product development performance. The results show a negative and significant relationship between variables at 0.1 level, thus Hypothesis 1 is not rejected and could be partially confirmed (Model 5 in Table 4). Hypothesis 2 also generated predicted negative relationship, but not significant, therefore Hypothesis 2 cannot be confirmed (Model 5 in Table 5). Thereby, it could be argued that shorter spatial distance between project applicant and project participants favour higher product development results, and could stimulate commercial performance respectively.
Hypothesis 3 states that closeness centrality distance between the partners has an inverted U-shaped effect on the joint R&D project product development performance. To investigate this effect, original closeness centrality variable tests the main effect of closeness centrality distance on product development performance. The negative coefficient of the squared centrality closeness distance variable indicates that there is an inverted U-shaped effect between identified variables. However, the result is not significant; therefore Hypothesis 3 should be rejected (Model 5 in Table 4). In a similar manner, Hypothesis 4 is intended to evaluate the existence of U-shaped effect between closeness centrality distance among R&D project partners and the project commercial performance. Although results support an inverted U-shaped effect by depicting positive main effect and negative coefficient of the squared closeness centrality M inimum number of project participants 2.00
M aximum number of project participants 23.00
Range 21.00
M ean 6.43
Std. Deviation 2.60
N of projects 419
M inimum number of projects per partner 1.00
M aximum number of projects per partner 165.00
Range 164
M ean 3.37
Std. Deviation 11.14
[image:10.612.69.274.472.563.2]variable, results are not statistically significant, therefore Hypothesis 4 should be rejected (Model 5 in Table 5).
Hypothesis 5 states that existing repeated collaboration ties between the R&D project partners have a positive impact on the joint R&D project product development performance. Contrary to this hypothesis, results show significant negative relationship; hence this hypothesis cannot be confirmed (Model 5 in Table 4). Hypothesis 6 predicted that existing repeated collaboration ties between the R&D project partners should have a positive impact on the joint R&D project commercial performance. Also in this case, contrary to predicted outcome, significant negative relationship was observed, therefore Hypothesis 6 should be rejected (Model 5 in Table 5). Such outcome could be associated with the possible technological and innovative lock-in situations, when partners with well-established collaboration ties, and previous collaboration experience develop certain process routines and share a common knowledge base, thus leading to reduced potential to generate new, innovative resource and information combinations. In turn, reduced potential to develop new products has also a detrimental effect on the joint product commercial success (Boschma, 2005; Cui & O'Connor, 2012; Sampson, 2007).
Regarding control variable, the number of partners participating in the project shows positive significant effect on the product development performance and almost significant positive effect (at 0.1 level) on the joint R&D project commercial performance. This leads to conclusion, that larger number of participants per project indeed favours more diverse knowledge and resource sharing, access to valuable partners in the network, and more timely and intensive information exchange, thus enabling to create more unique product development combinations. In some situations, this might enhance also the product commercial success (Capaldo & Petruzzelli, 2014a; Singh, 2008; Tatikonda & Rosenthal, 2000).
5.
DISCUSSION & CONCLUSIONS
The joint inter-firm research collaborations could be a key driver boosting firm’s innovation potential. Collaborative R&D projects combine diverse partner resources, knowledge, and research competencies generating collaborative value that facilitates new product developments and enhances commercial success of the firms. Increasingly, the role of universities in the business and innovation networks is acknowledged and becomes of strategic importance. Superior research capabilities, continuous generation of knowledge and technological advancements, and entrepreneurial interests of universities, often supported by governmental funding, foster many firms to engage in joint collaborations with universities. However, there is no consensus reached concerning the factors that determine the success of the joint R&D partnerships. The network and partner characteristics that determine the performance of joint research partnerships have been partly explored so far, presenting controversial results. The main objective of this study was to examine the effect of partner geographical location and position within the business network on the joint R&D project product development and commercial performance.
Specifically, results of this study illustrate that spatial proximity is an important determinant of university-industry (U-I) research
partnerships. In line with the proposed hypothesis, it was found that larger geographical distances between the project applicant and other participants have a negative effect on the product development performance. This suggests that universities and research institutions that act as project initiators generate knowledge externalities that are geographically bounded, thus benefiting the firms co-located in the same region or sharing the membership in the cluster (Ponds et al., 2010; Steinle & Schiele, 2008). Existing research identifies that spatial proximity is a vital determinant of cluster development (Balland et al., 2014; Ben Letaifa & Rabeau, 2013; Carbonara, 2004; Steinle & Schiele, 2002). More closely located partners are exposed to frequent formal and informal interactions that bolster trust-based inter-organisational relationships and development of knowledge-sharing channels (Ben Letaifa & Rabeau, 2013; Capaldo & Petruzzelli, 2014b). In addition to more intensive knowledge and tacit information sharing, clustered companies benefit from an increased availability of complementary products and services, have better access to new partners, specialised human capital, and specific information and public institutions, such as specialised education or associations (Menzel & Fornahl, 2009; Patti, 2006; Steinle & Schiele, 2008). These factors notably facilitate new product development, and provide additional competitive advantages compared to more distant partners. However, higher product development performance is not directly linked to products’ commercial success. The results support that geographical distance also has a negative impact on R&D project commercial success, although not significant. This implies that spatial proximity is a complex concept that is being mediated by other distinct or complementary factors.
To further investigate the impact of social proximity, repeated collaboration ties were examined. Based on the research of Petruzzelli (2011) and Capaldo & Petruzzelli (2014), repeated collaboration ties between the partners involved in the joint collaborative project could facilitate the product development, and commercial performance respectively. Partners with existing collaboration experience share higher level of trust, possess similar knowledge base and have developed working routines (Cui & O'Connor, 2012). In the U-I collaborations, when the level of uncertainty and information asymmetry is high, these factors optimise the collaboration processes and reduce the transaction costs (Petruzzelli, 2011; Sampson, 2007). Therefore, it was predicted that repeated collaboration ties would report a positive effect on the product and commercial performance of the joint R&D projects. In both cases, a significant negative relationship was found. This could be explained by the number of factors. Most projects in the dataset include more than two participants (mean = 6.43), therefore in situations of repeated collaboration between two partners, the overall project composition is different that leads to new project execution practices and unique partner interactions that weaken the effect of existing collaboration ties. Moreover, high mutual trust and established working routines between the partners increase the similarity of partner characteristics and diminish the potential of new resource combinations. This in turn leads to innovative lock-in situation when partners neglect the importance of diverse knowledge resources, and the future repeated collaborations generate continuously lower returns. Also, past experiences might possess a detrimental effect if partners experienced negative collaboration previously (e.g. previous project failed) and are repeatedly engaged in a new project (Balland, 2012; Balland et al., 2014).
5.1. Theoretical and Managerial Implications
This study presents several theoretical and managerial implications. In addition to the findings elaborated above, this study provides a comprehensive literature review on the joint R&D partnerships and the factors that affect the partner collaborative performance, from the perspective of university-industry (U-I) collaborations. In a complementary manner the concept of university-industry collaborations is analysed together with the proximity theory. This paper provides an overview of spatial and social proximity types, from the practical perspective, including the importance of business network embeddedness and regional clusters. This paper contributes new empirical findings to the on-going debate regarding the joint research project performance and performance stimulating factors. The empirical analysis is applied to the joint research projects, from the STW database that includes the leading firms and academic institutions in the Netherlands. The key contributions could be analysed threefold. First, present study reveals that spatial and social proximities should be considered as complementary, nevertheless of the individual importance. This is line with the existing research stream (Balland, 2012; Balland et al., 2014; Boschma, 2005). Second, the impact of spatial distance between the project applicant and other participants, as well as partner network position and established network ties have a varied effect between product development and project commercial performance. Third, optimised collaborative R&D partnerships require to experiment with the partner composition to avoid technological lock-in situations, and therefore some proximity
might be compensated by another. Additionally, the number of project partners might be an important determinant. Attracting additional partners might compensate the lacking partner research capabilities and broaden the existing knowledge base, thus favouring enhanced innovation performance.
From the practical perspective, this paper might be of high importance to firms and research institutions already engaging or planning to launch a collaborative R&D project. This study contributes to enhancing the existing R&D project planning and management practices, and shares important insights into innovation performance optimisation of the R&D partnerships. The findings of the study indicate that firms considering engaging in the collaborative R&D project with academic research institution should evaluate the possibility to partner with local or regional representatives to access the positive knowledge externalities. Furthermore, partners should strive ideally to a well-balanced and diverse project partner composition that would enable the project participants to benefit from sufficient level of proximate similarities, while avoiding a detrimental effect.
5.2. Limitations and Further Research
2008; Nooteboom et al., 2007; van Rijnsoever et al., 2015). Hence, the optimised composition of the collaborative research partnerships is still a major challenge. Finally, the latest technological advancements and Web 2.0 are shaping the existing business practices. An investigation how these technologies are implemented and used for joint research purposes might reveal interesting insights.
6.
ACKNOWLEDGMENTS
I would like to thank to Dr. Ariane von Raesfeld Meijer for useful comments and suggestions during the research period, and continuous support, Tamara Oukes for providing data and sharing ideas, and also Dr. Kasia Zalewska Kurek for supervising and assistance.
7.
BIBLIOGRAPHY
Aarikka-Stenroos, L., & Jaakkola, E. (2012). Value co-creation in knowledge intensive business services: A dyadic perspective on the joint problem solving process. Industrial Marketing Management, 41(1), 15-26.
Aarikka-Stenroos, L., Sandberg, B., & Lehtimäki, T. (2014). Networks for the commercialization of innovations: A review of how divergent network actors contribute. Industrial Marketing Management, 43(3), 365-381.
Abramovsky, L., Harrison, R., & Simpson, H. (2007). University Research and the Location of Business R&D*. The Economic Journal, 117(519), 114-141.
Ahuja, G. (2000). Collaboration networks, structural holes, and innovation: A longitudinal study. Administrative science quarterly, 45(3), 425-455.
Amin, A., & Wilkinson, F. (1999). Learning, proximity and industrial performance: an introduction. Cambridge Journal of Economics, 23(2), 121-125.
Arundel, A., & Geuna, A. (2004). Proximity and the use of public science by innovative European firms. Economics of Innovation and new Technology, 13(6), 559-580.
Audretsch, D. B., Lehmann, E., & Warning, S. (2005). University spillovers and new firm location. Research policy, 34(7), 1113-1122.
Autant‐Bernard, C., Billand, P., Frachisse, D., & Massard, N. (2007). Social distance versus spatial distance in R&D cooperation: Empirical evidence from European collaboration choices in micro and nanotechnologies*. Papers in Regional Science, 86(3), 495-519.
Bala, V., & Goyal, S. (2000). A noncooperative model of network formation. Econometrica, 68(5), 1181-1229.
Balland, P. (2012). Proximity and the evolution of collaboration networks: evidence from research and development projects within the global navigation satellite system (GNSS) industry. Regional Studies, 46(6), 741-756.
Balland, P., Boschma, R., & Frenken, K. (2014). Proximity and innovation: From statics to dynamics. Regional Studies(ahead-of-print), 1-14.
Barajas, A., & Huergo, E. (2010). International R&D cooperation within the EU Framework Programme: empirical evidence for Spanish firms. Economics of Innovation and New Technology, 19(1), 87-111.
Baum, J., Calabrese, T., & Silverman, B. S. (2000). Don't go it alone: Alliance network composition and startups' performance in Canadian biotechnology. Strategic management journal, 21(3), 267-294.
Ben Letaifa, S., & Rabeau, Y. (2013). Too close to collaborate? How geographic proximity could impede entrepreneurship and innovation. Journal of Business Research, 66(10), 2071-2078.
Beugelsdijk, S., McCann, P., & Mudambi, R. (2010). Introduction: place, space and organization—economic geography and the multinational enterprise. Journal of Economic Geography, 10(4), 485-493.
Borgatti, S. P. (2005). Centrality and network flow. Social Networks, 27(1), 55-71.
Boschma, R. (2005). Proximity and innovation: a critical assessment. Regional studies, 39(1), 61-74.
Brandes, U. (2001). A faster algorithm for betweenness centrality. Journal of mathematical sociology, 25(2), 163-177.
Caner, T., Sun, J., & Prescott, J. E. (2014). When a firm's centrality in R&D alliance network is (not) the answer for invention: The interaction of centrality, inward and outward knowledge transfer. Journal of Engineering and Technology Management, 33, 193-209.
Capaldo, A., & Petruzzelli, A. M. (2014a). Partner Geographic and Organizational Proximity and the Innovative Performance of Knowledge-Creating Alliances. European Management Review, 11(1), 63-84.
Carbonara, N. (2004). Innovation processes within geographical clusters: a cognitive approach. Technovation, 24(1), 17-28.
Casanueva, C., Castro, I., & Galán, J. L. (2013). Informational networks and innovation in mature industrial clusters. Journal of Business Research, 66(5), 603-613.
Cohen, J., Cohen, P., West, S. G, & Aiken, L. S. (2013). Applied multiple regression/correlation analysis for the behavioral sciences: Routledge.
Conway, S., & Steward, F. (2009). Managing and shaping innovation: Oxford University Press.
Cowan, R., David, Paul Allan, & Foray, Dominique. (2000). The explicit economics of knowledge codification and tacitness. Industrial and corporate change, 9(2), 211-253.
Crevoisier, O. (2004). The innovative milieus approach: toward a territorialized understanding of the economy? Economic geography, 80(4), 367-379.
Cui, A. S., & O'Connor, G. (2012). Alliance portfolio resource diversity and firm innovation. Journal of Marketing, 76(4), 24-43.