19th February 2016
Internship report - Ultrashort laser processing of
glass; cutting and micro surface structuring of
soda-lime glass
Author:
Hille GROENDIJK, BSC,S1003771
Institution:
Lehrstuhls für Photonische Technologien, Friedrich-Alexander Universität Erlangen-Nürnberg
Mentor:
Ilya ALEXEEV, PHD
Erlangen, 14 SEPTEMBER2015 to 18 DECEMBER2015
UNIVERSITY OFTWENTE, Applied Laser Technology
Internship coördinator University of Twente:
Preface
The report before you describes my results and findings during my 15 week internship at the institute of Photonic Technologies on the Friedrich-Alexander University Erlangen-Nürnberg, performed from September 14th 2015 to December 18th 2015.
I would like to thank my mentor Ilya Alexeev for all the guidance and knowledge he provided me during my time here. I would also like to thank Janine and Katherine for executing the chemical etching procedure countless times and several staff members from the chair for providing adminis-trative and practical assistance during my stay.
Abstract
Ultrafast laser processing of glass has been a hot topic over the last decade. In this report, a femto-second laser setup with an average power output of only 3.2 W will be used for cutting and surface structuring of soda-lime glass. The objective of this research is to get in-house knowledge about both the laser glass cutting and laser surface structuring of glass, this includes finding laser parameters and typical achievable results. Cutting of glass is done by combining two existing and proven cutting methods, namely controlled fracture propagation and elongated spot cutting. Optimal cutting para-meters are discovered for cutting figures of different shapes and sizes. Squares and circles between 5 and 20 mm can be created from a sample with a 26 mm width, more complex shapes like stars are hard to create due to random cracking, shortcutting and not reaching the tensile stress threshold. Surface structuring is done by surface laser modification with a subsequent selective etching step using hydrofluoric acid as etchant. The influence of the laser and etching parameters on the res-ulting glass structures is investigated, namely groove depth increases sharply with laser power at a specific threshold and decreases almost linearly with laser scanning speed. The oscillation amplitude decreases with increasing scanning depth and multiple pathing, although multiple pathing also de-creases the depth consistency.
Table of contents
Preface I
Abstract II
Table of contents III
1 Introduction 1
2 Theoretical aspects 2
2.1 Beam waist radius, Rayleigh range and the peak intensity . . . 2
2.2 Cutting techniques of glass . . . 5
2.3 Surface structuring of glass . . . 7
3 Experimental aspects 8 3.1 Setup . . . 8
3.2 Cutting technique of soda-lime glass . . . 9
3.3 Sample preparation, etching procedure and sample analysis . . . 10
4 Results 11 4.1 Laser power measurements . . . 11
4.2 Glass cutting . . . 12
4.2.1 Preparation cutting samples . . . 12
4.2.2 Cutting of shapes . . . 12
4.2.3 Minimal and maximal dimensions and angles of cracks . . . 18
4.2.4 Roughness of cutting surfaces . . . 19
4.2.5 Etching of unfinished cracks. . . 20
4.3 Glass surface structuring . . . 21
4.3.1 Laser parameters for the etching of glass. . . 21
4.3.2 Influence polarization laser light on etching result. . . 21
4.3.3 Varying laser power and scanning speed and multiple pathing. . . 22
4.3.4 Varying etching parameters . . . 32
4.3.5 Symmetrical grating structures . . . 34
4.3.6 Flat bottom grooves . . . 35
5 Conclusion 38
6 Discussion and recommendations 39
1
Introduction
Ultrafast laser processing of glass is a fast growing topic of interest in recent years. Two applications of ultrafast laser processing are laser glass cutting and laser surface structuring of glass, techniques for these applications are already successfully demonstrated in recent research[5],[7],[1],[6], how-ever detailed information about the methods and results are not widely available yet.
To gather in-house information on these subjects an ample amount of experiments will be done to test a new ultrafast laser cutting technique and to gather information about glass surface structuring with using glass modification and subsequent etching of soda-lime glass.
Based on results from literature appropriate glass modification parameters and etching parameters will be investigated. Etching results will be analyzed mainly using a laser scanning microscope since typical etching structures are on a micrometer scale. Both negative and positive results from the experiments will be shown and discussed in order to give a complete overview of the findings of the experiments and to give further insight in what can and can not be done with this USP laser setup in terms of glass cutting and glass surface structuring using glass modification and subsequentnt etch-ing.
2
Theoretical aspects
2.1
Beam waist radius, Rayleigh range and the peak intensity
A laser setup has several important properties that determine the effect of the laser on the material that is being modified. For the modification of glass the beam waist radius, Rayleigh range and intensity are such important parameters.
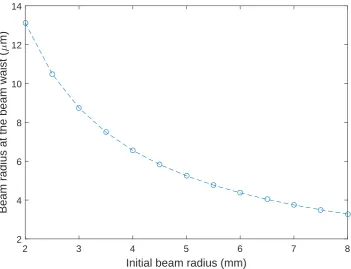
The beam waist radius is the radius of the beam in the focus after a focusing lens and the point of the highest intensity of the laser setup. The equation to calculate the beam waist radius in the beam focus is given by equation 2.1.
ωf =
λf
πω0. (2.1)
WhereWf is the beam radius of the beam waist, in other words the beam radius in the focal spot of a setup,λis the wavelength of the laser, f the focal length of the lens andω0is the initial beam radius before the laser focusing lens.
The Rayleigh range, or Rayleigh length is the distance along the axis of propagation where the area of the beams cross section is doubled compared to that of the beam in the focal spot. The Rayleigh range is an indication of how tightly the beam is focussed, a longer Rayleigh range indicates a smaller far-field divergence angle and is related to the beam radius of the beam waist as is shown in equation 2.2.
Zr=
πω2
f
λ (2.2)
Finally the peak intensity at the beam waist is related to the minimal beam waist at the focal spot and to the power of the laser beam and is given by equation 2.3. The maximum intensity and Rayleigh range are useful parameters when there are material thresholds for modifications, for example the threshold for glass ablation, melting or the forming of specific micro- or nanostructures.
I0= 2P0
πωf2
(2.3)
Initial beam radius (mm)
2 3 4 5 6 7 8
Beam radius at the beam waist (
µ
m)
[image:7.595.118.470.117.386.2]2 4 6 8 10 12 14
Initial beam radius (mm)
2 3 4 5 6 7 8
Rayleigh range (
µ
m)
0 100 200 300 400 500 600
Initial beam radius (mm)
2 3 4 5 6 7 8
Maximal intensity in focus (MW/m
2
)
×104
0 2 4 6 8 10 12 14 16 18
Figure 2.3: Maximum intensity in the beam waist as function of the initial beam radius entering the optical scanhead.
2.2
Cutting techniques of glass
For the cutting of soda-lime glass there are already several (laser) cutting methods available, namely ablation cutting with short pulse (SP) and ultrashort pulse lasers (USP), scribe and break, volume scribing, cutting using an elongated spot (Bessel, filamentation) and controlled fracture propagation due to thermally induced stresses[5],[7].
Ablation cutting with short pulsed and ultra short pulsed lasers is a very well established cutting method, see figure 2.4a. When the intensity of the laser beam exceeds the ablation threshold of the glass, the glass molecules will simply be ablated from the bulk material untill a cut is made. This is however a fairly slow process and also leaves glass dust particles on the rest of the sample.
Scribe and break is a method where the glass is scribed by using a laser or mechanically using a scribing wheel, introducing a small groove in the glass. Subsequently the glass is cracked using force as can be seen in figure 2.4b. This method of glass breaking is very fast, but glass residues, path deviation and the extra use of a mechanical assisting force are the disadvantages of this method.
Figure 2.4: Cutting of glass by (a) ablation of glass with SP or USP lasers and (b) scribe and break[5].
step.
Cutting using elongated spots can be achieved by using appropriate laser focusing and using self focusing effect of the material. With adequate power elongated spots will create a small modification along the whole depth of the glass sample, combining these modifications together will create a weak path that can be broken when applying an external force. This is also a dust free way of cutting glass but the cutting quality is often not that high. Elongated spot cutting is shown in figure 2.5b.
Figure 2.5: Cutting of glass by (a) small volume modifications with high-NA focusing and (b) elong-ated spot modifications[5].
2.3
Surface structuring of glass
Surface structuring of glass can be done by applying material modifications with a laser followed by an etching procedure. A typical etchant used for the etching of soda lime-glass is liquid hydrogen fluoride or hydrofluoric acid, abbreviated with "HF". It is already shown in other research, that selective modification of soda-lime glass with specific laser parameters can introduce birefringent modifications that can increase the etching speed of the modified region up to a factor of 300[2]. A possible explanation of the increased etching speed is the creation of nanostructures in the modified regions [4],[3]. These nanostructures are formed perpendicularly oriented to the laser beams electrical field
E[4], and are shown in figure 2.6.
3
Experimental aspects
3.1
Setup
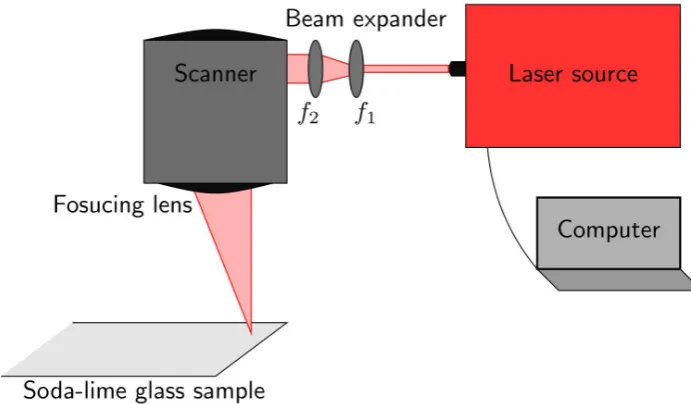
A schematic figure of the optical setup used for the experiments is shown in figure 3.1, this setup will be used for both glass cutting and glass surface structuring. The laser source used is the OneFive Origami - 10 XP and was controlled by a regular computer with a piece of software included with the laser. The specifications of the laser are shown in table 3.1.
Figure 3.1: Side view of the experimental laser setup.
Laser specifications Origami - 10 XP
Center wavelength 1030 nm Pulse duration <400 fs Avg. output power (up to) 4 W
Pulse energy (up to) 40µm Peak intensity (up to) 100 MW Polarization extinction ratio >20 dB horizontal
[image:12.595.122.468.290.492.2]Amplitude noise <1% rms
Specifications Scanlab IntelliSCAN 14
Aperture 14 mm
Wavelength range
1030/515/343 nm, 1064/532/266 nm, 1070-1085 nm, 450-2500 nm, 9300-10600 nm
Max. laser power (standard systems 250 W @ 1064 nm Typical scan angle ±0.35 rad
Image field size (1064 nm, f=160 mm) (1064 nm, f = 160 mm) 95 mm x 95 mm Typical spot size (1064 nm, f=160 mm) 23µm
Marking speed (up to) 2 m/s Positioning speed (up to) 5 m/s
Table 3.2: Specifications of Scanlab intelliSCAN 14 scanhead.
The laser beam leaves the laser source on a height approximately 5 cm above the optical table and using an several mirrors the beam is guided through a beam expander into an optical scanhead. The beam expander simply consists of two separate lenses,f1is a concave uncoated lens with a focal distance of -50 mm. F2is a convex B-coated lens with a focal distance of 100 mm. Theoretically the beam expander will expand the diameter of the beam with a factor of two, however since the incoming beam from the source is slightly diverging the beam after the beam expander will also be slightly diverging and entering the scanhead with a larger diameter than intended. This will have effect on the focal distance of the setup. The separation between the lenses can however be adjusted to create a collimated beam by placing the lenses slightly closer together. This will however slightly also reduce the expansion factor of the beam expander. The scanhead used is an IntelliSCAN 14 from Scanlab, its specifications are shown in table 3.2. The scanhead basically is a Galvano-scanner with an additional casing to attach an aperture for the incoming beam and the focusing lens for the outgoing beam. The focusing lens is an f-theta scanning lens with a focal length f of 80 mm, internally consisting of a five part lens system.
A static stage is used to hold the glass samples in place, due to the flexibility of the scanhead. The stage used is a Micos PLS-85, it has a vertical displacement precision of 1µm and a range of 50 mm. The samples available are standard 1 mm thick Roth microscope slides made from soda-lime glass with a dimension of 75x26mm. Mostly cut edged (smooth) microscope slides are available. At a later stage also a batch of ground edged microscope slides was used.
3.2
Cutting technique of soda-lime glass
Already known and available cutting techniques are already described in section 2.2. A new cut-ting strategy proposed by K. Mishchik is to combine the elongated spot method and the in-volume thermally induced stresses to create a controlled fracture propagation with the advantages of both techniques, namely dust-free, zero-kerf cutting with a high surface quality[7].
be introduced by either surface ablation on the glass or a small defect or crack at the side or top of the glass. Once the crack is initiated it will be guided by the laser spot and will follow the path of the least resistance. This path might not exactly match the laser hot spot though, possibly due to non homogeneous properties of the glass[7].
3.3
Sample preparation, etching procedure and sample analysis
Hydrofluoric acid, the aqueous form of hydrogen fluoride (HF) is used to etch the glass samples as was already described as a typical etchant for soda-lime glass in section 3.3.
In order to reduce the amount of HF required for the etching procedure, modifications on the glass should be created as close to the long side end of the sample glasses as possible. Changing the height of the stage will help control the focus and therefore the positioning of the modifications. It is also possible to manually cut off additional unmodified glass if the modifications are displaced.
Samples are marked and engraved prior to etching with a waterproof marker and an engraving tool to make sure the samples are still distinguishable after the etching procedure. Samples are gathered in groups of 4 to 6 samples in a holder to reduce the etched time required, which is important since etching is a manually and dangerous process.
Appropriate HF percentages and etching times are determined or predicted and the samples are provided to the staff of the chemical lab. Since HF is a very dangerous acid, the etching can only be done by qualified chemists and the procedure is preferably carried out by at least two people together. The samples are drained in the diluted HF bath while being held in place by a holder. Stirring is done using an magnetic agitator. After etching, the samples are rinsed in normal water for at least 30 minutes to make sure the sample is clean of any HF. After drying the samples it is still advisable to use gloves while handling the samples, both to protect the skin against any leftover HF and also to make sure no fat from the hands will contaminate the samples.
4
Results
4.1
Laser power measurements
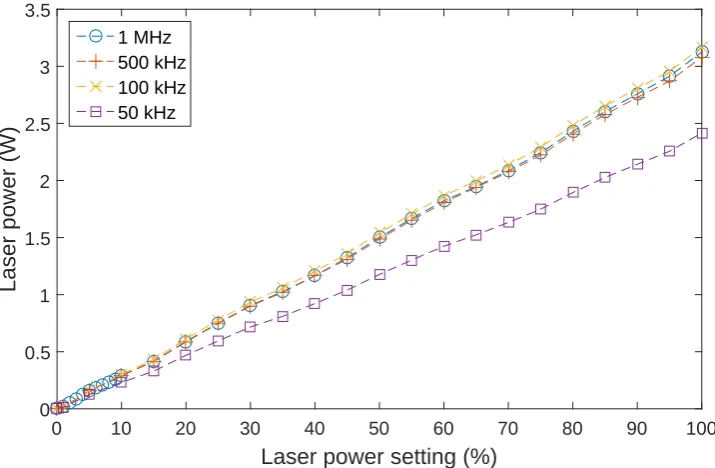
Some measurements of the laser power were done to get insight in the actual optical power output of the laser beam after all optical elements. According to the specifications of the laser the laser source got an output power of 4 W, but in practice the highest output power measured was approximately 3.2 W except for a repetition rate of 50 kHz, where the maximum output power dropped to 2.4 W restricted by the maximum pulse energy of the laser source. Due to the mirrors and lenses on the optical table, the scanner and the focusing lens the maximum output further dropped to 2.94 W. The laser output power can be set anywhere between 0 and 100% power with a piece of software, measurements were done to find the relation between the set power % and the output power of the laser. All powers were measured prior to the beam expander. The results are shown in 4.1 and it is apparent that there is a linear relationship between the set power and the produced power by the laser.
Laser power setting (%)
0 10 20 30 40 50 60 70 80 90 100
Laser power (W)
[image:15.595.115.473.341.575.2]0 0.5 1 1.5 2 2.5 3 3.5 1 MHz 500 kHz 100 kHz 50 kHz
4.2
Glass cutting
4.2.1
Preparation cutting samples
As already stated in section 2.2 a glass defect has to be introduced either by surface ablation or a small crack at the side to start a crack propagation in the sample. Ablating the sample for a small part and creating a cutting path from there requires the focus and/or power to be modified during the procedure, decreasing the time efficiënty. Instead the choice was made to create a cutting path from a defect in the side of the sample.
With optimal settings, namely 2.65 W to 2.94 W laser power output and a 300 kHz repetition rate a crack propagation was not guaranteed. The cut edged microscope slide samples used were rather fine and only had a very small chance around 25% to introduce a crack at the first try. This problem was solved by mechanically introducing small side defects on the sample, which was done either by using sandpaper or scratching it with another soda lime-glass microscope slide. After scratching, the sample should be cleaned with a cloth to remove any glass dust from the sample. Glass particles left on the glass sample can absorb or scatter the incoming beam and will negatively influence the cutting procedure. Roughening the cut edged microscope slides has improved the chance to introduce a crack from the side of the sample up to 90%.
Another option was to use ground edged microscope slides, these rough slides already have a 90% chance to introduce a crack from the side straight out of the box.
4.2.2
Cutting of shapes
Figure 4.2: Visible white cylindrical spot when focusing the laser in the middle of a soda-lime glass sample. Laser parameters: Repetition rate=300 kHz, power=2.64 W, scanning speed=1 mm/s.
By using trial and error it was found that cutting a the soda lime-glass microscope slide was pos-sible with a laser repetition rate between of 100 kHz up to 400 kHz. A 50 kHz repetition rate did not work, the maximum power output of the laser was too low for this repetition rate as can be seen in figure 4.1. Above 400 kHz repetition rate the laser pulse energy appeared to be too low to crack the glass. The laser was set to the maximum 2.94 W laser power for most experiments, however with a 100 kHz repetition rate it was possible to introduce and propagate a crack with only 2.35 W laser power and for a 200 kHz repetition rate this was possible upwards from 2.5 W laser power. These minimal powers however also depend on the laser spot size in the focus. With a beam radius of 4.75 mm entering the scanhead the calculated spotsize in the focus was around 5.5µm as can also be seen in figure 2.1. A straight glass cut made with a repetition rate of 300 kHz is shown in figure 4.3. Focusing the laser beam in the material is not always an easy task. The laser beams focus should be far enough from both the top and bottom of the sample to prevent surface ablation. A small devi-ation in the focus can easily cause this top or bottom surface abldevi-ation of the sample, especially when working with individual high energy pulses (low repetition rate) and full laser power. For example, with a 100 kHz repetition rate at 2.94 W power it was not possible to focus the beam in the sample, since either top or bottom ablation occurred regardless of the focus. Increasing the repetition rate or lowering the laser power will solve this.
Another issue is that the sample can not be perfectly horizontally positioned simply due to imperfec-tions of the used stage. Small tilts can ascertain spatial deviaimperfec-tions in focus of the beam, which can again cause unwanted top or bottom ablation of the sample. Especially the edges of the glass sample were often out of focus due to the way the sample is locked in place. By carefully setting up the three dimensional stage in a horizontal position these effects can be reduced to a minimum.
ablation due to a lower pulse energy for a repetition rate of 300 kHz compared to a 100 or 200 kHz repetition rate. A 400 kHz repetition rate had too little pulse energy resulting in unreliable crack propagation.
Typical cutting speeds are between 0.5 mm/s and 1 mm/s, where lower speeds were required for making more complex shapes, namely triangles, squares, circles, wavy lines and stars. Making these more complex shapes seemed less straight forward than one might expect. First of all in order to keep the crack propagating approximately 3 mm glass should be available on either side of the crack. This was especially a problem when finishing the last part of the shape or when making two cutting paths close together like in the case of a star.
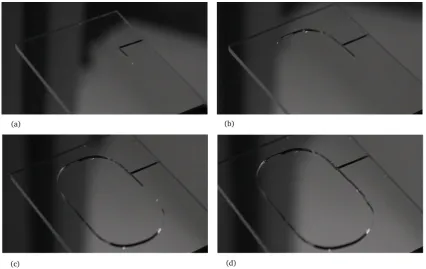
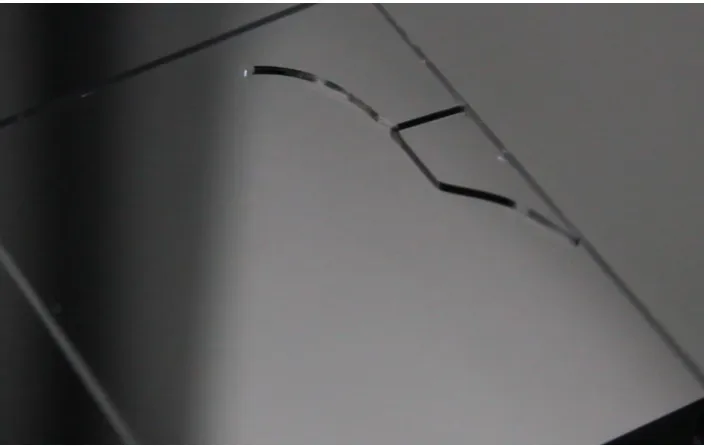
[image:18.595.121.443.349.597.2]Simply enlarging the whole shape, therefore increasing the distance between the cutting paths of a shape is a method to avoid this. The glass sample however also has a limited size (26 mm) and also a distance of around 3 mm should be kept from the sides of the sample, therefore limiting the maximum cut out shape width to approximately 20 mm. A second solution is making a part of the end of the crack at the start of the process. This is shown in figure 4.4. In figure 4.4a is visible how laser cracks an initial cut from the side, followed up by a perpendicular crack to one side. In figure 4.4b the laser path is turned around and proceeded in creating the desired shape. Figures 4.4c and d are taken very short after each other and show the completion of the cracking process, a very rapid and random process. This results in a really rough last bit of the shape.
Figure 4.4: Creating a pill shaped glass cut: (a) Initiating the crack from the side and creating the initial cut to the back, (b) cracking is proceeded in the opposite direction, (c) cutting crack closing in on the initial crack, (d) cutting path is completed. Laser parameters: repetition rate 300kHz, laser power=2.59 W, NA: 0.04.
Figure 4.5: An initial cut in the glass is further cracked in the wrong direction by induced material stress. Laser parameters: Repetition rate=300 kHz, power=2.65 W, scanning speed=1 mm/s.
Unwanted cracks to the side of the sample are also a problem when sharp edges are created close to the edge of the sample, for example in case of a square or a star. These random cracks often occur when the laser beam has already moved over 10 mm away from the spot where the random crack emerges from. A subsequential problem is that material stresses are used for this random crack and the designed crack is starting to lag further behind the laser spot due to a lack of stress until the tensile strength is not reached anymore and the cracking propagation stops. To avoid this situation it is best to cut off the leftover part of the sample for every corned that is being cut in a shape. In figure 4.4 is already clearly visible that the crack is always lagging behind the laser spot several millimeters. As a direct result, making sharp edges is not an easy task: often edges will become shorter than intended and not sharp as can be seen in figure 4.6. To solve this the laser path is discontinued and displaced on or close to the current position of the crack and will continue its path in the desired direction creating a sharp edge. With this method it was possible to cut a star shaped object as can be seen in figure 4.7. For high quality and smooth cracking it is however preferred to create figures without any sharp edges smaller than 90 °angles.
Figure 4.7: Soda-lime glass star shapes objects cut with the laser. Laser parameters: Repetition rate =300 kHz, power=2.65 W, scanning speed=0.5-1 mm/s, NA=0.04.
4.2.3
Minimal and maximal dimensions and angles of cracks
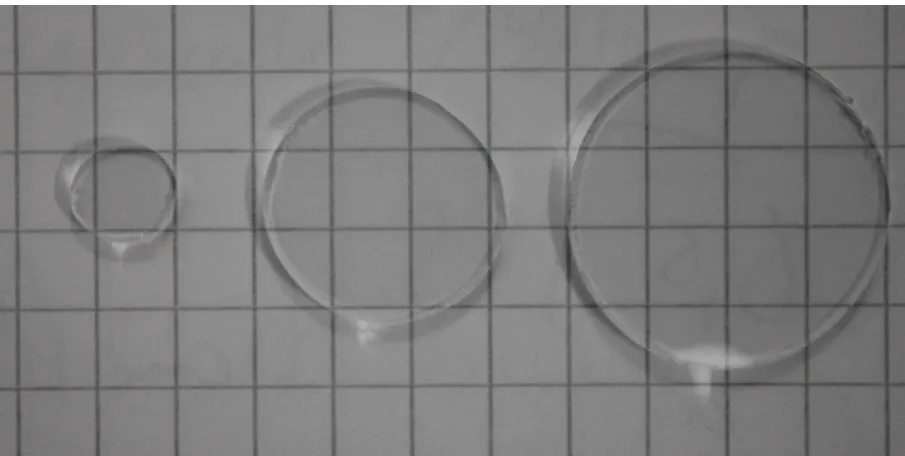
Figure 4.8: Minimum and maximum sized circles achieved with laser cutting. Laser parameters: Repetition rate=300 kHz, power=2.65 W, scanning speed=0.5-1 mm/s, NA=0.04.
4.2.4
Roughness of cutting surfaces
Ra[µm] Rq [µm] Rp[µm] Rv[µm] Rz[µm] Rc[µm] Rt[µm] Laser cut 0.008 0.011 0.072 0.047 0.119 0.033 0.254 Manual cut 0.008 0.011 0.038 0.037 0.075 0.035 0.158
[image:24.595.91.469.361.563.2]Rsk Rku Rsm[µm] R∆q[°] Rδc[µm] RzJIS[µm] Laser cut 1.219 19.705 11.828 2.516 0.015 0.039 Manual cut 0.772 5.054 13.775 1.787 0.015 0.042
Table 4.1: Roughness parameters of a laser cut and manually cut samples.
4.2.5
Etching of unfinished cracks.
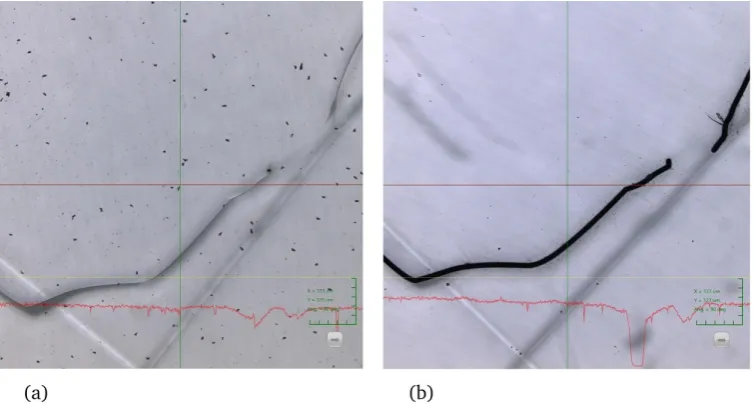
A lot of figures that were cut did not fully complete the wanted shape. Attempting to complete these cracks they were etched in a 20% hydrofluoric acid (HF) solution for 5 minutes. The sample is shown in figure 4.9, where 4.9a shows the sample before etching and 4.9b after etching. In the image before etching two straight laser paths and two separate cracks are visible. The crack in the upper right corner was due to a precut from the upper right side and the crack emerging from the bottom left is a result of the regular laser path. After etching the cracks have become wider and are way better visible, however the cracks did not propagate any further towards each other. Either the laser parameters used in the glass cutting are not feasible for selective glass etching or the etching parameters were not appropriate.
4.3
Glass surface structuring
4.3.1
Laser parameters for the etching of glass.
In order to find the right laser and etching parameters required for selective glass etching a different variety of samples were etched. Small lines were scanned over the width of the glass sample. The laser beam was focused on the bottom of the glass sample, clearly showing a white plume dot on the bottom of and partly in the sample. The samples were etched in a 20% HF solution for 5 minutes and the results are shown in table 4.2.
Repetition rate laser (kHz) 100 100 100 300 300 300 300 500 500 500 Laser power (W) 0.59 0.59 0.59 1.32 1.32 1.32 1.03 1.91 1.91 1.91
Scanning speed (mm/s) 5 10 20 5 10 20 5 5 10 20
Depth channel (µm) 0.2 0.05-0.15 0.1 3.5 2.7 0.7 0.8 4.8-6.5 4.2-5.9 7
Table 4.2: Initial etching results for finding appropriate modification laser parameters.
A large depth variance was observed between the created channels seen in table 4.2. The channels created with a 500 kHz repetition rate showed really inconsistent height results. The best results were achieved with a laser repetition rate of 300 kHz, combined with a 1.32 W laser power, a 5 mm/s scanning speed and a beam radius in the beam focus of 6µm. The top view of this channel is shown in figure 4.10. Another sample was prepared with the sample laser parameters. The sample was manually cut vertically and subsequently etched, the result is shown in figure 4.11. The highest increase in etching speed is only achieved in the middle 100µm of the modified area. An example of a very inconsistent channel created with a repetition rate of 500 kHz is shown in figure 4.12. A sample was also investigated prior to etching with the Zeiss Merlin electron scanning microscope and possible nanostructures were found, shown in figure 4.13.
4.3.2
Influence polarization laser light on etching result.
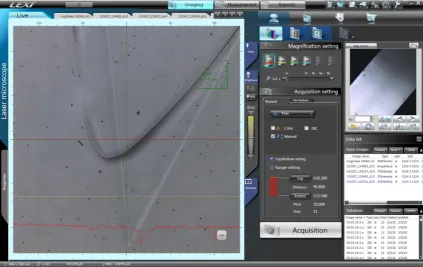
Figure 4.10: Etched out channel top view. Sample etched in 20% HF for 5 minutes. Laser parameters: Repetition rate=300 kHz, power=1.32 W, scanning speed=5 mm/s, NA=0.04.
4.3.3
Varying laser power and scanning speed and multiple pathing.
Experiments were conducted to find the influence of the laser power, scanning speed of the scanhead and the amount of overlaying laser paths on the resulting microstructures after etching. Starting with variating the laser power, the laser repetition rate was kept constant at 300 kHz, while the scanhead moved the laser beam with a speed of 5 mm/s. The NA of the system was still 0.04 and the radius of the beam entering the scanhead was 4.75 mm. The Laser power was varied between 0.44 W and 1.03 W. Depths of the channels were measured spatially for 20 different spots and the average depth is shown in figure 4.15. The samples were etched 3 minutes in 10% HF. A visual representation of the channels for different powers is shown in figure 4.16. To give an indication of the order of variation in channel depth, the parameters L1and L2are introduced and shown in table 4.3. L1is the difference between the minimum and maximum value of the depth of the channel from five measurements over a range of 10µm and L2from five measurements over a range of 100µm.
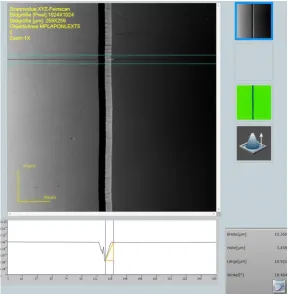
Figure 4.11: Etched out channel side view. Sample etched in 20% HF for 5 minutes. Laser parameters: Repetition rate=300 kHz, power=1.32 W, scanning speed=5 mm/s, NA=0.04.
the depth profile of the channels from figure 4.19. A larger version of figure 4.19b is available as figure 4.18.
Figure 4.12: Etched out channel top view. Sample etched in 20% HF for 5 minutes. Laser parameters: Repetition rate=500 kHz, power=1.91 W, scanning speed=5 mm/s, NA=0.04.
Laser power L1(µm) L2(µm)
0.44 W 0.01 0.02 0.47 W 0.01 0.02 0.50 W 0.02 0.02 0.53 W 0.11 0.13 0.56 W 0.13 0.15 0.59 W 0.23 0.38 0.74 W 0.15 0.17 0.88 W 0.09 0.09 1.03 W 0.04 0.09
[image:28.595.219.377.523.656.2]Figure 4.13: Potential nanostructures in an modified piece of soda-lime glass. Laser parameters: Repetition rate=300 kHz, power=1.47 W, scanning speed=10 mm/s, NA=0.04.
Figure 4.14: Two perpendicular etched grooves: (a) top view before etching, (b) top view of the channels after etching and (c) a "3D" view of the channels. Laser parameters: repetition rate=300 kHz, power=1.32 W, NA=0.04.
Scanning speed laser spot L1(µm) L2(µm)
10 mm/s 0.18 0.24 15 mm/s 0.06 0.25 20 mm/s 0.07 0.09 25 mm/s 0.01 0.03 30 mm/s 0.06 0.08
[image:29.595.188.407.583.666.2]Laser power (W)
0.4 0.5 0.6 0.7 0.8 0.9 1 1.1
Average depth channel (
µ
m)
[image:30.595.120.471.277.496.2]0 0.2 0.4 0.6 0.8 1 1.2 1.4 1.6
Laser scanning speed (mm/s)
10 12 14 16 18 20 22 24 26 28 30
Average depth channel (
µ
m)
[image:32.595.116.473.265.501.2]0.2 0.4 0.6 0.8 1 1.2 1.4 1.6
Figure 4.19: (a) Top view intensity and (b) depth profile of channels with varying scanning speeds. From left to right: 10 mm/s, 15 mm/s, 20 mm/s, 25 mm/s, 30 mm/s, 25 mm/s, 20 mm/s, 15 mm/s, 10 mm/s. Laser parameters: repetition rate=300 kHz, laser power=0.59 W, NA=0.04.
[image:34.595.91.505.425.649.2]The amount of laser passes on the same spot also influences the total amount of absorbed laser energy and therefore has influence on the resulting structures. Resulting channels created with single and double pathing show that it influences both the oscillation amplitude and the depth variation of the channels. A grating like structure made with a single laser path and etched in 20% HF for 5 minutes is shown in figure 4.21a. The sample in figure 4.21b is created using a double pathing of the laser. The delay between the two passes is usually a few minutes, as the laser path repeats after the whole scanning path is completed. A slight reduction of the oscillation amplitude is visible in figure 4.21b, although it is usually barely noticeable. The negative side of decreasing the channel oscillation in this way is that the channel width and depth consistency are reduced, meaning that the grating channels either have large varying individual depths and/or the channels relative to one another variate as can be seen in the depth profile in figure 4.21b. Samples produced with triple pathing even showed variations in channels depth half the size of the channel depth itself, making it not useful if any depth consistency is required.
4.3.4
Varying etching parameters
Both the percentage of the hydrofluoric acid solution and the etching time can be changed to influ-ence the etching result of the experiments. Figure 4.23 shows the channel depth as function of the etching time. L1and L2 values of these measurements are shown in table 4.5. The channel depth was taken as average value of 20 measurements.
[image:36.595.90.347.277.541.2]A linear trend is visible up to around a 4 minute etching time. A higher percentage hydrofluoric acid will also increase the etching speed, however it can introduce surface damage more easily as can be seen in figure 4.22. This surface damage was introduced by etching the sample for 10 minutes in 20% HF. Experiments to find the relationship between the percentage HF sollution and the channel depth were not conducted. Surface damage was also found when etching samples for<15 hours in 2.5% HF, but precise thresholds were not measured.
Figure 4.22: Etched out symmetrical grating etched for 10 minutes in 20% HF showing surface damage. Laser parameters: power=1.32 W, repetition rate=300 kHz, NA=0.04.
Etching time sample L1(µm) L2(µm)
2 minutes 0.10 0.14 3 minutes 0.13 0.26 4 minutes 0.13 0.26 5 minutes 0.15 0.20
[image:36.595.201.396.595.665.2]Etching time sample (minutes)
2 2.5 3 3.5 4 4.5 5
Average depth channel (
µ
m)
[image:37.595.117.470.264.504.2]1 1.2 1.4 1.6 1.8 2 2.2
4.3.5
Symmetrical grating structures
[image:38.595.93.511.273.531.2]It was already shown in figure 4.20 that channels or grooves can be combined together when using appropriate spacing,laser and etching parameters. After combination of the channels the etched out structures form a symmetrical grating like structure. A typical side profile of the depth of such a grating is shown in figure 4.24a. Figure 4.24b shows a top view intensity profile of the same sample. The dark parts of the grooves are either the upgoing or downgoing sides of the grooves and in the middle of the grooves a small lighter part is visible where the flat bottom part of the groove is located. Between the grooves some white space is often visible, meaning that there is unwanted spacing between the grooves, which can also be spotted between the third and fourth groove from figure 4.24a as a stump tip. Due to the groove oscillations as mentioned before these flat tops are inevitable, but can be reduced by increasing the scanning speed of the laser. The grooves produced always had a width over depth ratio between 5 and 10, meaning that the grooves are actually not very sharp.
Figure 4.24: Depth profile of the symmetrical grating structure. Laser parameters: power=0.82 W, laser repetition rate=300 kHz, scanning speed=15 mm/s, NA=0.04.
Figure 4.25: Smallest etched out symmetrical grating structure. Laser parameters: power=0.88 W, repetition rate=300 kHz, scanning speed=12.5 mm/s, NA=0.04.
4.3.6
Flat bottom grooves
In order to create a setup to more interesting etching structures an attempt was made to create grooves with a large horizontal area at the bottom of the channel. The flat bottomed grooves can for example be used to create phase masks.
Figure 4.26: Depth profile of a flat bottom channel after being etched for 6 minutes in 10% HF solution. Laser parameters: power=1.76 W, laser repetition rate=300 kHz, scanning speed=10 mm/s, NA=0.04.
Figure 4.27: Depth profile of two combined channels after being etched for 6 minutes in 10% HF solution. Laser parameters: power=1.91 W (left) and 1.71 W (right), laser repetition rate=300 kHz, scanning speed=10 mm/s, NA=0.04.
[image:40.595.91.307.351.545.2]channels would combine together in one larger channel, thus not having a flat bottom. A combined channel was created by spacing eight grooves 3µm from each other, shown in figure 4.28.
5
Conclusion
The laser power output of the laser linearly increases with the power setting of the laser. The max-imum laser output is 2.4 watt for a pulse repetition rate of 50 kHz and 3.2 watt for all other repetition rates 100 kHz up to 1 MHz. After passing through all optical elements of the setup the power output dropped to 2.94 W.
Starting from a defect in the side of a sample, cutting of soda-lime glass can be done with a technique combination of elongated spot creation and thermally induced fracture propagation. Optimal cutting laser parameters appeared to be a laser repetition rate of 300 kHz and a laser power of 2.65 W in combination with a focus spot radius around 6µm and a numerical aperture of 0.04. Squares and circles can be produced between 5 an 20 mm in size on a sample with a width of 26 mm. Star shapes were produced in rough shape between the size of 10 and 17 mm. The smallest cutting angle was slightly under 40 °and made use of a jumping laser spot to achieve a sharp edge.
Optimal cutting paths can be used to improve the reliability of cutting specific shapes, this includes the jumping of the laser spot to create sharper edged corners, making initial cuts to improve complet-ing the shape and removcomplet-ing additional glass from the sample to remove unwanted random crackcomplet-ing from corners.
Optimal laser parameters for the appropriate modification of soda-lime glass with a consecutive etching step were initially found to be a laser power of 1.32 W, a laser repetition rate of 300 kHz, a 5 mm/s scanning speed combined with a beam radius in the beam focus of 6µm. Keeping the laser beam perpendicular to the direction of the modification will increase the quality of the produced structure after etching.
Increasing the laser power will increase the groove depth steeply at a certain threshold point. Increas-ing the scannIncreas-ing speed of the laser spot will decrease the groove depth almost linearly. IncreasIncreas-ing the scanning speed of the laser spot will also reduce the oscillation amplitude of the grooves. Multiple pathing will also reduce the oscillation amplitude of the grooves but will also introduce a large groove inconsistency in terms of depth consistency and vertical displacement of both the grooves itself and relative to each other.
Increasing the etching time of soda-lime glass in hydrofluoric acid will linearly increase the depth of the etched grooves up to a certain point. Further increasing the etching time will most likely quickly introduce surface damage depending on the percentage of hydrofluoric acid used.
Symmetrical grating like structures can be created by combining grooves together with a specific spa-cing. The smallest grooves achieved had a width of 3.9µm and a depth of 0.56µm.
6
Discussion and recommendations
During glass cutting it was visible that there was some self focusing of the laser beam inside the glass, however it was hard to tell if the spots were elongated or not. The cracking was also lagging behind approximately 5 mm to the laser spot making the cut profile sometimes unreliable and random, just as in the case of controlled fracture propagation. It was therefore not sure that the used method was actually a combination of the elongated spot cutting and controlled fracture propagation, although the cutting results were actually quite promising.
Different methods were used trying to control the cracking direction, this included front and/or back ablation of the shape before cutting, going through the preferred shape with normal cutting paramet-ers and increased speed or reduced power without starting the actual crack at the side of the sample in an attempt to weaken the material. This however didn’t yield any notable benefit and only added a lot of time and complexity to the cutting procedure. It would be recommended to use a larger glass sample, since cracking further away from the edge of the glass sample might reduce the random unwanted cracking. It is also recommended to experiment with different beam expanders, changing the beam radius at the beam focus and the Rayleigh length of the beam and therefore influencing the cutting result.
A problem with the etching of soda-lime glass was the slow feedback rate of results. Whenever a sample was prepared, it would take one day to etch and rinse it and it would take another day to measure and analyze the sample after etching. Previous results were generally required to create new samples. It was because of this slow feedback rate that it was difficult to create full range data sets, for example the relation between the laser scanning speed and the groove depth shown in figure 4.19 only shows scanning speeds between 10 and 30 mm/s. Complementing these measurements was often not possible, since a slightly different foci would already influence the results too much, so the whole data set would have to be measured all over again simply costing too much time. It is therefore recommended to take a very wide set of parameters in the initial measurements, although a part of the dataset might be totally useless.
Bibliography
[1] Y. Bellouard. Fabrication of high-aspect ratio, micro-fluidic channels and tunnels using femto-second laser pulses and chemical etching. April 2004.
[2] S. Butkus, D. Paipulas, R. Sirutkaitis, E. Gaizauskas, and V. Sirutkaitis. Rapid cutting and drilling of transparent materials via femtosecond laser filamentation.Journal of Laser and Micro/ Nanoen-gineering, 9(3):215–220, 2014.
[3] G. Erberle, M. Schmidth, F. Pude, and K. Wegener. Laser processing of crystalline aluminium oxide using femtosecond pulses. 2015.
[4] C. Hnatovsky, R. Taylor, E. Simova, P. Rajeev, D. Rayner, V. Bhardwaj, and P. Corkum. Fabrication of microchannels in glass usingfocused femtosecond laser radiation and selective chemical etching.
Applied Physics.A., 84:47–61, February 2006.
[5] M. Kumkar, L. Bauer, S. Russ, M. Wendel, J. Kleiner, D. Grossmann, K. Bergner, and S. Nolte. Comparison of different processes for separation of glass and crystals using ultrashort pulsed lasers. Proc. SPIE, 8972:897214–897214–16, 2014.
[6] Shao-Wei Luo, Tien-Li Chang, and Hung-Yin Tsai. Fabrication of glass micro-prisms using ultra-fast laser pulses with chemical etching process. July 2011.