University of Warwick institutional repository: http://go.warwick.ac.uk/wrap
A Thesis Submitted for the Degree of PhD at the University of Warwick
http://go.warwick.ac.uk/wrap/2757
This thesis is made available online and is protected by original copyright.
Please scroll down to view the document itself.
Genetic Algorithm Optimisation Methods
Applied to the Indoor Optical Wireless
Communications Channel
By
Matthew David Higgins
A thesis submitted in partial fulfilment of the requirements for the degree of Doctor of
Philosophy
School of Engineering
Table of Contents
Table of Contents . . . i
List of Figures . . . v
List of Tables . . . ix
List of Abbreviations . . . xi
List of Algorithms . . . xiii
Acknowledgements . . . xiv
Declaration . . . xv
Abstract . . . xvi
Publications Associated with this Research Work . . . xviii
1 Introduction 1 1.1 Infrared Channel Overview . . . 3
1.2 Modulation Overview . . . 5
1.3 Transmitter and Receiver Overview . . . 7
1.4 Intelligent Systems Overview . . . 13
1.5 Aims and Motivations . . . 15
1.6 Outline of the Thesis . . . 18
2 The Optical Wireless Channel 20 2.1 Introduction . . . 20
2.3 Impulse Response Calculations . . . 28
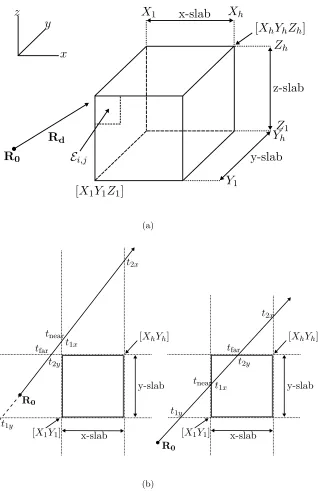
2.4 The Intersection Algorithm . . . 34
2.4.1 Precision Errors . . . 38
2.5 Computational Effort and Error . . . 40
2.6 Testing the Simulator . . . 43
2.6.1 A Comparison with ‘Barry’ . . . 43
2.6.2 Characteristics Over the Entire Room . . . 45
2.6.3 Multi Diffusion Spot Results . . . 47
2.7 Conclusion . . . 56
3 Optimisation of the Channel 57 3.1 Introduction . . . 57
3.2 Channel Scaling Factors . . . 58
3.3 The Genetic Algorithm . . . 61
3.3.1 Representation . . . 61
3.3.2 The Fitness Function . . . 63
3.3.3 Selection . . . 64
3.3.4 Reproduction . . . 66
3.3.5 Mutation . . . 67
3.3.6 Termination and Repeatability . . . 68
3.4 Evaluating the Genetic Algorithm . . . 69
3.5 GA Performance with Varying Receiver FOV . . . 74
3.6 Including the Moving Person . . . 79
3.7 Adding the Exclusion Zone . . . 81
3.8 A Second Room and a Second GA . . . 88
3.9 Conclusion . . . 93
4.1 Introduction . . . 94
4.2 Expanding the Environment . . . 95
4.3 Varying Receiver Orientation . . . 100
4.4 Changing the level of Alignment . . . 107
4.5 Multi User Movement with Random Alignment . . . 114
4.6 Conclusion . . . 121
5 Optimisation of Channel Noise 125 5.1 Introduction . . . 125
5.2 The Noise Model . . . 125
5.2.1 Incandescent Lamps . . . 128
5.2.2 Fluorescent Lamps Driven by Conventional Ballasts . . . 129
5.2.3 Fluorescent Lamps driven by Electronic Ballasts . . . 133
5.3 SNR and BER Model . . . 134
5.3.1 Impulse Response Calculation . . . 135
5.3.2 System Block Diagram . . . 136
5.3.3 Including Interference Noise . . . 139
5.3.4 SNR and BER Equations . . . 139
5.3.5 Including Interference . . . 141
5.4 The Signal and Noise Environment . . . 145
5.5 Initial SNR and BER Distributions Estimates . . . 147
5.6 Starting the SNR Optimisation . . . 152
5.7 A Second Room and a Second Movement Pattern . . . 158
5.8 Conclusion . . . 167
6 Conclusions 168
A Computational Effort and Error Tables. 174
B Complete List of Genetic Algorithms Tested. 179
C Environment and Movement Data. 186
List of Figures
Figure 1.1 Types of multispot diffusion patterns. . . 9
Figure 1.2 Angular diversity receiver examples. . . 10
Figure 2.1 Lambertian and Phong reflection model comparison. . . 26
Figure 2.2 Source, receiver and reflector geometry. . . 29
Figure 2.3 Diagrammatic intersection algorithm. . . 35
Figure 2.4 Computational time and error graphs. . . 42
Figure 2.5 Reproduction of the results published by ‘Barry’. . . 44
Figure 2.6 Component power impulse responses over the entire room. . . 46
Figure 2.7 Impulse response order comparison. . . 47
Figure 2.8 Bandwidth variation with order. . . 48
Figure 2.9 RMS delay spread variation with order. . . 49
Figure 2.10 Multi spot diffusion example distributions forI = 16 and FOVRj = 15 ◦. . 50
Figure 2.11 Multi spot diffusion example distributions forI = 25 and FOVRj = 25 ◦. . 51
Figure 2.12 Multi spot diffusion example distributions forI = 25 and FOVRj = 35 ◦. . 52
Figure 2.13 Varying the number of diffusion spots and the receiver FOV forI = 9. . . 53
Figure 2.14 Varying the number of diffusion spots and the receiver FOV forI = 16. . 54
Figure 2.15 Varying the number of diffusion spots and the receiver FOV forI = 25. . 55
Figure 3.1 Diagrammatic representation of chromosome epistasis. . . 63
Figure 3.2 Comparison of roulette and stochastic uniform sampling. . . 66
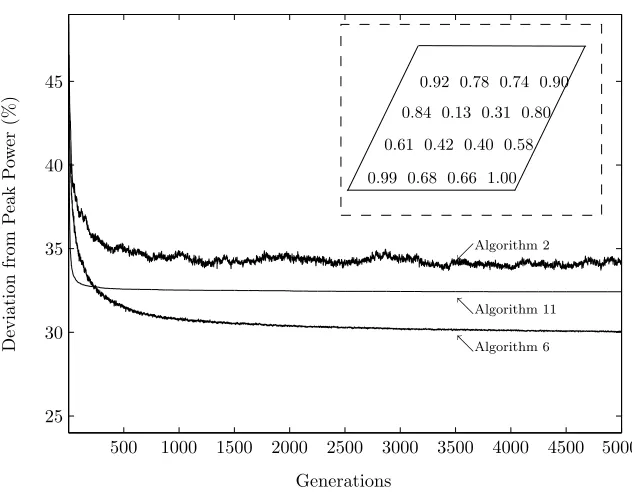
Figure 3.4 Algorithm 6 optimisation of room 1. . . 71
Figure 3.5 Convergence curves for algorithms 2,6 and 11. . . 72
Figure 3.6 GA performance for 9 spots and varying receiver FOV. . . 75
Figure 3.7 GA performance for 16 spots and varying receiver FOV. . . 76
Figure 3.8 GA performance for 25 spots and varying receiver FOV. . . 77
Figure 3.9 Illustrative examples of GA performance for I = 16, FOVRj = 15 ◦. . . . . 78
Figure 3.10 Illustrative examples of GA performance forI = 25, FOVRj = 35 ◦. . . . . 78
Figure 3.11 Illustrative examples of GA performance forI = 25, FOVRj = 55 ◦. . . . . 79
Figure 3.12 Movement Positions of the Person. . . 80
Figure 3.13 Power distribution in two dynamic scenarios. . . 82
Figure 3.14 Receiver to object proximity power distribution disturbance. . . 83
Figure 3.15 Non optimised power distribution for the 9 movement positions. . . 84
Figure 3.16 Optimised power distribution for the 9 movement positions. . . 85
Figure 3.17 Dynamic environment 1, movement pattern 1, FOVRj = 45 ◦,I = 25. . . . 86
Figure 3.18 Dynamic environment 1, movement pattern 1, FOVRj = 55 ◦,I = 25. . . . 87
Figure 3.19 Comparison of algorithms 6 and 11 for room 1, MP 1, FOVRj = 45 ◦. . . . 89
Figure 3.20 Comparison of algorithms 6 and 11 for room1, MP 1, FOVRj = 55 ◦. . . . 90
Figure 3.21 Comparison of algorithms 6 and 11 for room 2, MP 2, FOVRj = 55 ◦. . . . 91
Figure 4.1 Algorithm 6 optimisation of environment 3. . . 96
Figure 4.2 Optimisation of environment 3 with algorithms 6 and 11. . . 97
Figure 4.3 Optimisation of environment 4 with algorithms 6 and 11. . . 98
Figure 4.4 Receiver orientation coordinate system. . . 100
Figure 4.5 Thex and y rotation affecting channel characteristics. . . 103
Figure 4.6 The effect on the channel due to randomly aligned receivers. . . 105
Figure 4.7 The effect of random alignment on two dynamic environments. . . 106
Figure 4.8 Optimisation gain dependency on receiver FOV and orientation. . . 109
Figure 4.10 Optimisation dependency on receiver FOV and orientation. . . 111
Figure 4.11 Optimisation of random receiver alignment using algorithm 6. . . 113
Figure 4.12 Environment 5 movement pattern 1 optimisation. . . 115
Figure 4.13 Environment 6 movement pattern 2 optimisation. . . 116
Figure 4.14 Movement positions of 2 users. . . 118
Figure 4.15 Non optimised power distribution for two moving persons. . . 119
Figure 4.16 Optimised power distribution for two moving persons. . . 120
Figure 4.17 Environment 5 movement pattern 1 and 3 optimisation. . . 122
Figure 4.18 Environment 6 movement pattern 2 and 4 optimisation. . . 123
Figure 5.1 Incandescent noise model parameters. . . 130
Figure 5.2 Fluorescent lamp noise model parameters. . . 131
Figure 5.3 Electronic ballast lamp noise model parameters. . . 132
Figure 5.4 BER calculation modified impulse responses. . . 137
Figure 5.5 OOK block diagram. . . 138
Figure 5.6 BER Vs. SNR for varying ∆A. . . 142
Figure 5.7 BER Vs. SNR with interference. . . 144
Figure 5.8 Non optimised signal environment 3. . . 145
Figure 5.9 Noise environment 3. . . 146
Figure 5.10 Initial SNR estimates. . . 148
Figure 5.11 Initial BER estimates. . . 149
Figure 5.12 Signal source power modification for SNR comparison. . . 150
Figure 5.13 Signal source power modification for BER comparison. . . 151
Figure 5.14 Optimised noisy empty environment 3. . . 154
Figure 5.15 Optimised noisy empty environment 3 BER values. . . 155
Figure 5.16 Comparison of the beta factor under optimisation. . . 157
Figure 5.17 Comparison of Algorithm 6 and 11 for SNR optimisation. . . 158
Figure 5.19 Signal source power modification for SNR comparison. . . 161
Figure 5.20 Signal source power modification for BER comparison. . . 162
Figure 5.21 BER with interference for the two systems. . . 163
Figure 5.22 Power and SNR optimised noisy empty environment 3. . . 164
Figure 5.23 BER optimised noisy empty environment 3. . . 165
Figure 5.24 BER with interference for the two systems. . . 166
List of Tables
Table 3.1 The 12 algorithms for analysis. . . 70
Table 5.1 Average parameter values for incandescent light interference. . . 129
Table 5.2 Typical values for the fluorescent lamp phase parameters. . . 129
Table 5.3 Typical values for high frequency lamp interference. . . 134
Table A.1 First order impulse response computation times. . . 175
Table A.2 First order percentage error analysis. . . 176
Table A.3 Second order impulse response computation times. . . 177
Table A.4 Second order percentage error analysis. . . 177
Table A.5 Second order impulse response computation times. . . 178
Table A.6 Third order percentage analysis. . . 178
Table B.1 GAs based on Roulette selection and a population of 50. . . 180
Table B.2 GAs based on Roulette selection and a population of 100. . . 180
Table B.3 GAs based on Roulette selection and a population of 200. . . 181
Table B.4 GAs based on SUS selection and a population of 50. . . 181
Table B.5 GAs based on SUS selection and a population of 100. . . 182
Table B.6 GAs based on SUS selection and a population of 200. . . 182
Table B.7 GAs based on tournament 2 selection and a population of 50. . . 183
Table B.8 GAs based on tournament 2 selection and a population of 100. . . 183
Table B.9 GAs based on tournament 2 selection and a population of 200. . . 184
Table B.11 GAs based on tournament 3 selection and a population of 100. . . 185
Table B.12 GAs based on tournament 3 selection and a population of 200. . . 185
Table C.1 The properties of each environment used with the work. . . 187
List of Abbreviations
ADR - Angular Diversity Receivers
BER - Bit Error Rate
BPSK - Binary Phase Shift Keying
CMOS - Complementary Metal-Oxide-Semiconductor
CON - Concertina
CPC - Compound Parabolic Concentrator
DTIRC - Dielectric Totally Internally Reflecting Concentrator
DPPM - Differential Pulse Position Modulation
FOV - Field of View
GA - Genetic Algorithm
IM/DD - Intensity Modulation Direct Detection
IrDA - Infrared Data Association
IR - Infrared
ISI - Inter Symbol Interference
LED - Light Emitting Diode
LOS - Line of Sight
LSMS - Line Strip Multispot
LTI - Linear Time Invariant
MRC - Maximal Ratio Combining
NOB/E - Non Optimised Bandwidth when Empty
NOB/M - Non Optimised Bandwidth with Movement
NOrms/E - Non Optimised RMS Delay Spread when Empty
NOrms/M - Non Optimised RMS Delay Spread with Movement
OA - Optical Antenna
OB/E - Optimised Bandwidth when Empty
OB/M - Optimised Bandwidth with Movement
OFDM - Orthogonal Frequency Division Multiplexing
Orms/E - Optimised RMS Delay Spread when Empty
Orms/M - Optimised RMS Delay Spread with Movement
OOK - On Off Keying
OW - Optical Wireless
PPM - Two Pulse Position Modulation
QoS - Quality of Service
RCLED - Resonant Cavity Light Emitting Diode
RF - Radio Frequency
RMS - Root Mean Square
SNR - Signal to Noise Environment
SUS - Stochastic Uniform Sampling
UWB - Ultra Wide Band
VCSEL - Vertical Cavity Surface Emitting Laser
List of Algorithms
Acknowledgements
I would like to thank all those that have helped me to complete this work. First and foremost,
sincere gratitude goes to my supervisors, Prof. Roger J. Green and Dr. Mark S. Leeson, for their
uncompromising support, guidance, constructive suggestions, and valuable time along the way.
It has been a privilege to work with them, and I will always be grateful for the opportunities
they have allowed me to take. I also wish to thank Prof. Nigel G. Stocks for his help in obtaining
me funding during my time at Warwick, and the time he spent listening to my problems during
several years of postgraduate staff student liaison committee meetings.
Special thanks also goes to my parents Lynn and David, and my sister Amy, for their support
during this work. They have always done their best for me, and provided everything I needed.
I also wish to thank my mother- and father-in-law for having faith in me. Last but not least, I
wish to thank my wife, Liang. She was always there for me and she kept me smiling during the
tough times, especially towards the end. She provided all the motivation and reasons I needed
to complete this work and push myself as hard as I did. She made the whole PhD experience a
Declaration
This thesis is submitted in partial fulfilment for the degree of Doctor of Philosophy under the
regulations set out by the Graduate School at the University of Warwick. This thesis is solely
composed of research completed by Matthew David Higgins, except where stated, under the
supervision of Prof. R. J. Green and Dr. M. S. Leeson between the dates of September 2005 and
June 2009. No part of this work has been previously submitted to any institution for admission
to a higher degree.
Matthew David Higgins
Abstract
This thesis details an investigation into the application of genetic algorithms to indoor optical
wireless communication systems. The principle aims are to show how it is possible for a genetic
algorithm to control the received power distribution within multiple dynamic environments, such
that a single receiver design can be employed lowering system costs. This kind of approach is
not typical within the research currently being undertaken, where normally, the emphasis on
system performance has always been linked with improvements to the receiver design.
Within this thesis, a custom built simulator has been developed with the ability to determine
the channel characteristics at all locations with the system deployment environment, for
mul-tiple configurations including user movement and user alignment variability. Based on these
results an investigation began into the structure of the genetic algorithm, testing 192 different
ones in total. After evaluation of each one of the algorithms and their performance merits, 2
genetic algorithms remained and are proposed for use. These 2 algorithms were shown capable
of reducing the receiver power deviation by up to 26%, and forming, whilst the user perturbs the
channel, through movement and variable alignment, a consistent power distribution to within
12% of the optimised case.
The final part of the work, extends the use of the genetic algorithm to not only try to
opti-mise the received power deviation, but also the received signal to noise ratio deviation. It was
Publications Associated with this
Research Work
The following journal and conference papers have been published as a result of the work
con-tained within this thesis. They have not been referenced throughout, but form the general
foundation for what is presented herein.
Journal Papers
M. D. Higgins, R. J. Green, and M. S. Leeson, “Receiver alignment dependence of a GA
con-trolled optical wireless transmitter,” Journal of Optics A: Pure and Applied Optics, vol. 11,
no. 7, p. 075403, 2009.
M. D. Higgins, R. J. Green, and M. S. Leeson, “A genetic algorithm method for optical wireless
channel control,”IEEE J. Lightwave Tech., vol. 27, no. 6, pp. 760–772, 2009.
R. J. Green, H. Joshi, M. D. Higgins, and M. S. Leeson, “Recent developments in indoor optical
Conference Papers
R. Green, M. Higgins, H. Joshi, and M. Leeson, “Bandwidth extension for optical wireless
receiver-amplifiers,” in10th
Anniversary International Conference on International Transparent
Optical Networks, ICTON 2008., Athens, Greece, vol. 4, pp. 201–204, 22-26 June 2008.
M. S. Leeson, R. J. Green, and M. D. Higgins, “Photoparametric amplifier frequency converters,”
in 10th
Anniversary International Conference on International Transparent Optical Networks,
ICTON 2008., Athens, Greece, vol. 4, pp. 197–200, 22-26 June 2008.
M. D. Higgins, R. J. Green, and M. S. Leeson, “Genetic algorithm channel control for indoor
op-tical wireless communications,” in 10th
Anniversary International Conference on International
Transparent Optical Networks, ICTON 2008., Athens, Greece, vol. 4, pp. 189–192, 22-26 June
Chapter 1
Introduction
Indoor optical wireless (OW) communication systems using an infrared (IR) carrier is an
in-teresting technology that combines the high bandwidth availability of communications in the
optical domain, with the traits of mobility, found in the more traditional radio frequency (RF)
wireless communications systems. Compared to an RF system, OW offers the advantageous
opportunity for high speed medium to short range communications operating within a
virtu-ally unlimited and unregulated bandwidth spectrum using lower cost components. Furthermore
OW systems are capable of secure deployment with immunity to adjacent communication cell
interference due to the inability for the signal radiation to penetrate opaque barriers such as
walls. Topologically speaking, the IR radiation can be reflected off the walls, as in a diffuse
system, providing user movement flexibility at the expense of multipath distortion, but immune
to multipath fading, or it can undergo a direct line of sight (LOS) path, resulting in higher data
rates and lower power consumption [1].
The technology is not without it drawbacks compared to RF techniques, such as the requirement
for a base station to be situated within every room, and the susceptibility of the signal to the
intense ambient background light from the sun, incandescent and fluorescent lights. However,
whereby a fully diffuse system was formed transmitting at only 125 kbit s−1, was not short lived.
By 1985, OW system performance ranged from low power LOS systems operating at 19.2 kbit s−1
to higher power ones operating at a 1 Mbit s−1 milestone [4, 5, 6, 7]. By 1990 the LOS systems
had reached their next milestone of 50 Mbit s−1 [8, 9, 10], which by 1994 the same bit rate
could be extended to mobile diffuse systems of up to 155 Mbit s−1 when operated in LOS mode
[11, 12, 13].
Since then, the techniques and applied applications found within OW communications have
become more advanced and more interesting. Conceptions such as multispot diffusion (MSD),
angular diversity and rate adaptive modulation schemes, are relevant to the work here and so
will be discussed shortly. Furthermore, the conventional RF community has now accepted that
optical wireless is part of the electromagnetic communication spectrum, at least, in part, thanks
to a Wireless World Research Forum White Paper [14] and the continual work of the commercial
entity, the Infrared Data Association (IrDA) [15]. OW communications is, however, not alone
in the market place, and although it can be considered as a complementary technology with
conventional RF techniques, RF communications has also improved in recent years with
com-petition from newer systems employing ZigBee, Bluetooth, WiFi and ultrawideband (UWB) to
name but a few [16, 17, 18, 19], and as such work must still continue in advancing OW
commu-nications to the limit.
In this chapter an up to date review of OW communications will be presented. To begin with,
the relevant fundamentals of channel theory will be covered providing an insight into the
de-sign challenges involved in deploying high performance systems. This is followed by a section
on modulation theory, in which, the key performance metrics of modulation schemes will be
evaluated with reference to recent developments. The chapter then goes onto providing a
re-view of recent developments in OW transmitter and receiver design with specific focus on the
OW applications is then provided, which as will seen, the number of applications is very few in
number, leading to a section on the aims and motivations of the work presented here. Finally a
outline of the structure is presented outlining the order of work as it was completed.
1.1
Infrared Channel Overview
In virtually all short range, indoor applications intensity modulation direct detection (IM/DD),
is the only practical transmission technique [20]. Here, an infrared emission capable device
emits and instantaneous optical power X(t), propagating through the channel and incident
upon the receiver’s optical detector. The received signal Y(t), is then the integration of the
detected optical power over the area of the detectors surface, multiplied by the photodetectors
responsivity R [21]. Typically the photo detectors used in a receiver have large areas of the
order 106−108 square wavelengths, resulting in optically incoherent reception without multipath
fading [22]. The channel can be modelled as baseband linear time invariant (LTI), with impulse
responseh(t), that only changes significantly when the source, receiver or reflectors are moved
by distances in the order of centimetres. For nearly all indoor applications the transmission is
operated in the presence of intense infrared and visible background radiation, N(t), that can
be modelled as additive white Gaussian, independent ofX(t), and as such a simplified channel
model for the IM/DD link is given by [23]
Y(t) =RX(t)∗h(t) +N(t) (1.1)
Where ∗ denotes the convolution operation. Through necessity, as X(t) represents power, it
cannot be negative, and average optical power,Pav, is proportional to the time integral of X(t)
[24]
Pav = lim T→∞
Z T
−T
X(t)dt for X(t)≥0 (1.2)
rather than the usual |X(t)|2, which is appropriate when X(t) represents amplitude. In the
challenge to produce a high SNR at useful data rates, since the optical average transmission
power needs to be higher compared to the electrical domain.
The reason achieving a high SNR is a challenge under these constraints is that the average
transmitted power cannot exceed predefined eye safety limits set by IEC 60825 regulations [25].
Further to this the optical channel path loss is given by
H(0) =
Z ∞
−∞
h(t)dt (1.3)
such that the received power is given by
Prec =H(0)Pav (W) (1.4)
Therefore, not only are the eye safety regulation limiting, but also, the specific impulse response
between a given source and receiver, inherent factors in obtaining a suitable SNR at the receiver.
The actual impulse response itself is the final channel challenge for an OW system designer.
The impulse response, h(t) is unique to a given source and receiver configuration within the
environment they are deployed within. This means the position and orientation of the source
and transmitter, along with source properties such as radiation emission pattern, and receiver
properties such as field of view (FOV) and active collection area, are factors of h(t). Coupling
these with the dimensions of the environment and any object enclosed, along with their
respec-tive reflectivity coefficients, an essentially infinite number of possible impulse responses exist.
Furthermore the impulse response not only dictates the path loss but also the degree to which
inter symbol interference (ISI) will affect the transmitted signal as it is reflected around the
1.2
Modulation Overview
The modulation procedure employed in IM/DD systems may be carried out in two stages. The
first is an optional modulation of a carrier frequency by the data signal, and the second is the
modulation of the emitted infrared light. Low frequency components close to DC should be
avoided for data transmission, as the receiver is dominated by shot noise generated by ambient
light. The quality of a modulation code is dictated by the reliability of transmission [29, 30],
the bandwidth efficiency [31, 32] and the power efficiency that it offers under typical noise and
multipath conditions in the optical wireless channel [33].
Considering firstly how reliable a modulation scheme is, a good technique should adapt the
signal to the OW channel in such a way as to allow reception and consequent demodulation at
the receiver end within the limit of the acceptable bit error rate (BER). Specifically a reliable
modulation scheme will be able to deal with ISI and variations in the data signal DC content.
Additionally, the modulation scheme should be resistant to modulation independent effects of
the channel such as phase jitter from the signal power variation, pulse extension from reflected
signal paths and pulse distortion from the near-field signal clipping. A second measure of a
good modulation scheme is the bandwidth efficiency, defined as the ratio of achievable bit rate
to bandwidth. The higher the bandwidth efficiency of a scheme, the higher the data rate will
be in a given environment and for many indoor environments, where bandwidth the limiting
factor, it is of great importance to utilise efficiently. Finally, power efficiency, defined as the
ratio of energy per optical pulse to mean energy required per bit, is the last empirical test of
a modulation scheme. Due to eye safety limits, power efficiency must be maximised, however
typically one cannot be increased without lowering the other as the duty cycle of the modulated
waveform is the ratio of bandwidth efficiency and power efficiency [34].
A detailed comparative analysis of several binary modulation schemes is provided in [35]. Here
(2-PPM), and subcarrier binary phase-shift keying (BPSK) is presented. It is shown that the
power efficiency of OOK and 2-PPM are the same, whereas, for BPSK, the power efficiency is
3 dB less due to BPSK consisting of half the transmit pulse energy. The bandwidth
require-ments of 2-PPM and BPSK are the same, being twice that is needed for OOK. Thus, at lower
data rates, OOK emerges as the most suitable modulation scheme amongst binary modulation
schemes. At higher data rates, 10 Mbit s−1, it suffers from a large power penalty resultant of
multipath dispersion [36].
The earlier generation of OW systems described earlier, were predominantly based upon binary
modulation, however in recent years several new schemes have been developed that may be of
interest to the work presented here. Differential PPM (DPPM) is a simple modification of PPM
that can achieve improved power and/or bandwidth efficiency, and is superior to PPM in optical
multiple-access applications. A DPPM symbol is obtained from the corresponding PPM symbol
by deleting all of the ‘off’ chips following the ‘on’ chip and furthermore, DPPM detection does
not require symbol synchronisation, reducing receiver complexity, that was necessary in the case
of utilising PPM. It was shown in [37, 38] that, for a given bandwidth, DPPM requires less
power than PPM. For only slightly more bandwidth, 16-DPPM provides a 3 dB power gain over
4-PPM. For a 1.4 dB power penalty, 16-DPPM also produces the same bit rate as 16-PPM, but
uses less than half the bandwidth. Alternatively, using a scheme based upon Trellis coding,
whereby the modulation is designed to minimise the Euclidean distance between allowed signal
sequences, the OW multipath dispersion penalties have been mitigated [22, 39].
Although the optical wireless channel can support high bit rate transmission, it is not possible
to constantly maintain the SNR to support this because of the changes in the impulse response,
the subsequently change the path loss between source and receiver, along with possible abrupt
changes in ambient light conditions. It is however, possible and, more important, to reduce the
loosing the data link entirely. There are several rate adaptive modulation schemes that have
been developed recently, and that are of interest to this work. In [40] a scheme is shown based
on the use of variable silence periods and OOK formats with memory. Here the variable silence
periods are used to modify the statistics of the amplitude sequence related to the message
se-quence, providing an increase in the peak to average optical power ratio. The scheme provides
a wide ranging data rate, but advantageously, results in reduced implementation complexity,
compared with a scheme based upon repetition coding specified by the IrDA standard [41].
Another recently developed idea is the use of the frequency domain method of adaptively
mul-tiplexing orthogonal sub-carriers [42]. This technique is analogous to adaptive orthogonal
fre-quency division multiplexing (OFDM) in the RF domain. Here the system dynamically adjusts
the transmission rate to the OW channel conditions by assigning suitable modulation formates
to individual sub-carriers, thus fully utilising the channel capacity. The rate adaptation if
main-tained even under a worst case scenario by using the lowest sub-carriers over a low rate link,
thus maintaining a minimum QoS. The lowest rate carriers are chosen to be those suitable for
transmission under extreme conditions, such as the low complexity modulation formats, OOK
or PPM. The data rate is chosen on a carrier by carrier basis, and, therefore the system is able
to adapt to a wide range of channel conditions.
1.3
Transmitter and Receiver Overview
As with any mobile communication system, the objective is to provide the user with a high
de-gree of movement, coupled with a high data rate. In addition to modulation aspects, transmitter
and receiver design are also important factors in system performance. The design techniques
employed to realise them should take into account the configuration of the system.
path loss from the multiple reflections incurred between the source and the receiver, limiting
the rate of modulation that can be achieved [43]. The low level of optical power often present
at the receiver makes the utilisation of optical concentrators to maximise light collection
ben-eficial [44, 45]. However, the high level of ambient light present results in shot noise over the
entire FOV of the optical concentrator plus detector combination. This can be ameliorated
by optical and electrical filtering [46]. The LOS channel offers higher speed due to lower path
loss, but requires a high degree of alignment, which cannot be blocked, limiting user mobility.
Photogenerated noise can also be reduced due to the narrower FOV employed in the optical
front end of the receiver. A more modern approach described in recent literature, is the
quasi-diffuse, or tracked system, employing a multibeam transmitter and an angular diversity receiver.
The purpose of the quasi diffuse transmitter is to create multiple narrow beams targeted in
dif-ferent directions. By using such beams, the system requires lower transmitter power, has a lower
path loss and reduced multipath dispersion, in comparison with single wide-angle transmitters,
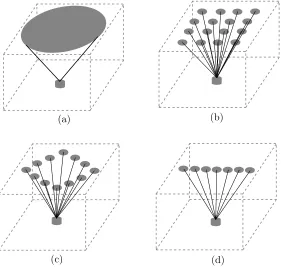
but the user still has freedom of movement [47]. Figure 1.1 shows some of the possible multispot
diffusion patterns that can be achieved using quasi diffuse transmitters, including a novel line
strip multispot system (LSMS) [48].
Multispot diffusion can be achieved by implementing arrays of illuminating elements, coupled to
conventional lenses or computer generated holograms [49, 50, 51]. It is also possible to target the
narrow fields towards a reflective surface, such as the ceiling as in Figure 1.1, or provide many
di-rect LOS links from a base station situated on the ceiling, projecting down onto the receiver [52].
Angular diversity receivers (ADRs) utilise an array of narrow FOV receiving elements that are
pointed in different directions and/or have different spatial locations, combining to create a
wide-angle receiver. Each element has its own amplifier circuitry, and the system may employ
(a) (b)
[image:31.595.160.441.140.407.2](c) (d)
Figure 1.1: Types of multispot diffusion patterns. (a) Conventional diffuse transmitter. (b)
Uniform multispot diffusion. (c) Diamond multispot diffusion. (d) LSMS diffusion.
some inputs, or power saving by deactivating those elements receiving only noise. Multipath
dispersion effects can also be mitigated by rejecting elements that receive weak signals from
reflections if a LOS link is present. Another advantage is that each element with a narrow
FOV is smaller than a single element with a wide FOV, so the capacitance of each detector is
smaller, thus increasing the bandwidth of the receiver. The disadvantage of using ADRs is the
added complexity of the receiver, which has to incorporate multiple detectors, each with its own
amplifier and an overall processor.
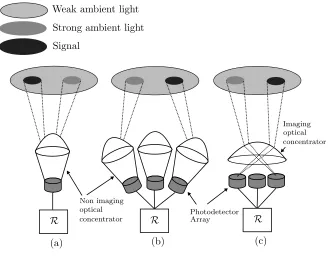
The ADR can be either imaging or non-imaging, as shown in Figure 1.2. The former employs
photode-R R R
Weak ambient light Strong ambient light Signal
(a) (b) (c)
Non imaging
optical
optical
concentrator
concentrator
Imaging
[image:32.595.145.473.129.388.2]Photodetector Array
Figure 1.2: Angular diversity receiver examples. (a) Single element receiver. (b) Angular
diversity receiver (non imaging). (c) Angular diversity receiver (imaging).
tector array, thus sending the light that arrives from different directions to different detectors.
The latter couples each element to a non-imaging optical concentrator with a filter, and the
re-ceiver can then determine from where the light arrived via knowledge of the rere-ceiver orientation
and the FOV attained by each element/concentrator.
A number of non-imaging concentrators have been proposed in the past, two of the most-popular
being the hemispherical (truncated spherical) dielectric concentrator [53, 54, 55], and the
ro-tationally symmetric compound parabolic concentrator (CPC) [56, 57]. Hemispherical
concen-trators achieve a high FOV and gain, provided the hemisphere radius is large compared to the
detector [58], and an optical filter can be placed between the concentrator and the detector or on
the surface of the hemisphere. While the filter placed on the surface of the hemisphere provides
[1]. CPCs on the other hand, can be designed for any FOV, and utilise thin film planar optical
filters which are easier to fabricate and tune to a desired central wavelength in the bandpass
region. Due to the fact the FOV can be controlled, a higher optical gain can be achieved along
with rejecting more background illumination. Recently another alternative has been presented
in the form of a three dimensional dielectric totally internally reflecting concentrator (DTIRC),
or optical antenna (OA), which also uses a planar optical filter between the concentrator and
the detector, but, unlike the CPC, it can have a variety of entrance aperture shapes, giving it a
smaller size and the ability for higher optical gain compared to the traditional CPC [44].
Imaging ADRs offer two advantages. Firstly, the bulk size of the receiver is reduced, as only one
imaging optical concentrator is needed for the whole device. Secondly, the photodiode array is
flat and may be fabricated into a highly scalable integrated circuit, offering high pixel density
[59].
As stated above, the ADRs requires signal processing to determine which pixels should be used.
In [60], a system using multiple narrow beam transmitters and multiple narrow FOV receivers,
transmitting at 70 Mbit s−1 over a range of 4.2 m using OOK with a BER of 10−9 compared the
effectiveness of different signal combining schemes. Maximal Ratio Combining (MRC), which
performs a weighted sum based on the signal amplitude to noise power spectral densities, and
low pass filtering with a cut off point appropriate to the modulation speed, emerged as the most
effective signal-combining scheme.
To quantify the effectiveness of using a quasi-diffuse system, Kahn et al. [59] compared an
imaging ADR system transmitting at 30 Mbit s−1 using OOK modulation targeting a BER of
10−9, with a conventional wide FOV single element receiver. It was found that, when
consid-ering LOS links from a wide angle transmitter, the use of a 7 pixel imaging receiver required
if the number of pixels was increased to over 1000, then a 13 dB transmitter power reduction
was achieved. The work also compared MRC with simply selecting the pixel with the highest
SNR, and demonstrated that MRC required slightly less power. Moreover, if the wide angle LOS
transmitter was replaced by a multi-spot transmitter, creating a diffuse signal on the ceiling this
particular configuration required up to 7 dB less transmitted power. Employing the multi-pixel
ADR arrangement led to gains of up to 12 dB for greater than 1000 pixels.
In [61], the development of a combined directed, for high speed, and diffuse link, for
connectiv-ity, system was demonstrated. In this approach, the diffuse link was provided by a high power
laser directed at a diffusely radiating surface, and the directed link was implemented with a
vertical cavity surface emitting laser (VCSEL) diode array with focusing lens. The imaging
ADR in this work, [61], utilised an array of avalanche photodiodes to take advantage of their
higher sensitivity because ambient-related shot noise has less effect on diversity receivers. A
microcontroller in the ADR allowed all the pixels to be active if no LOS link was present, or
selectively activate individual pixels when a LOS transmission was found. To obtain error-free
data transmission between the transmitter and receiver at 1.8 m, 400 mW of power was required
by the diffuse laser transmitter, whilst only 0.35 mW was required by the LOS directed laser
diode transmitter. The final system capability demonstrated was 155 Mbit s−1 over a range of
2 m, using a 233 MHz phase shift key subcarrier.
The first fully integrated diversity system was presented in [62] using custom electronics, over
commercially available components, to obtain improved performance. The transmitter consisted
of an array of resonant cavity light emitting diodes (LED’s) flip-chip bonded to complementary
metal-oxide-semiconductor (CMOS) driver circuitry and integrated with the transmitter optics.
A wavelength of 980 nm was employed because current devices at other wavelengths are not
ad-vanced enough for the level of integration intended. This however, restricted transmitter power
bonded to custom CMOS circuitry. The use of integrated circuitry offers good scalability, and
employing CMOS permits custom fabrication of low-cost, highly-functional devices [52]. The
aim of the project was to reach 155 Mbit s−1 over 2−3m, and, to date [63], the system has
reached 100 Mbit s−1.
Finally, a novel form of imaging receiver was presented in [64]. This consisted of a single
pho-todetector, placed on a miniaturised positioning mechanism that allowed it to move under the
focal plane of the imaging lens. Advantage was taken of the slow variation in the signal position
occurring in mobile systems, which permitted searching for the best SNR via a simple search
algorithm in real time. The system has similar benefits to the others described, in that ambient
light is rejected and power can be saved at the transmitter by reducing path loss through LOS
transmission. One drawback shown in the paper was that when the signal link was completely
blocked, the system had to search again for a connection. The project, albeit in the simulation
stage, was aimed at portable equipment applications as the receiver complexity was low, yet still
it was able to maintain the advantages of diversity receivers over those using a single wide-angle
receiver. The initial published simulation results predicted a 50% power saving at the
transmit-ter by using the single channel imaging receiver, compared to a similar angle diversity receiver,
whilst also increasing the available channel bandwidth.
1.4
Intelligent Systems Overview
Although the use of intelligent techniques have found numerous applications within
telecommu-nications, from fibre systems [65, 66, 67] to free space optics [68], to the countless number already
employed in RF applications such as antenna design and receiver array control [69, 70, 71, 72],
there has been very little application off the techniques to optical wireless communications.
annealing [74], the multispot diffusion pattern generated by holographic diffusers. In this work
the simulated annealing method was employed to find the design of the holographic diffuser
required to produce either a low power deviation, lower multipath dispersion, or a combination
of both. By changing the holographic diffuser design, they quote improvements of up to an 85%,
in reduction of the standard deviation of the received power throughout the room, when coupled
with a receiver with a 30◦ FOV. The work also covers the application in a second environment
with lesser improvements. The work was later extended [75] to include the use of a genetic
algorithm (GA), and a modified GA that incorporates elements of the simulated annealing
pro-cess. However upon comparison of their results, they concluded the GA was not satisfactory
as an optimiser, and very few results were published. Furthermore, they concluded that the
GAs ability to optimise the effects of multipath dispersion was also limited, concluding this is a
physical factor that needs to be mitigated with more advanced receiver techniques.
In [76] a complex system was demonstrated that makes great improvements in overcoming the
channel induced multipath distortion resulting from the multiple reflections around the diffuse
environment. By sending the received signal through a feature extraction algorithm based upon
wavelet analysis, an artificial neural network pattern recognition post processor is employed to
rebuild the original signal. The results were successful in that, for the system to run at a BER of
10−5, required 2 dB, 8 dB and 17 dB, less SNR than systems with maximum likelihood detection,
filtered or unfiltered receivers respectively. The results shown, although conducted within a fully
diffuse environment, only accounted for one source receiver configuration.
In [77, 78], a fuzzy logic based handover decision algorithm was developed for use in systems
where OW and RF networks coexist. In these types of networks, handover from one system to
another is a problem due to different interruption schemes and traffic modes. The strength of
the fuzzy logic approach to uncertainties and conflicting decision metrics, gives the handover
aspects to this work is that the authors highlighted the dynamics of the mobile channel. Each
handover decision is different, and previous structured algorithms are only effective under
cer-tain conditions, making their approach very beneficial.
1.5
Aims and Motivations
Indoor optical wireless is, inherently, a cellular system [79, 80]. Each room, or section of a room,
will have within it a base station linked to the backbone network [81]. It can also be assumed
that every environment that a base station resides within , will be different. The advantages of
OW such as high speed communications may be beneficial to scenarios in the workplace, but
each workplace will have a different topology of furniture and seating arrangements. The low
cost appeal of OW will allow systems to be deployed in residential environments, where, for
example in living rooms and bedrooms, the type of furnishing and flooring is also unique. The
immunity to RF interference may appeal to heavy industrial users, where there is no furniture
but sparsely open plan factories or warehouses with reflective surfaces, such as concrete and steel
for example, that are not normally found elsewhere. From a channel perspective, it is therefore
reasonable to assume that no two environments are identical.
This argument can be carried through to the channel noise sources. The typical lighting found
in office environments, although possibly similar from office to office, is certainly different to the
ones found in residences. Some offices have many windows, whilst some do not, making sunlight
different in each location. Industrial applications may be purely illuminated with artificial light.
These channel variability challenges are enough on their own if one considers the environment
to be static. Realistically, this cannot be assumed, as OW systems are about connecting users
in a flexible way. Even if the users moved slowly, or assumptions were made about their typical
behaviours, the channel can still change with simple actions like rearranging the furniture or
Furthermore, it needs to be assumed that there are multiple end users within each unique
envi-ronment. Each of these users has upon them a battery powered portable device such a mobile
phone or laptop. Historically, with work from standards bodies such as the IrDA, each of the
devices is most likely very similar, or conform to some minimum technical specification of
op-erational requirement. Furthermore, from a marketing point of view, the standards agencies or
the parties with financial interest in the devices, try and make them as cheap as possible, and
attempt to put them in as many devices as possible.
This leads to somewhat challenging system design requirements, of how to make a single, mass
producible and cheap receiver design operate in an infinite number of channel scenarios, whilst
still being able to market the device as user friendly. The system element not mentioned so
far, is that of the transmitter. The transmitter stands alone as something that can be flexibly
designed. The transmitter should be cost effective, or good value of money, but it does not
have to be disposably cheap as with the receiver. The transmitter should be power efficient,
but not necessarily low power, as it is connected to the backbone network, so potentially near a
power plug. Finally the transmitter should be unobtrusive, but does not have to be small. The
transmitter, is therefore one possible avenue of research that could lead to a solution to this
system design challenge.
In the case of all the aforementioned receiver techniques proposed, each one has their respective
merits in mitigating certain channel factors such as bandwidth or received power limitations.
However, given the cellular nature of OW, one has to weigh the added complexity, cost and
physical size of each receiver within the cell against the benefits they entail. There is an
argu-ment with economies of scale, such that the larger the uptake, the lower the cost of each unit.
The argument, however can also be debated the other way, if one considers that the cost and
receivers present in a cell, than by the single base station.
The aim of this work, is to prove, in principle, the conceptual idea, that a genetic algorithm
ap-proach, can be used to optimise several OW channel characteristics. It is intended to show that
the channel can be itself, designed, accounting for environmental and user movement induced
channel variability. Much of the motivation for this work comes from a personal experience in
receiver design, whereby it was never known how much power or bandwidth to expect from the
channel, for each application at hand, such that, the choice of appropriate receiver design or
topology to implement and develop, was always a difficult decision. The work will in general,
focus purely on the algorithm and the effects of its use on the channel. A small amount of
re-ceiver analysis is performed, but only to the extent of physical parameters that affect the channel
response such as FOV. It is not the intent of this work to develop a bespoke system with the
highest bit rate, SNR or focus exclusively on some other system performance characteristic, but
rather, assume as wide a range of variables as possible, proving the method has a high degree
of flexibility.
To the best of the author’s knowledge, GAs have not been applied in this way, with this focus,
on indoor optical wireless communication systems, and it will be shown that their use will bring
benefits to the research area. It should also be stated that the method and results presented
here are not mutually exclusive, baring the one exception of computer generated holograms,
with other research ideas currently being undertaken elsewhere, and this work is not shown to
be a solution, but be part of the solution. It is hoped that the benefits of this work, are taken
further by others, particularly the receiver designers who may be able to match an algorithm
of their own, with their complementary receiver designs, potentially fulfilling the system design
requirements. Furthermore, like any new idea, there are traoffs, and they will be fully
de-tailed. Emphasis will also be placed on critical self analysis of the results and on the validity
1.6
Outline of the Thesis
The work in this thesis is outlined in the following chapters. Each chapter has its own objects
and conclusions that will be highlighted at their respective beginning and ends. Chapter 2
provides a detailed channel model for an indoor optical wireless communication channel. This
chapter is vital for the analysis within the rest of the thesis, providing all fundamental equations
and explanation of the channel’s performance characteristics. Within the chapter, a purpose
built channel simulator is designed, that forms the platform for all results, which to prove their
validity, is characterised in terms of accuracy and computational effort. The simulation
plat-form also includes a purpose built object intersection algorithm, required for simulating user
movement. Within this chapter, the first provisional analysis is conducted within the channel,
illustrating, in a quantive fashion, the problems the system designer is facing.
Chapter 3, contains the theory required in understanding how the received power at a given
lo-cation within the environment can be modified. It details how, by knowing the impulse response
between a source and receiver, the GA is able to control it. Some simplifications to the model
are then presented with a strong justification. This is followed by a theoretical introduction to
the GA, covering all aspects needed for the work, before beginning the GA development. Once
the GA framework has been established, provisional results are shown before a thorough analysis
of the effectiveness of the GA with different receiver characteristics. At this point a generalised
receiver is formed, for evaluation of the algorithms effectiveness in handling user movement in
multiple environments.
Chapter 4, begins with the next stage of user induced channel perturbation analysis, in
quanti-fying the effect of dynamic receiver orientation. The GA is then subjected to the perturbation,
ran-domly aligning the receiver, but also moving in a further two environments. This chapter further
contains results of the GA effectiveness at reducing received power deviation around a further
two environments when there are multiple users moving. These tests were the toughest given
the GA, and possibly the scenarios that show the highest level of realism to the scenarios.
Chapter 5, moves on from attempts to reduce the deviation in received power, to reducing the
de-viation in the received signal to noise ratio. The received noise power is different in each location
of the room, similar to the signal power, and as such the SNR is not uniform. It also affects the
BER of a system. The work in this chapter is very slightly different as reducing the deviation in
peak received power, when coupled with the change in received noise power, the change to SNR
is not predictable. The GA is modified here with a new fitness function that accounts for SNR.
In this chapter a detailed noise model is also presented that allows the SNR to be transposed to
BER, which unfortunately as will be shown is not as suitable for the GA to optimise as required.
Chapter 6, then concludes the work, with a note to further work that may be suitable for
in-vestigation given the results that are presented here. At the end of the chapters are several
appendices, listing detailed tables of results of computational time and error results, a complete
list of every GA algorithmic permutation tested, with results in the algorithm test room, and a
Chapter 2
The Optical Wireless Channel
2.1
Introduction
For a system designer a detailed knowledge of the channel is vital for the effective development
and optimisation of the major components within the system such as transmitter, receiver and
the modulation scheme. In this chapter a channel model is proposed with a detailed discussion
and justification to the choice of simulation method, reflection model, accuracy or error levels
and the model constraints and assumptions presumed. The design of the simulator is essential
for the work presented within the thesis, and, as such, the research emphasis is placed upon
development of this flexible platform. It is necessary to be able to determine the channel’s
impulse response for a wide range of scenarios, including those with user movement, and so a
custom ray object intersection algorithm is also proposed. Research emphasis will also need to
be placed upon computational efficiency, and the mathematical and algorithmic optimisations
that need to be accounted for are discussed because, without them, the future work could not be
completed. Furthermore, there is one more capability that is required from the simulator that
will be discussed further in chapter 3, in that the model must allow for dynamically variable
Due to the importance of determining the channel impulse response, a variety of methods have
been previously proposed, each with a respective set of objectives, advantages and
disadvan-tages [82]. Closed form approximations [3], which provides the possibility to simply investigate
basic configurations and conduct simple analysis on factors such as material reflectivity and the
source intensity profile, are too complex when considering multiple reflections. Experimental
characterisation [83, 84, 85], is an expensive and lengthy task that has to be done on a channel
by channel basis [86].
A general simulation method, first proposed by Barry [87], using some techniques borrowed from
the ray tracing community [88], provided the ability, with relative ease of implementation, to
determine the impulse response for a system where the signal underwent any number of
reflec-tions for any configuration of source and receiver inside an arbitrary empty rectangular room.
However, due to the algorithm being recursive, the computational time is exponential, and the
memory requirements were impractical beyond three reflections. A solution to overcoming the
memory requirements, with a slight improvement in computation time, was proposed by L´
opez-Hern´andez in [89], using a method of dividing the simulation into time, as opposed to reflections.
A further refinement came from Carruthers [90, 91] when the algorithm was applied iteratively
allowing for the computational time to be proportional to the square of the number reflections
required. The method also allowed the possibility of simulating scenarios with multiple
trans-mitters and receivers without considerable time penalties.
An alternative simulation approach, based on a statistical model, was proposed by P´erez-Jim´enez
[92]. In this method the root mean square (RMS) delay spread, and mean excess delay are
es-timated, based purely upon the known geometric factors of the system configuration such as
transmitter and receiver positions and orientation. The values are then compared against an
initial impulse responseh(t) and either a Rayleigh or Gamma function, adjusting theh(t) until
How-ever, no computational times were provided and the requirement for an initial impulse response
makes this approach hard to justify for use. Moreover the authors presented shortly afterwards
a new method based upon a mixed deterministic Monte Carlo ray tracing algorithm [93, 94, 95].
By sending out rays from the source in a pseudo random nature and literally tracing the rays
through the reflections, the room does not need to be partitioned into elements, as was the case
with the Barry method, thus the level of accuracy is determined not by the spacial
segmenta-tion, but by the choice in the number of rays. The authors still base their impulse response
calculations on the original Barry formulations, but the use of rays allows the unnecessary
cal-culations from rays that would never be incident upon the receiver to be omitted. The method
presented is potentially beneficial in terms of computational time, albeit through the choice of
reduction in the number of rays, and would be convenient to implement on vectorised graphics
processors. However, as the rays are generated statistically, each run of the simulation provided
different results, and it has been shown that simulation of the same system configuration 100
times provides a relative error of between 5% and 20% between each run [96].
Finally there is one other statistically based simulation technique that was presented in [97, 98],
called “random walk”. Here a ray is generated with a pseudo random direction and traced
around the environment, determining on its path, if and when, it hits a surface. If it hits a
surface it is reflected with a new path in a pseudo random direction. This process is continued
until, eventually it reaches the receiver. The method has shown merit for the problems involving
integrating sphere diffusers that are inherently small (5-100cm) and spherical reflective
environ-ments. However, for larger, non spherical environments, such as the work presented here, the
channel model simulation technique is not readily applicable.
After discussing the system model in section 2.2, the modified impulse response calculations,
although largely based upon the work by Barry, will be presented in section 2.3. Section 2.4
precision errors found in simulation. Section 2.5 provides justification for the model
assump-tions implemented with an error analysis. Section 2.6 provides results that verify the simulator
against known results and an analysis of the effects on the number of reflections, number of
diffusion spots and the FOV of the receivers with regards to received power levels, bandwidth
and RMS delay spread.
2.2
System Model
The system deployment environment is considered to be an arbitrary indoor rectangular room
of width, Xe, depth, Ye, and height, Ze, such as an office, lecture theatre or living room. The
boundaries of the environment, defined to be the floor, ceiling and walls, enclose a transmitter
capable of firstly forming a diffusion spot geometry upon the ceiling, and secondly, that each
spot intensity can be dynamically and independently controlled.
The three most common techniques for producing the diffusion spots are to use either a
holo-graphic diffuser [99, 100, 101], multiple light sources [102, 103, 104], such as white LEDs
[105, 106, 107], or a 2-D VCSEL or resonant cavity LED (RCLED) [108, 52], array.
Holographic diffusers employ computer-generated holograms, designed to diffuse the emitted
radiation from a single Laser source. The intensity and/or distribution of the spot geometry,
such as uniform, diamond or line-strip [109], can be easily defined, and the resultant projected
spots will be reflected according to the material properties of the ceiling. However, to the best
of the author’s knowledge, holographic diffusers are unable to control the power of each
indi-vidual projected spot dynamically and, as such, will not be considered any further as a viable
transmitter option.
room, and whilst it is possible to control the distribution of emitted radiation from each source
through the use of lenses or other diffuser techniques [98, 110], traditionally the optical source is
an LED, which emits radiation with a generalised Lambertian radiation intensity pattern [21].
Dynamic control of an individual spot is also possible, as each source can be considered
inde-pendent. The installation of multiple optical sources may seem ‘bespoke’, but the use of white
LED which not only act as transmission sources, but also serve to illuminate the environment,
have beneficial properties such as lower power consumption, heat dissipation and cost [111].
Using the 2-D VCSEL/RCLED array of emitting devices, flip-chip bonded to an array of CMOS
driver circuitry, allows for a highly-integrated transmitter solution [62]. The driver circuitry
is capable of controlling each element’s emitted power, along with any other signal processing
techniques currently realisable in CMOS. Furthermore, it is possible to integrate beam
shap-ing and steershap-ing optics, that can control the position of each of the resultant projected spots on
the ceiling [112], which will then be reflected, according to the reflection properties of the ceiling.
Independent of which technology is used in the transmitter, the radiation it emits, if incident
upon the boundaries of the environment or the surfaces of objects, will be reflected with an
intensity distribution that is predominately determined by the angle of the radiations incidence,
and the roughness of the reflection surface. A suitable measure of the surfaces roughness is given
by the Rayleigh criterion whereby a surface can be considered smooth if [113]
ζ < λ 8 cosθi
(m) (2.1)
Whereζ is the maximum height of the surface irregularities,λis the wavelength of the incident
radiation at an angle θi, referenced from the surface normal. Therefore for normally incident
infrared radiation, withλ≈800 nm, the surface will be rough ifζ >0.1µm.
Surfaces that are considered rough under the Rayleigh criteria in (2.1), reflect radiation with a
gener-alised cosine law [114]
R(θo) =ρ n+ 1
2π Picos n(θ
r) (W sr−1) (2.2)
Where ρ is the reflectivity coefficient of the material, Pi is power of the incident wave, n is
the Lambertian order and θo is the angle of observation. An ideal Lambertian diffuser, where
the surface will look equally bright when observed from any angle [115], is found by setting
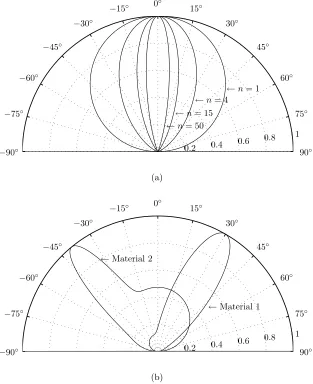
n = 1. Figure 2.1(a), shows the resultant reflected intensity distribution for surfaces with a
higher Lambertian order, n={1,4,15,15}, resulting in higher directionality.
For surfaces that (2.1) defines to be smooth, the intensity distribution of the reflected radiation,
is to an extent, dependent upon the the angle of the incident radiation, such as an ideal mirror
for example. However, as not all materials are ideal, the intensity distribution is more accurately
described as the sum of two components [116]
R(θo, θi) =Rd(θo) +Rs(θo, θi) (W sr−1) (2.3)
Where Rd and Rs are the diffuse and specular components respectively, noting the diffuse
component is not dependent upon the angle of incidence,θi. A suitable model for approximating
these non ideal surfaces is provided by Phong [117, 118]
R(θi, θo) =ρPi
n+ 1 2π rdcos
n(θ
o) + (1−rd) m+ 1
2π cos m(θ
o−θi)
(2.4)
Where m is the directivity of the specular component, rd is the proportion of incident
sig-nal that is reflected diffusely and assumes values between 0 and 1. Setting rd = 1 indicates
a pure diffuse reflector and reduces equation (2.4) to (2.2). An example of how the specular
component changes the reflected intensity distribution can be seen in figure 2.1(b), where two
different materials are shown with parameters approximated from [113, 118]. Material 1 has the
parameters θi = 30◦, m = 20, rd = 0.6 and ρ = Pi = 1, while material 2 has the parameters
0◦
15◦
30◦
45◦
60◦
75◦
90◦
−90◦
−75◦
−60◦
−45◦
−30◦
−15◦
0.2 0.4 0.6
0.8 1
←n= 1
←n= 4
←n= 15
←n= 50
(a)
0◦
15◦
30◦
45◦
60◦
75◦
90◦
−90◦
−75◦
−60◦
−45◦
−30◦
−15◦
0.2 0.4 0.6
0.8 1 ←Material 1
←Material 2
[image:48.595.140.453.212.596.2](b)
Figure 2.1: Lambertian and Phong reflection model comparison. (a) Lamberts generalised cosine
Most materials found in a typical office or home environment, such as painted and unpainted
cement or plaster, unpainted wood and ceramic floor tile exhibit a Lambertian intensity
distri-bution, whereas Formica, varnished wood and glass exhibit a characteristic better described by
Phong [113]. There is some debate in the literature over whether or not the use of Phong is
beneficial in determining a more accurate impulse response [119]. In [113] and [118], channel
models were presented for single reflection scenarios, comparing the results for using Lambertian
and Phong models. The results concluded that the channel response was almost identical,
ex-cept where the transmitter and receiver are in close proximity, where at these positions Phong’s
model increases the path loss by about 5 dB more than when Lambert’s model is used. It was
also noted that Phong’s model would be computationally more expensive than Lambert’s model
beyond determination of one reflection.
From this point onwards it will be assumed that all the boundaries of the environment and
the surfaces of the objects will reflect radiation according to Lambert’s model. Therefore,
as each diffusion spot on the ceiling, formed using either multiple optical sources or a 2-D
VCSEL/RCLED array, will exhibit a Lambertian intensity distribution, each of the I diffusion
spots on the ceiling independent sources Si. The only error induced with this assumption is
a delay and propagation loss between the emitting element of an 2-D VCSEL/RCLED array
and the diffusion spot position. In an arbitrary room, the number of possible transmitter and
diffusing spot positions is essentially infinite, and so this assumption also serves to simplify the
argument for the model whilst maintaining generality to the application. Each source Si will
have an associated position vectorrSi, unit length orientation vector ˆnSi, powerPSi and uniaxial
symmetric, with respect to ˆnSi, Lambertian radiation intensity profile R(φ) given by
R(φ) = n+ 1 2π PSicos
n(φ) forφ
∈[−π/2, π/2] (2.5)
Where the mode number, n, can be set to n = 1 for an pure Lambertian diffuser, such as the
ceiling, and set to n > 1 for a diffusion spot that represents an independent LED with higher
![Figure 2.2: Source, receiver and reflector geometry [87].](https://thumb-us.123doks.com/thumbv2/123dok_us/9729213.473843/51.595.154.446.137.381/figure-source-receiver-and-reector-geometry.webp)

![Figure 2.5: Reproduction of the results published by ‘Barry’ [87]. (a) Individual component](https://thumb-us.123doks.com/thumbv2/123dok_us/9729213.473843/66.595.157.436.155.655/figure-reproduction-results-published-barry-individual-component.webp)