UNIVERSITY OF TWENTE
Improving purchasing
performance using
enabling performance
measures
Benchmark Electronics
Olaf de Kruijff – s0200743 8/21/2015
Supervisors Benchmark: Supervisor University Of Twente:
Ronald Rikmanspoel Chintan Amrit
1
PREFACE
To complete my Bachelor in Industrial Engineering and Management, I performed a research at Benchmark Electronics Almelo regarding performance measurement systems. After hearing some nice stories of fellow students at the University of Twente, I encountered Ronald Rikmanspoel, who invited me to look into the Benchmark environment. I accepted the offer to research the performance measurement system of Benchmark its purchasing department and so Ronald became my first company supervisor. I want to thank him for the opportunity of having my internship at Benchmark, for his critical feedback on my performance and holding op the mirror to me quite some times. It has given me a lot of extra luggage for later in my career.
My second company supervisor was Erik Eilering, with whom I worked together nicely. Even though he was busy with the Thales transfer and the improved personal security devices, he planned quite a lot of time to help me when I needed him. With his help, some nice research results were achieved and my understanding of a company its reporting system has increased a lot.
Furthermore, I would like to thank the purchasing department’s employees for their collaboration with special attention to the purchasing manager Henk van Kooten, Jeroen van der Heijden and Nardi Soerodimedjo. Henk always gave critical feedback during interviews; Jeroen had the deepest understanding of the problems with the performance measurement system and managed to let me improve those. In addition, with Nardi I worked together for about 6 sessions to get a deeper understanding of the business processes and the importance of many different factors to be taken into account when preparing for a BAM session.
From the University of Twente, I would like to thank Chintan Amrit. During the research he provided me with some insights I could not find myself and which could also not be found within Benchmark. He also gave valuable advice in which data to analyze and what to do in order to fulfill a research at Bachelor thesis level. In addition, I would like to thank Sina Behfard, who was the co-reader of my thesis and helped review my concept report.
As a final remark, I hope that the research will contribute to a better reporting service and I hope the recommendations towards future research will be embraced.
Sincerely,
2
MANAGEMENT SUMMARY
In recent years, Benchmark has developed a control mechanism, called Benchmark Accountability Management (BAM). BAM is tiered, visual management system used to drive daily focus on continuous improvement using the elements of lean and six sigma. BAM has been implemented in the Almelo plant about a year ago, but it is encountering some issues. One of the problems is that the reports are processed by Excel macros and have to be started manually to obtain recent information. The reporting structure thus is not optimal and because of that, BAM sessions are not very effective.
Furthermore, the performance of Benchmark’s purchasing department has many improvement opportunities. The new purchasing manager saw the reduction of supply times as the biggest opportunity within his department. This is because it has become a trend for customers to request their products in a smaller time window. Therefore, the supply chain should become more flexible to respond to customer demand. This research will thus also review the possibilities of reducing the supply times within Benchmark. These two points have led to the following main research question:
'How should Benchmark Almelo design their performance measurement system in order to enable the purchasing department to improve the supply delivery performance?'
In this research, we mainly focused on the purchasing department, but there has also been a close collaboration with the business intelligence department. After reviewing literature and analyzing Benchmark’s current situation, a few causes for the problems have been identified. First of all the data is not properly organized for analysis purposes. The second thing is that the current reports are sometimes too complicated or do not really seem to make sense. The third thing is that BAM was not implemented the way it should be implemented.
Too organize data properly for analysis purposes a data warehouse has to be in place and this currently is not in place within Benchmark. However, Benchmark Corporation has been busy for a while and some of the data marts are slowly being released to all the Benchmark sites. To make appropriate performance measures, the reporting system should be hooked to this data warehouse. As an alternative, the data is organized in a regular database, which can handle current data fine and due to an integration script, it is possible to filter data you do not want to have in your database before it gets in.
3 In conclusion it can be stated BAM in itself is a quite good mechanism to use for performance measurement; however some changes need to be made in both data organization as well as in living by the protocols. For now, three reports have been built within the SSRS alternative, a reporting tool on top of a database. These reports are found in section 6.2 and one of them is given in Figure 1.
Figure 1 - New Supplier OTD
All three reports have encountered improvements from the previous versions. The data is more accurate, because delivery data has been linked to the actual delivery to the dock, rather than the moment it is put in stock. Furthermore, the unknown supply times have been put in perspective of the total amount of items, unnecessary information has been left out and the reports are set to a default that is ready for BAM. In addition to these reports, also an effort has been put into mining the delivery data of the past 13 months. This however did not give clear predictions, because the data was too randomly distributed.
These are however not the only findings within the literature and current situation combined. The supply contracts on itself are a good thing, but in Benchmark’s case they depend on the forecast based on the customers forecast. Forecast inaccuracy leads to inappropriate high lead-times. Increasing forecast accuracy thus yields a decrease in lead-time. Given the enormous amount of signals to delay, expedite or even cancel an order, this forecasting mechanism needs researching.
4
TABLE OF CONTENTS
Preface ... 1
Management Summary ... 2
Table of Contents ... 4
1. Introduction ... 6
1.1. Introduction to Benchmark Electronics ... 6
1.2. Background of the research ... 6
1.3. Summary ... 9
2. Defining the research ... 10
2.1. Research goal ... 10
2.2. Research deliverables ... 10
2.3. Research method ... 10
2.4. Research question and sub questions ... 12
2.5. Summary ... 13
3. Literature review... 14
3.1. Supply Chain Environment ... 14
3.2. Performance Measurement ... 16
3.3. Information (Technology)/Business Intelligence ... 19
3.4. Supplier Development ... 20
3.5. Supply Chain Flexibility... 20
3.6. Forecasting ... 23
3.7. Lead-time Reduction ... 25
3.8. Summary ... 26
4. Describing the current situation ... 27
4.1. BAM ... 27
4.2. Delivery performance measures ... 29
4.3. Supply time Reduction ... 35
4.4. Summary ... 37
5. Literature Review – Performance Improvement ... 38
5.1. Supply Chain Performance Improvement ... 38
5.2. Enabling performance measures ... 38
5.3. Tackling Demand Uncertainty ... 39
5.4. Summary ... 40
5
6.1. Why not to choose to build a data warehouse ... 41
6.2. New delivery reports ... 41
6.3. Other delivery factorials ... 45
6.4. Summary ... 46
7. Data analysis ... 47
7.1. Defining the data set ... 47
7.2. Data preprocessing ... 48
7.3. The data mining step ... 50
7.4. Summary ... 52
8. Conclusions and recommendations ... 53
8.1. Conclusions ... 53
8.2. Recommendations ... 53
9. Discussion and further research directions ... 55
9.1. Supplier flexibility portfolio ... 55
9.2. Forecast accuracy ... 55
9.3. Planning ... 55
Bibliography ... 56
Appendices ... 58
A. Acronyms ... 58
B. Lead-time Explained ... 59
C. ANOVA assumption test ... 60
D. Analysis clusters ... 61
6
1.
INTRODUCTION
In this chapter, Benchmark Electronics as a company is presented, with specific focus on the Almelo plant. It is also explained why this research is of importance to Benchmark Almelo as a company.
1.1. INTRODUCTION TO BENC HMARK ELECTRONICS
Benchmark Electronics started in 1979 in Clute, Texas, specializing in low-volume, complex assembly of medical products as an outsourcing partner of a company called Intermedics. Back then, Benchmark was simply known as “Electronics, Inc.” In 1988, the word “benchmark” was added, changing the name to “Benchmark Electronics, Inc.”, as it is still known today.
Over the years, Benchmark grew primarily by acquisition. For instance, in 1998, Benchmark acquired Lockheed Martin Commercial Electronics Company, one of the largest electronics manufacturing service (EMS) companies in New England. Just one year later, AVEX Electronics was acquired in the largest acquisition of its kind in the Contract Manufacturing industry at the time. The acquisition of Pemstar in 2007 represented Benchmark’s first merger with another global, publicly traded company. Today, Benchmark is located at 19 sites around the world, in nine different countries.
Benchmark played a part in developing a lot of ground breaking technological innovations. These include: the first swallowable camera for transmitting live video of its journey through the body; the first prescription medicine vending machine; the first FDA-approved drug eluting stent; the first portable Braille PDA, telephone and organizer; the first laser-accurate, hand-held vein-finding device and the first fully-automated, dual-ear, hand-held newborn screening device.
Benchmark provides services to original equipment manufacturers (OEMs) of computers and related products for business enterprises, medical devices, industrial control equipment for aerospace and defense, testing and instrumentation and telecommunication equipment. In Almelo, the focus lays the development and production of test- and measurement equipment. Benchmark offers customers comprehensive and integrated design and manufacturing services from initial product design to volume production. Their manufacturing and assembly operations include printed circuit boards and subsystem assembly, box build and systems integration.
Currently Benchmark employs about 12000 people. Approximately 400 of them are located in the Almelo plant. The plant in Almelo originally was a subsidiary of Philips, specialized in designing and manufacturing test and measurement equipment. Currently the plant is in a state of production line transfer. Therefore, the company has expanded fast over the last few months. They have acquired a full production line for Thales and this will be integrated in the plant its operational system.
1.2. BACKGROUND OF THE RE SEARCH
7 1. Tier 1 BAM meetings will consist of manufacturing cells.
2. Tier 2 BAM meetings will be second level manufacturing for sites that have manufacturing supervisors managing multiple cells or managing multiple supervisors.
3. Tier 3 BAM meetings will be used for Customer Focus Teams. 4. Tier 4 BAM meetings will be used for internal department meetings. 5. Tier 5 will be the site General Manager and het direct reports.
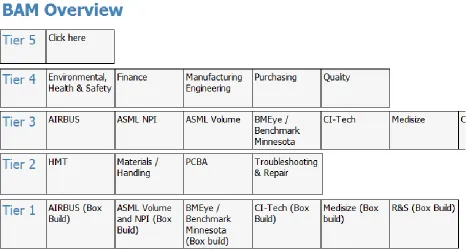
[image:8.612.76.543.246.497.2]At these tier levels, different BAM sessions are being held based on different BAM boards, where the performance measures and metrics are put in place. We will explore the BAM board in more detail in section 4.1. To have a nice overview of the measures that are in place throughout different BAM tiers, an application has been launched within the intranet environment of Benchmark, which is SharePoint. At SharePoint, the different cells within the tiers can be overviewed as shown in Figure 2. Within a click on the button, the underlying reports can be obtained.
Figure 2 - SharePoint BAM Overview
The performance metrics are partially defined and are partially not defined by Benchmark Corporate. The metrics start with the corporate goals and flow down all the way to the manufacturing cell metrics in Tier 1. The only exception is at Tier 4, the internal department Tier. Only within the engineering and warehouse department the metrics are defined at a corporate level, the other departments do not have a predefined set of measures and metrics.
8 Figure 3 - Information processing
In the first step, data is dumped from multiple databases into Excel sheets, either through a direct export or by using Crystal Reports, a BI-application. This all falls within the responsibility of the IT-department. These dumped Excel sheets are processed by macros in Visual Basic for Application (VBA). Using these macros, many reports are generated for the purchasers.
However, since the assigned individual left Benchmark many things went wrong. The macro that automatically runs all reports needed deletes all format files used to process the different reports after they have been processed. Furthermore not all format files do actually run, so many of the reports being discussed at the BAM board are outdated and will not be updated. The consequences are that the reports are not in place and the attendees of the meeting are dissatisfied. Moreover, all reports need a manual conversion and if the newly assigned individual is out of office, there are no up-to-date reports and there is no recent business performance information available for the purchasing department.
Since BAM is meant to improve the business performance, improvement goals have to be set. A new purchasing manager started in November 2014 and he sought for improvement opportunities. The found key improvement opportunity was found to be the reduction of lead-times within the sourcing side of the supply chain. The reduction of time would then lead to improved supply chain flexibility at the supply side of the supply chain. This lead-time reduction should go hand in hand with inventory reduction, because you do not want to overflow your warehouses in order to respond to market demand. These supply times are quoted based on supply contracts and are assumed deterministic by the ERP system. These quoted supply times will be called fixed lead-time and are item number related. In Appendix B it is further explained how the lead-times are divided within Benchmark and which of those lead-times are of interest in this research.
9 come into a state where they are helping instead of causing headaches. Another desire is to try to get the corporate tools up and running, since they do not work for the Almelo plant.
1.3. SUMMARY
10
2.
DEFINING THE RESEARCH
To perform a research it is necessary to set research boundaries and describe the research in detail. To do so a research goal is set, research methods are described and a set of research questions is formulated. In this chapter, these will all be discussed in detail.
2.1. RESEARCH GOAL
The main goal of the research is to provide Benchmark with a performance measurement system that enables employees to improve their performance. Therefore, information needs to be actionable and the translation from data to information needs to be readily available. This has to be reported in a clear and simple way, so there can be no misunderstanding of the performance information and BAM meetings can be held accurate and effective. Given the strategic goal of the purchasing manager to reduce supply times, the focus of the enabling performance measures will be on the delivery category of the purchasing department.
2.2. RESEARCH DELIVERABLE S
In order to make sure the research is not steered in multiple directions, it is necessary to bind the research. Therefore, a set of research deliverables has to be defined at an early stage. The research deliverables will be:
A detailed description of the current situation.
Renewed versions of Key Performance Indicators (KPIs) regarding delivery.
Recommendations on how to let a performance measurement system enable employees in improving their performance.
Recommendations on how to reduce the supply times in Benchmark’s business environment whilst maintaining supply reliability.
Investigate why the corporate performance measurement tools are not working at Benchmark Almelo. 2.3. RESEARCH METHOD
To actually deliver the research deliverables described in section 2.2, a plan has to be put together to achieve the output we aim for. The research deliverables will be discussed point by point and it will be explained how to obtain useful research output.
2.3.1. METHOD TO OBTAIN A DETAILED DESCRIPTION OF THE CURRENT SITUA TION
Firstly, it is good to explain which current situation we actually want to describe in this research. There are three major points in describing the current situation within Benchmark.
11 Since we want to describe the current situation regarding BAM at the purchasing department, the BAM sessions will be attended every single morning when present at Benchmark. Since Benchmark has to follow corporate procedures, these will studied and reflected upon in this thesis. Furthermore, BAM will be taken into plant perspective and a look will be taken into the implementation process and intentions of BAM.
While attending the BAM sessions, the current performance measures will be discussed. By attending the sessions, an understanding of these measures will be developed. Furthermore, multiple interviews will take place with the purchasing employees to find the key issues with the reports, as well as which performance measures are found useful or not. The processing of the purchasing reports will also be discussed with those employees with a broad understanding.
The last element of the current situation to be discussed is the initiative to reduce supply times. Which efforts currently are being done in order to reduce and control supply time as much as possible? This information will be obtained by interviewing the strategic buyers. The current situation will be assessed and placed in perspective by doing a literature study.
2.3.2. METHOD TO GENERATE NEW DELIVERY KEY PERFORMANCE INDICA TORS (KPIS)
In describing the current situation, we will find the KPIs that are currently being used to measure delivery performance at Benchmark. To gain insights in which other measures can be used to assess the delivery performance, a literature review shall be done. In addition, corporate procedures might point out interesting measurements regarding delivery at different Tiers of the supply chain within Benchmark itself. When the interesting delivery KPIs for Benchmark are found, these will have to be implemented. To do so, a new way of generating the performance measures has to be found to get rid of the Excel macros.
2.3.3. HOW TO FIND RECOMMEN DATIONS ON DEVELOPING A PERFORMANCE MEAS UREMENT SYSTEM THAT ENABLES EMPLOYEE PERFORMANCE IMPROVEMENT
At the BAM board, there are many reported performance measures to show the KPIs of the purchasing department. Not all of those performance measures might serve an improvement goal. Therefore, insights need to be obtained on how performance measures facilitate employees in improving performance. This shall be done doing a literature study and this shall then be used to reflect upon the Benchmark procedures. This shall be taken into account when generating the new KPIs.
2.3.4. FINDING RECOMMENDATIONS ON HOW TO REDUCE THE SUPPLY TIMES IN BENCHMARK’S BUSINESS ENVI RONMENT WHILST MAINTAINING DELIVERY RELIABILITY
12
2.3.5. INVESTIGATE WHY THE CORPORATE PERFORMANCE MEASUREMENT TOOLS ARE NOT WORKING AT BENCHMARK ALMELO
Within Benchmark Corporation, multiple tools to generate business reports at different levels are supporting Benchmark sites. For the purchasing department, a tool called Vendor Indicative Performance Rating (ViPeR) is given to measure the supplier performance and easily extract all relevant data from different data sources. Supplier performance evaluation is relevant for the purchasing function, so it would be nice to know if this tool has the possibility of working and if not, what the restrictions are. With assistance of the purchasing manager and the supply chain architects it should become clear why the tool does not work know and which tools can be used otherwise.
2.4. RESEARCH QUESTION AN D SUB QUESTIONS
In order to fulfill this research, a main research question has to be answered. As stated in the research goal in section 2.1, this will be focused on developing an enabling performance measurement system with the main focus on improving delivery performance. The main question can this be formulated as:
'How should Benchmark Almelo design their performance measurement system in order to enable the purchasing department to improve the supply delivery performance?'
To adequately answer the main question it needs to be divided into subquestions . These will be categorized based on the categorized research deliverables.
QUESTIONS REGARDING THE CURRENT SITUATION
HOW IS THE PERFORMANCE MEASUREMENT SYSTEM CURRENTLY SET UP?
In order to make recommendations towards using the Benchmark performance measurement system, it is useful to investigate its current state. Discrepancies between theory and practice can then be found and examined in more detail.
WHAT EFFORTS ARE CURRENTLY BEING DONE IN ORDER TO REDUCE THE SUPPLY TIMES?
Since the main strategic purchasing goal is to reduce the supply times, Benchmark is of course already on the go with reducing the lead-times. What are they doing in order to do so and does it rhyme with the efforts they should be taking according to the literature is therefore an important issue for this thesis. This will thus be included.
FOR WHICH REASONS ARE THE CURRENT CORPORATE TOOLS NOT AVAILABLE FOR USE AND WHAT CAN BE DONE TO MAKE THEM WORK?
Under this question, it will become clear why current corporate tools cannot be used and will be answered why it’s not possible or what can be done to make the corporate tools work.
QUESTIONS REGARDING THE PURCHASING DEPARTMENT
WHAT ARE THE KPIS THAT ARE OF IMPORTANCE IN THE PURCHASING DEPARTMENT REGARDING DELIVERY PERFORMANCE?
13 QUESTIONS REGARDING PERFORMANCE MEASUREMENT SYSTEMS
HOW CAN PURCHASING PERFORMANCE BE MEASURED ACCURATELY?
In this section the systems behind the measurements are being evaluated.
HOW CAN PERFORMANCE MEASUREMENTS FACILITATE PERFORMANCE IMPROVEMENT?
Since the goal is to improve the presented performance measures, it’s important the performance measures are somehow used to activate employees to improve what has been measured. How that can be done will be found under this section.
QUESTIONS REGARDING SUPPLIERS
HOW DOES SUPPLIER PERFORMANCE AFFECT PURCHASING PERFORMANCE?
Supplier performance directly impacts the performance of the purchasing department of the buying firm, but what the impact really is will be discussed in this section.
WHICH SUPPLIER SHOULD YOU ASSIGN TO WHICH CATEGORY?
Not every supplier is the same and each supplier has different benefits for Benchmark. How to classify them will be discussed under this question.
QUESTIONS REGARDING BENCHMARK’S BUSINESS ENVIRONMENT
HOW CAN BENCHMARKS BUSINESS ENVIRONMENT BE DESCRIBED AND WHAT KIND OF SUPPLY CHAIN IS NEEDED FOR THAT TYPE OF ENVIRONMENT?
To be able to make good recommendations about the reduction of supply times, the business environment has to be defined and the belonging supply chain type should be identified. This should then also be examined.
QUESTIONS REGARDING INFORMATION SYSTEMS
HOW CAN BUSINESS INTELLIGENCE ASSIST IN REACHING PERFORMANCE IMPROVEMENT GOALS?
A theoretical base for using business intelligence to improve individual performance is needed to clarify possible research outcomes and also to gain insights for further recommendations.
2.5. SUMMARY
14
3.
LITERATURE REVIEW
In order to make adequate decisions about what to do, Benchmark’s business environment has to be defined properly. Given the business environment, a supply chain typology has to be made. Taken into perspective that the goal is to reduce supply times, a literature review has to be performed on how to shorten supply times. This then has to be put into the supply chain perspective and will form a base of comparison against the current situation within Benchmark, which will be done in the next chapter. Also, the role of performance measurements in this supply chain environment is going to be researched.
3.1. SUPPLY CHAIN ENVIRON MENT
As stated in the background, Benchmark is an outsourcing partner for complex electronics equipment, or a so called electronics manufacturing service. It does not have an own product, but it helps customers developing their products as well. Products can be viewed as innovative, with a high new product introduction (NPI) rate. These innovative products have a high level of demand uncertainty (Fisher, 1997). Benchmark depends on the forecasts of their customers and if the customer changes its forecast, Benchmark will have to act on this. Benchmark will thus have to cope with the so called bullwhip effect, where the demand uncertainty amplifies the further you come in the supply chain.
In Figure 4 a simplified representation of a supply chain is given (Chen & Paulraj, 2004). The supply chain is typically characterized by forward flow of materials and backward flow of information (Beamon, 1998).
Figure 4 - Simplified supply chain (Chen & Paulraj, 2004)
The buyer-supplier dyad, represented by link 1 in Figure 4, is of huge importance to the effective management of the supply chain (Chen & Paulraj, 2004). As can be seen from Figure 4, from an internal supply chain perspective, it’s the purchasing department’s task to maintain the buyer-supplier dyad. We will come back to this in section 3.1.2.
15
3.1.1. COMPETITIVE PRIORITIES
According to Krause, Handfield & Tyler (2007) buying firms in manufacturing industries, including electronics, have four primary competitive priorities in their end-markets: cost, quality, delivery time and reliability, and flexibility. Time has become a key factor in competitiveness due to customers that are becoming increasingly reluctant to accept long lead-time items (Purvis, Gosling & Naim, 2014). Das & Abdel-Malek (2003) and Purvis et al. (2014) address one other competitive priority compared to Krause et al. (2007). They agree on cost, quality and flexibility, but they call service level instead of delivery time and reliability. These however can be viewed as components of service level, as is stated by Simchi-Levi, Kaminsky & Simchi-Levi (2009). They state service level will be higher for products with:
High profit margin
High volume
Low variability (and thus reliability)
Short lead-times
3.1.2. SUPPLIER MANAGEMENT
As stated in 3.1, the purchasing function is responsible for managing the suppliers. Figure 5, by Das & Abdel-Malek (2003), shows the buyer-supplier dyad accompanied with more details. It can be seen buyer and supplier are linked through a triple flow. Next to Beamon (1998) her forward flow of materials and backward flow of information, there is also the supply contract. The supply contract is the key document. In a supply contract the conditions under which buyer and supplier cooperate are specified. This is typically a legally binding document which forms a protection for the parties in case they have a disagreement. In a supply contract supplier and buyer agree on (Das & Abdel-Malek, 2003; Simchi-Levi et al., 2009):
Pricing and volume discounts
Minimum and maximum purchase quantities
Supply times
Product or material quality
Product return policies
Technology transfers
[image:16.612.310.520.281.483.2]In supply contracts it is thus defined how the forward flow from the supplier to the manufacturing company goes, in this case to the buying company Benchmark. As stated by Beamon (1998), the information flow typically goes backward. Figure 5 gives production orders and inventory levels as parameters for information transfer, but this information can also be characterized otherwise. For example purchase orders (POs) could be issued, just like Benchmark does.
Figure 5 - Buyer-supplier dyad
16 Effective supply contracts provide incentives for supply chain partners to replace traditional strategies, in which each partner optimizes its own profit, with global optimization, where supply chain profit is maximized. Supply contracts are important because they help firms achieve global optimization, without the need for an unbiased decision maker, by allowing buyers and suppliers to share the risk and the potential benefit. Indeed, it can be shown that carefully designed supply contracts achieve the exact same profit as global optimization (Simchi-Levi et al., 2009).
3.2. PERFORMANCE MEASUREMENT
A performance measure can be defined as follows:
“A performance measure is a translation of a notion of performance into a number that can be calculated with available data” (Wouters, 2009).
Beamon (1998): An important component of supply chain analysis is the establishment of appropriate performance measures. Available literature identifies a number of performance measures as important in the evaluation of supply chain effectiveness and efficiency. Wouters (2009) states that often, non-financial measures are more actionable than aggregate financial measures. These provide a more direct insight into the causes of good or bad performance.
Essentiality of performance measurement in supply chain is vital, and Gunasekaran and Kobu (2007) mention the following as the purposes of a performance measurement system bases on a literature review:
Identifying success.
Identifying if customer needs are met.
Better understanding of processes.
Identifying bottlenecks, waste, problems and improvement opportunities.
Providing factual decisions.
Enabling progress.
Tracking progress.
Facilitating a more open and transparent communication and co-operation.
Also, key elements in the approach of a Performance Measurement System (PMS) design and implementation are the connection between strategy and measures, the validity and reliability of those measures, achieving consistency throughout the company and periodically refining the results of the performance measure. In the implementation phase it is important to set systems and procedures in place to gather the relevant data and enable the measures to be made regularly and reliably (Wouters, 2009). Regarding the usage of macros this is not the case within Benchmark and we want to change that. Developing a PMS that is valid, useful and understandable is challenging and complex. Valid means here that the performance measures actually measure the performance intended.
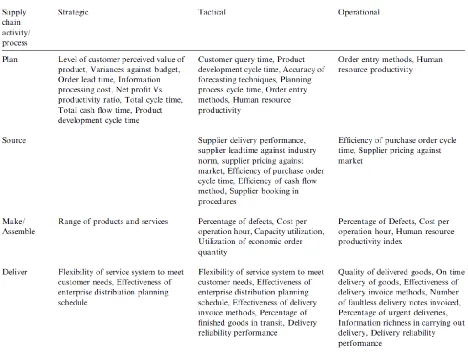
17 1. Plan
2. Source
3. Make/Assemble 4. Delivery
[image:18.612.74.542.217.580.2]These are derived from the Supply Chain Operations Reference (SCOR)-model and have a great resemblance with the simplified supply chain of Chen & Paulraj (2004) given in Figure 4. For the purchasing function the first two of the links are the ones mostly discussed. These are the steps resembling the Production Planning and Inventory Control step described by Beamon (1998). The metrics with interest for the purchasing function will be discussed below. Some of them also come from step 4, Delivery. These are of interest due to the flexibility measures.
Figure 6 - Supply Chain PMS
3.2.1. PLANNING MEASUREMENTS
18 This is an important measure, but also a great source of competitive advantage. It is stated to directly influence the customer satisfaction level, which in turn is regarded as a market winner (Gunasekaran et al., 2001). Equally important is the reliability and consistency of the lead-time.
3.2.2. SUPPLY CHAIN PARTNER SHIP MEASUREMENTS
Gunasekaran et al. (2004) also state that the purchasing and supply management department of a buying company must analyze the supplier’s ability to meet the firm’s long-term needs. Furthermore they find, based on multiple sources, that supply chain partnership is an essential element for efficient and effective sourcing. These partnerships need maintenance, so the partnership needs to be evaluated to create win-win situations for both parties.
Another interesting point within the measurement of suppliers is to not only measure the external performance. The internal performance of a supplier is also an important subject. By collaborating closely with a supplier, a buying firm is able to see if the measurements are in place within the supplying firm. These should enhance performance improvement and these contribute to the overall supply chain performance.
3.2.3. DELIVERY MEASUREMENT S
Even though the delivery at the end of the SCOR-model is shows deliveries to the customer, within the purchasing function suppliers are evaluated in a similar way. The delivery measures and metrics thus also apply to evaluate supplier performance. The most important issue addressed is the on-time delivery performance. This evaluates if a delivery was good or bad, and it acts as a measure of the service level a supplier has given a company. According to Stewart (1995), the delivery performance measures should be:
Delivery-to-request date
Delivery-to-committed date
Order fill lead-time (the time between an order and the order delivery)
Delivery performance has two primary components: (1) reliability of delivery, which is the ability to deliver when promised, and (2) delivery speed, which is typically thought of in terms of short delivery times (Krause et al. 2007). The reduction of lead-time is revealed as a trend of operational strategy for improving delivery performance. Moreover, the number of faultless notes invoiced and the supply chain flexibility reflect customer satisfaction. If a note isn’t faultless, the areas of discrepancy can be identified so that improvements in delivery performance can be made. Flexibility is regarded as a metric to win customer orders (Beamon, 1998; Carr & Smeltzer, 2000; Gunasekaran et al., 2001; 2004). It is defined as “the degree to which the supply chain can respond to random fluctuations in the demand pattern” (Beamon, 1998; Gunasekaran et al., 2001; Das & Abdel-Malek, 2003; Simchi-Levi et al., 2009; Purvis et al., 2014).
Analysis has found it has a strong correlation with the supply chain response time. So by defining flexibility as a metric and evaluating it, companies can achieve rapid response to meet individual customer needs.
19
3.2.4. INVENTORY MEASUREMEN TS
Gunasekaran et al. (2001) state that measuring inventory at supply, production, distribution and scrap levels can provide insights into the cost performance, but also reduce the lead-time in the supply chain. Another factor that is mentioned is the measuring of the accuracy of forecasting techniques. In the empirical study of Gunasekaran et al. (2004), one of the survey participants emphasizes the need of accurate forecasting especially. The forecasts of all supply chain links influence the supply chain as a whole, so a concerted effort should be made in improving the forecasting accuracy. Better forecasting methods should then result in a reduction of supply chain uncertainty and enhance performance improvement. Many of the participants understand the consequences of poor forecasting techniques and agree on the need of measuring it to be able to improve it.
3.3. INFORMATION (TECHNOL OGY)/BUSINESS INTELLIGENCE
Prajogo & Olhager (2012) test a bunch of hypotheses regarding factors contributing to performance improvement. This framework is presented in Figure 2Figure 7. All of their links are tested as a hypothesis of contribution to the next link in the chain. Logistics integration has a significant positive effect on a firm’s operational performance. Information technology capabilities and information sharing both have significant effects on logistics integration. Furthermore, long-term supplier relations have both direct and indirect significant effects on performance; the indirect effects through the effect on information integration and logistics integration (Prajogo & Olhager, 2012). All hypotheses are thus confirmed. One way to achieve supply chain integration is collaborative planning, forecasting and replenishment (CPFR). Information sharing can lead to lower cost through reductions in stock levels and shortages. However, to realize this, changes in the logistics process has to be made. Vendor Managed Inventory (VMI) programs could be started, lead-times could be reduced or deliveries could occur more frequently with smaller order sizes (Prajogo & Olhager, 2012).
Figure 7 - Performance improvement contributors (Prajogo & Olhager, 2012)
In the Das & Abdel-Malek (2003) case, the information link is considered to be real time. In Benchmark’s case this is not really true, since the information is based on weekly updated forecasts and the issued purchase orders and deliveries.
The risk of putting huge investments in IT and sharing sensitive information is a serious hindrance which can only be taken when firms have a strategic and long-term relationship.
20 3.4. SUPPLIER DEVELOPMENT
Across various fields associated with organizational research there has been a growing recognition of interorganizational relationships as a source of competitive advantage and value creation (Krause et al., 2007). A form of interorganizational exchange that is part of supply chain management, is a practice known as supplier development. Krause et al. (2007) define supplier development as any activity initiated by a buying organization to improve the performance of its suppliers. Supplier development is an important strategy, because it could enhance shared knowledge and shared asset investments, which may lead to improved performance. Supplier development may include goal setting, supplier evaluation, performance measurement, supplier training, and other related activities (Krause et al. 2007). Gunasekaran et al. (2001, 2004) also emphasized these kind of practices to increase supply chain partnerships and thus increase sourcing efficiency.
Supplier development programs are designed to create and maintain a network of competent suppliers and to improve supplier relationships in order to be more competitive as a buying firm (Hahn, Watts & Kim, 1990). Monczka & Trent (1995) state buying firms have become increasingly reliant on the supply base and the need for supplier development thus exists. The purchasing function objective is to secure competent sources of supply. This involves the selection of suppliers and requires working with them to upgrade their capabilities.
Supplier development programs should be translated into a set of objectives dealing with the performance measures. These development programs typically are being set up after an evaluation of the supplier. The supplier development priorities should go to key suppliers that have the potential to meet the criteria. In terms of delivery, these are divided as follows:
Related areas
Capabilies
Product Related Process Related Operating Systems Related
Delivery capability Product Mix
Materials Lead-time
Capacity Level
Process Flexibility
Setup Times
Order Entry System
Scheduling Flexibility
Transportation/Inventory System
Table 1 - Supplier Development Delivery Priorities
3.5. SUPPLY CHAIN FLEXIBILITY
It has been mentioned before in section 3.2 at the performance measurements, but the supply chain flexibility is something to discuss further since it is the main reason for Benchmark to reduce the supply times. The prime motivation for supplier flexibility is the uncertainty in product demand experienced by the manufacturer (Beamon, 1998; Gunasekaran et al., 2001; Das & Abdel-Malek, 2003; Simchi-Levi et al., 2009; Purvis et al., 2014). According to Simchi-Levi et al. (2009) components that are not of strategic importance don’t have to benefit from long-term buyer-supplier relationships. Beamon (1999) states that resources are directly related to the systems output and the flexibility performance. The output is important in determining the system flexibility.
A key factor facilitating the growth of outsourcing is the lead firm’s desire to achieve greater strategic flexibility and lower risk by reducing fixed investments, especially in manufacturing facilities. Such considerations are especially important when the technological change is rapid and market volatility is high, like in the electronics industry (Sturgeon & Lee, 2001).
21 lead-time items. Lean and agile appear to address the same competitive priorities (cost, quality, service, flexibility), but they emphasize different elements. One of the greatest distinctions between agile and lean performers lays within the flexibility performance dimensions.
The two types of flexibility in which the most distinction is to be found between agile and lean systems, are volume flexibility and mix flexibility. Volume flexibility is defined as the ability to change the level of aggregated output, mix flexibility as the ability to change the range of products made within a given time period, while maintaining the same aggregated output. These two types of flexibility are ‘external flexibility types.’ They determine the actual or perceived performance of the company and are viewed externally by customers (Purvis et al., 2014). An other external flexibility type relevant in the Benchmark environment is delivery flexibility, which Gosling, Purvis & Naim (2010) describe as the range of and ability to change the delivery dates.
Flexibility is generally perceived as an adaptive response to environmental uncertainty (Purvis et al., 2014). More specifically, it is a reflection of the ability of the system to respond to volatile changes with little penalty in time, effort, cost or performance. Das & Abdel-Malek (2003) define supply chain flexibility as the elasticity of the buyer-supplier relationship under changing supply conditions. They also suggest that order quantities and supply times are the two most common changes in supply chains.
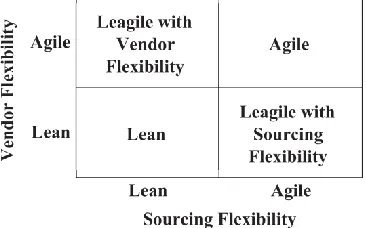
Supply network flexibility can be rationalized as a compromising of two key concepts: vendor flexibility and sourcing flexibility (Gosling et al., 2010; Purvis et al., 2014). Vendor flexibility refers to the flexibility related to the individual vendors within the supply base. Sourcing flexibility refers to the ability of the system coordinator to reconfigure a supply chain network through (de-)selection of vendors. This enables the supply system to adapt to market requirements. If a strategic partnering is in place, the flexibility requirements should be specified in a supply contract.
Purvis et al. (2014) provide a flexibility matrix to characterize the
four different supply chain strategies. Applying this to Benchmark Electronics, different characteristics can be defined. NPI-parts for example require a different type of flexibility than the volume production goods. Therefore, a combination of both is optimal. This is also emphasized by Purvis et al. (2014), since they also provide a supply network flexibility framework. This implies having both types of flexibility as well as some other types of flexibility (like mix flexibility).
Supply chain flexibility is a key to cope with high levels of uncertainty. Gosling et al. (2010) performed a study in the construction industry, where high levels of uncertainty arise from project specific demands. This is similar to the environment of Benchmark, which operates project lines for different customers, each project line with different specific demands.
[image:22.612.355.538.299.413.2]Figure 8 - Supply chain flexibility matrix (Purvis et al. (2014)
22
3.5.1. SUPPLIER PORTFOLIO’S
[image:23.612.135.480.175.407.2]Network coordinators, in Benchmark’s case Supply Chain Architects, can group their suppliers under three different categories, framework agreement suppliers, preferred suppliers and approved suppliers (Gosling et al., 2010). By using this framework, Gosling et al. (2010) argue that a network coordinator can maintain flexibility by maintaining a pool of suppliers within each of the categories. These classifications are used to inform sourcing and procurement decisions for different projects.
Figure 10 - Supplier flexibility portfolio (Gosling et al., 2010)
The diagonal line through the matrix shows the vendor and sourcing flexibility associated with each type of relationship. If the type of relationship is not on the diagonal, something is going wrong. If it is moving towards the top left of the diagonal, it’s moving to a strategy in which high vendor flexibility and high sourcing flexibility are required. In this case the strategy is overcompensating for risk and uncertainty, which lead to extra costs. If it moves towards the bottom right of the matrix, a supply chain might not be prepared enough for the risk and uncertainty levels that arise within the chain.
Framework Agreement: Recognizes the benefits of strategic partnering, just as Gunasekaran et al. (2001, 2004), Simchi-Levi et al. (2009) and some literature resources we will exploit later. Strategic suppliers are selected for key elements. Framework agreement suppliers are those suppliers that are most important to the buying company. Therefore they should be well integrated in the supply chain. The aim is to build close relationships by investing in the development of a supplier in order to achieve high vendor flexibility. Framework agreement suppliers are usually the suppliers that supply items that are critical for the project. In the research paper of Gosling et al. (2010), this is the manufacturer of the elevator. It invests heavily in new technology development and modular design principles. The product range is wide, as it is possible to adapt to project specific technical product designs.
23 projects that require their products or services, in the case example: windows, pre-cast concrete and roof trusses suppliers.
Approved Supplier: The approach of approved suppliers is to develop sourcing flexibility, rather than vendor flexibility. In the case example the approved suppliers are the suppliers that deliver the metalwork and brickwork. These are relatively standard items, with many potential suppliers within the supply chain.
Within the Benchmark environment other types of portfolio’s are being held in terms of suppliers, the Kraljic statuses are not being kept up to date and a renewed type of portfolio is being used. This uses approved and preferred, but also a variety of other types like corporate preferred and customer prescribed. Framework agreement suppliers are not in it.
3.6. FORECASTING
As stated in section 3.1, Benchmark relies on the forecasts of their customers and they need to translate that into their own forecast. As Gunasekaran et al. (2001, 2004) and Prajogo & Olhager (2012) state the accuracy of the forecasts is important to measure. Terwiesch, Ren, Ho & Cohen (2005) show by empirical analysis that suppliers penalize buyers for unreliable forecasts by providing lower service levels. Vice versa, buyers penalize suppliers by providing overly inflated forecasts.
Sharing demand forecast information to suppliers has long been recognized as a key element in supply chain coordination. Terwiesch et al. (2005) address two issues regarding forecast sharing that occur in practice.
Forecast volatility: Forecasts change and are continually updated as the buying firms gets new updates about the demand it faces. This problem is called forecast volatility. The question regarding forecast volatility is when the forecast information is accurate enough for suppliers start acting upon the given forecast and to justify it.
Forecast inflation: Forecasts have the intention to provide information on what the supplier is planning to do in the future. These intentions are not verifiable and cannot be enforced. In the absence of a contractual obligation to actually buy what is forecasted, the buyer has an incentive to inflate forecast to assure sufficient supply. Fearing inflated forecasts, a supplier might delay its production until the point at which a buyer commits to its forecast. In Benchmarks case, this is the firm commitment zone that is embedded in the LFA.
[image:24.612.210.403.595.690.2]In the provided two-by-two matrix, the setup is quite similar to the well-known prisoner’s dilemma. If the buyer and supplier both choose to not cooperate, the forecast sharing benefit will disappear. The extent to which the two parties will choose cooperative actions depends on the relevant planning horizon. In a one-shot game both parties will most likely not choose to cooperate, but Terwiesch et al. (2005) show that in a multi-period game the parties will follow the last move of their opponent, creating a tit-for-tat strategy.
24 Furthermore, they show that suppliers that have experienced large amounts of forecast volatility are less willing to allocate capacity to the buyer with the volatile forecast. This leads to overproporionally long lead-times. Also, suppliers that have been exposed to excessive order cancellations are less willing to allocate capacity towards forecasted orders. This again leads to overproportionally long lead-times.
They also identify a dilemma for the semiconductor supply chain, like the Printed Circuit Boards (PCBs) within the Benchmark environment. Just like in many customized capital goods industries, there is an order-fulfillment dilemma. Buyers expect their suppliers to be able to fulfill orders within in relatively short time. On the other hand, the high customization and value of the goods makes it risky for suppliers to keep finished assemblies in inventory, leading to long and also variable lead-times. To solve this dilemma, buyers send forecast, or “soft orders”. These are just to show the intent of the buyer, but aren’t binding.
In the Terwiesch et al. (2005) case, the semiconductor manufacturer uses a rolling forecast horizon principle, just like Benchmark does. These product level demand forecasts are used to forecast capacity requirements to existing and potentially new assemblies.
The buyer will probably update a soft order until the point in time it issues a purchase order. This gives the buyer a strong bargaining position. During the time the initial soft order has been issued until the placement of the purchase order, buyer and supplier will exchange information from one to another. Mostly, the buyer will update the supplier about changes in delivery dates, order sizes and other specific information. What will not be changed in here is the specification of the designed equipment. In the absence of such specification changes, soft orders have three modification scenarios.
1. The delivery date may be deferred or expedited. When changes are made in the planning horizon of the manufacturing plant, order dates may be rescheduled. Given the high capital costs associated with the high capital costs associated with the equipment, the buyer prefers to delay the delivery date over delivering the equipment and having it idle for quite some time.
2. The soft order might be completely cancelled. This is the case when the market demand levels are less than initially projected or when existing equipment operates at a higher yield/productivity level.
3. The soft order specifications remain the same.
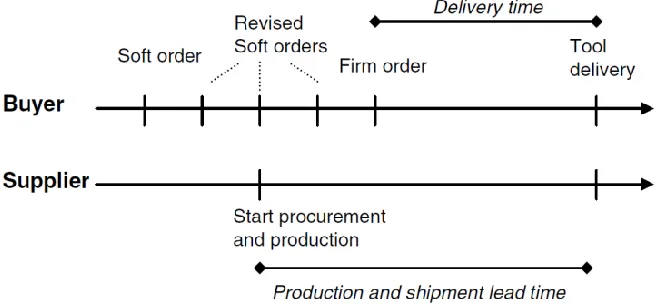
[image:25.612.141.471.513.665.2]The process from soft order to delivery is captured in the figure below.
25 In the Terwiesch et al. (2005) case, on average, buyers tend to place more soft orders than actual purchase orders. Their aim was to identify patterns of shared order forecasting that lead to on-time tool delivery. As can be seen in Figure 12, the delivery time is lower than the combined manufacturing and shipment lead-time. Therefore, if an order is to be delivered on-time, a supplier should be working on an order before the actual purchase order has been issued.
Sharing the latest forecast information with the supplier seems like a reasonable action, but from the supplier’s point of view this is disturbing and viewed as less reliable information. Suppliers will thus act upon shared forecasts on the moment these forecasts are stabilized.
3.7. LEAD-TIME REDUCTION
Improved logistics integration yields lead-time reduction (Prajogo & Olhager, 2012). By shortening the lead-time, safety stocks can be lowered, the losses caused by stock outs can be improved as well as customer service level and the competition ability in business (Pan & Yang, 2002).
A good vendor will work with a purchaser closely to reduce lead-time as much as possible down to a point where it is acceptable to the purchaser, and also reasonable for the vendor to maintain a stable production and delivery schedule (Pan & Yang, 2002). To discuss the optimal balance supplier development initiatives can be initiated like those discussed in section 3.4.
Simchi-Levi et al. (2009) also state lead-time reduction has as benefit that supply chain uncertainty also reduces. Other benefits are the ability to quickly fill customer orders that can’t be filled from stock, less finished goods inventory and an increase in forecast accuracy due to the shortened forecast horizon.
As Krause et al (2007) also stated, lead-time reduction is discovered as a trend of operational strategy and given the benefits of a reduced lead-time that doesn’t seem weird. Fisher (1997) also states that the correct strategy within a company that provides innovative products is to aggressively invest in ways to reduce lead-times.
In the previous sections multiple factorials of increase or decrease in lead-time have been discussed. These factorials are summarized below:
Forecast inaccuracy leads to inappropriate high lead-times. Increasing forecast accuracy thus yields a decrease in lead-time.
Strategic partnerships and supply contracts give the opportunity to specify flexibility requirements under which can be collaborated.
A flexible supply chain has the benefit a being able to respond quicker to market adaptions, this rapid response is a factor of short lead-time. To obtain a flexible supply network a supply flexibility portfolio can be used.
26 3.8. SUMMARY
27
4.
DESCRIBING THE CURRENT SITUATION
Now that we discussed different views generated by researchers, it’s time to investigate the current situation at Benchmark. After the identification of Benchmark’s practices, these practices need to be assessed based on literature and opinions of the stakeholders. Also, it’s time to dig into some corporate protocols regarding Benchmark Corporate and Benchmark Almelo. The focus will be on BAM, delivery performance measures and supply time reduction.
4.1. BAM
For performance monitoring and continuous improvement, Benchmark uses Benchmark Accountability Management (BAM). At the BAM, different reports are being presented across five different tiers:
1. Tier 1 BAM meetings will consist of manufacturing cells.
2. Tier 2 BAM meetings will be second level manufacturing for sites that have manufacturing supervisors managing multiple cells or managing multiple supervisors.
3. Tier 3 BAM meetings will be used for Customer Focus Teams. 4. Tier 4 BAM meetings will be used for internal department meetings. 5. Tier 5 will be the site General Manager and het direct reports.
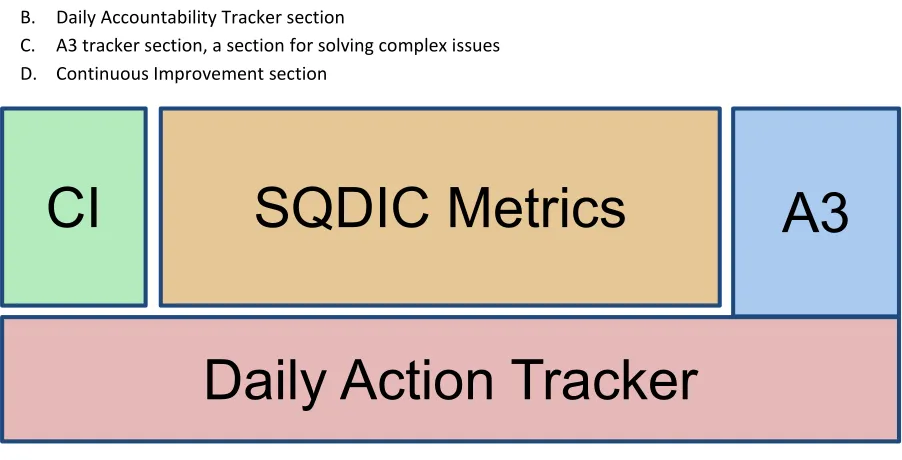
Within the BAM meetings, different reports are being presented every day. These are located on the BAM board of the given tier. It is built up out of 4 different components, which are divided like in figure 1. The 4 components will be explained individually, but are listed below.
A. Safety, Quality, Delivery, Inventory and Costs (SQDIC) section B. Daily Accountability Tracker section
[image:28.612.80.531.400.630.2]C. A3 tracker section, a section for solving complex issues D. Continuous Improvement section
Figure 13 - BAM Board
SQDIC Metrics
CI
Daily Action Tracker
28
A. SQDIC SECTION
[image:29.612.77.535.189.373.2]The SQDIC-section is the section in which the reports are found. These are divided in 5 different categories: Safety, Quality, Delivery, Inventory and Costs. Within these categories metrics are defined to monitor the performance within the given Tier. The metrics start with the corporate goals and flow down all the way to the manufacturing cell metrics in Tier 1. The only exception is at Tier 4, the internal department Tier. Only within the Engineering and Warehouse Department the metrics are defined at a corporate level. The metrics are posted on a wall that looks like in figure 2 and are then discussed in the BAM meeting.
Figure 14 - SQDIC metrics
Because these reports are meant to monitor current performance and rate it, Benchmark uses the so called traffic light system. Within the KPIs a double target is set, an amber target and a red target. If performance is better than all targets a green smiley is shown, if performance is worse than all targets a red smiley is shown and if it’s in between an amber smiley is shown.
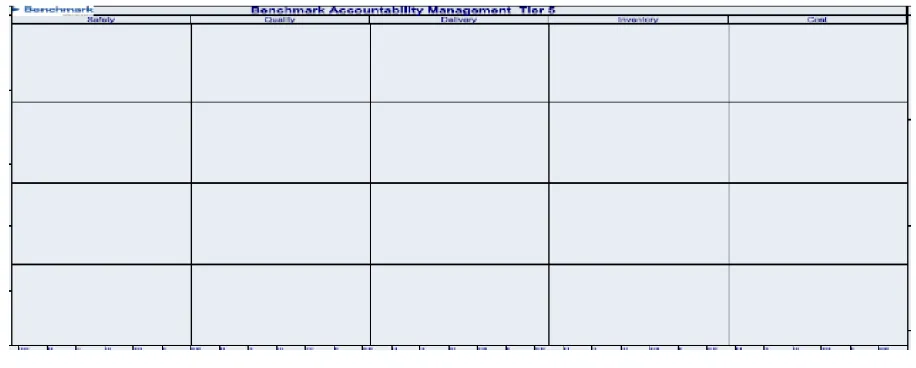
B. DAILY ACCOUNTABILITY TRACKER (DAT) BOARD
The Daily Accountability Tracker (DAT) Board shown in figure 3 is used to track specific tasks needed to ensure that the Tier team can meet the tactical SQDIC objectives.
Figure 15 - DAT Board
[image:29.612.115.498.524.581.2]29
C. A3 SECTION
An A3 can be used wherever there is a need for people to work together to get clarity on a problem or proposal and then to create a set of realistic and effective countermeasures. A3s can be prepared by individuals, teams, or any leader with his or her reports.
The method in which the A3 is formatted is the main and most important message. You will need to follow the PDCA in these steps:
1. Situation or the Story 2. Plan
3. Do
4. Check or Learn 5. Act
The goal is to capture an entire improvement idea on one sheet of paper. Visuals are preferred to using words on the A3, making the document very easy to understand and enable quick decision making. If this procedure needs to come in place at Benchmark, a KPI is added to the SQDIC section. This seems to work just fine as well, but it’s hardly used.
D. CONTINUOUS IMPROVEMENT SECTION (CI-SECTION)
The Continuous Improvement (CI)-section of the BAM Board is being used to elicit employee suggestions for improvement ideas, and suggestions are submitted on a simple task slip (normally colored to identify them as CI suggestions). The CI Board should be an integral part of the weekly BAM operating system, but it’s most certainly not.
Improvement suggestions are placed by employees in the top quadrant of the CI board and are reviewed weekly during the BAM. Once reviewed, the team should be putting the suggestions in one of these quadrants.
Actions In-Progress: Once agreed to, the CI suggestion should be assigned (by name) and briefed weekly as part of the CI Board review process. Once completed, the CI suggestion should be filed as a record of the action taken.
Parking Lot: Since these ideas are not declined, they should be reviewed periodically to move into the Actions In-Process quadrant.
Declined: Suggestions that are declined by the team should be reviewed with the individual submitting the idea to see if the idea can be recast or revised for resubmission and to encourage him/her to continue to submit ideas for gaining better operational efficiency, mistake proofing, etc. Care should be taken to ensure that the rejections are not done in a way that discourages future submissions. After review with the individual, these suggestions will be removed from board.
4.2. DELIVERY PERFORMANCE MEASURES
30 This information is spread across the different tiers within the company. For example, Program Managers need to obtain the quoted lead-times to inform the customers upon its flexibility possibilities. It’s possible to access this data within a report, after a few different data selections. To gain insights on the delivery time reports, they will be discussed below.
4.2.1. ON TIME DELIVERY PERFORMANCE
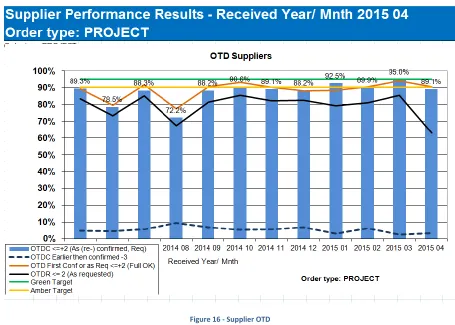
[image:31.612.76.531.225.550.2]The OTD Performance report is divided in 6 different charts/tables. One of them is misplaced within the reporting structure, because the base data is used for the full supplier balanced scorecard evaluation. Because the chart evaluates the quality performance, this chart is left out of discussion. The other charts and tables will be discussed, starting with the only chart shown in Figure 16.
Figure 16 - Supplier OTD
This chart shows a variety of measures, as can be seen in the legend. However, only one percentage is being shown within the chart. This is the percentage measuring the On Time Delivery to Confirmation (OTDC), based upon the latest confirmation date. In case a Purchase Order (PO) remains unconfirmed, the requested date is used for measurement. A PO is marked ‘On Time’ if the delivery is received within -3 to 2 days from the confirmation date. This is the delivery date based upon the day the received item is taken into stock.
31 Figure 17 - Supplier OTD table
The items contributing to the downgrading of the OTD-grade because of lateness are highlighted in Figure 17, which is a table given next to the chart in Figure 16. For the sake of supplier anonymity the names of the suppliers have been deleted from the table. A lot of information can be obtained by reading the table. The instant question that arises is which of these percentages are relevant and what do they tell about the supplier’s performance in the given period?
1. The amount of delivered order lines with the value of these order lines
2. The amount of confirmed order lines, with a percentage of the order confirmations
3. The OTD, based upon the first confirmation date, or the requested date in case the order remains unconfirmed. Given is the amount of order lines that are in time, together with its percentage.
4. The amount of order lines that is delivered too early, according to the OTDC, together with its percentage. 5. The amount of order lines that is delivered too late, according to the OTDC, together with its percentage. 6. The OTDC-amount of order lines and percentage.
7. The OTD to Requested date (OTDR), with amount and percentage
8. The percentage of order lines containing Non-Conforming Material (NCM)
9. Another column containing the amount of too late delivered order lines according to the OTDC-measure, highlighted in red color, to show that it’s the amount to be discussed.
10. The amount and percentage of order lines that have been delivered according to the mutually agreed upon lead-time. For this measure, the following is being checked:
𝐷𝑒𝑙𝑖𝑣𝑒𝑟𝑦 𝑑𝑎𝑡𝑒 − 𝑜𝑟𝑑𝑒𝑟 𝑑𝑎𝑡𝑒 ≤ 𝑄𝑢𝑜𝑡𝑒𝑑 𝑑𝑒𝑙𝑖𝑣𝑒𝑟𝑦 𝑙𝑒𝑎𝑑 𝑡𝑖𝑚𝑒?
If this is the case, a supplier has performed correctly according to the lead-time expectations. If this is not the case, a supplier has failed to order according to the quoted delivery lead-time.
This is just one out of four tables containing information. The others are summarized below, since they are equal for table headers:
A trend table of the top 12 high to low: This is a summation of the last 12 time units. This is to keep track of the more structural underperformers.
A top 12 table of the suppliers that caused disturbances in the OTD-performance because of delivering items too early. There is one difference in table headers between this table and Figure 17. The difference is in the field that has been marked in red. In this table the amount highlighted in red concerns the deliveries that have been too early.
32
[image:33.612.78.537.85.432.2]4.2.2. ITEM LEAD-TIME QUOTATIONS
Figure 18 - Item Lead-time Graph
In the Item Lead-time Graph the percentage of the total item count, excluding items with signal code NPR, are set out against axes of percentage and time weeks. Also, the value total of those items is set out against the lead-time weeks. In the chart, two vertical lines are represented. These are the corporate targets of the item lead-lead-time quotation performance. Within this report there are also two extra tables, which are given in Figure 19 and Figure 20.
[image:33.612.172.444.542.694.2]33 For the sake of anonymity the cells with names have been made blank. Except for the standard business partner code SCN000002, which is the default supplier if an item number doesn’t have a registered supplier yet, or item settings might have changed. It shows the top 15 suppliers based upon the percentage of lead-time impact (% LT Impact). The total lead-time impact of a supplier is calculated as 𝑆𝑢𝑝𝑝𝑙𝑖𝑒𝑟 𝐿𝑇 𝐼𝑚𝑝𝑎𝑐𝑡 = #𝐼𝑡𝑒𝑚𝑠 ∗ 𝐴𝑣𝑔 𝐿𝑇 𝑊𝑒𝑒𝑘𝑠. The percentage of the lead-time impact is then calculated as % 𝐿𝑇 𝐼𝑚𝑝𝑎𝑐𝑡 =∑ 𝑆𝑢𝑝𝑝𝑙𝑖𝑒𝑟 𝐿𝑇 𝐼𝑚𝑝𝑎𝑐𝑡𝑆𝑢𝑝𝑝𝑙𝑖𝑒𝑟 𝐿𝑇 𝐼𝑚𝑝𝑎𝑐𝑡 . The only filter that
applies to this is the NPR signal code. The Lead-time Priorities will be discussed later in this report.
It can be seen the number of item codes SCN000002 is fairly high, containing 22929924∗ 100% ≈ 23% at the moment of
[image:34.612.156.458.228.407.2]making the screenshot of the report. Even though this may seem like a lot (and it is a lot), it’s explainable due to the fact of the transfer of a new Thales product line. This is left out of further discussion.
Figure 20 - Liability Priorities
Both of these priorities aren’t really actionable. The LT priorities make no sense, because the items below 4 weeks aren’t filtered. The liability priorities only summarize the monetary impact of a supplier. Not really actionable as it is.
[image:34.612.148.464.489.695.2]34 In Figure 21, information can be won regarding the lead-time percentages per product line. The item lead-times are divided in categories, and the given percentages are item codes per product line. These lead-times are of importance for Program Managers, to communicate supply possibilities for the items of these customers. They however do not appear in the
OPEN PURCHASE ORDERS (POS)/EXPEDITING LIST
[image:35.612.80.535.238.494.2]Since Benchmark strives to maintain a flexible supply chain, the purchasers needs to get operating signals. These signals a summarized in a pivot table and shown at the BAM-meetings as a delivery KPI using a pivot chart and this table by buyer of project line. This KPI is shown in Figure 22. As can be seen there are quite some actions to be undertaken, with a total of 1521 PO lines that need action on a total of 2574 PO lines. These actions vary in need. The actions that have a need for a flexible supply chain are listed in Table 2.
Figure 22 - Open PO/Expediting List
Action Why is the signal generated?
Need earlier Customers update their forecasts regularly. It could thus very well be that their sales plan has increased the sales and they need the product earlier. One of the consequences might be a PO line is needed earlier. If a part is needed earlier, suppliers thus have to be contacted.
Showstopper A showstopper in this report is a PO that is needed earlier, but with the need earlier date that is today or earlier. These POs are thus very urgent!
Cancel (Partly) An other thing that might happen is that a customer might cancel an PO because of a PO they are not going to sell anymore. This has consequences for the Benchmark’s