University of Warwick institutional repository
This paper is made available online in accordance with
publisher policies. Please scroll down to view the document
itself. Please refer to the repository record for this item and our
policy information available from the repository home page for
further information.
To see the final version of this paper please visit the publisher’s website.
Access to the published version may require a subscription.
Author(s:
Robert Froud, Sandra Eldridge, Ranjit Lall and Martin
Underwood
Article Title: Estimating the number needed to treat from continuous
outcomes in randomised controlled trials: methodological challenges
and worked example using data from the UK Back Pain Exercise and
Manipulation (BEAM) trial
Year of publication: 2009
Link to published version: http://dxd.doi.org/
Publisher statement: None
BioMedCentral
BMC Medical Research
Methodology
Open Access
Research article
Estimating the number needed to treat from continuous outcomes
in randomised controlled trials: methodological challenges and
worked example using data from the UK Back Pain Exercise and
Manipulation (BEAM) trial
Robert Froud*
1, Sandra Eldridge
1, Ranjit Lall
2and Martin Underwood
2Address: 1Centre for Health Sciences, Barts and the London School of Medicine and Dentistry, London, E1 2AT, UK and 2Warwick Clinical Trials
Unit, Warwick Medical School, Gibbet Hill Road, Coventry, CV4 7AL, UK
Email: Robert Froud* - [email protected]; Sandra Eldridge - [email protected]; Ranjit Lall - [email protected]; Martin Underwood - [email protected]
* Corresponding author
Abstract
Background: Reporting numbers needed to treat (NNT) improves interpretability of trial results. It is unusual that continuous outcomes are converted to numbers of individual responders to treatment (i.e., those who reach a particular threshold of change); and deteriorations prevented are only rarely considered. We consider how numbers needed to treat can be derived from continuous outcomes; illustrated with a worked example showing the methods and challenges.
Methods: We used data from the UK BEAM trial (n = 1, 334) of physical treatments for back pain; originally reported as showing, at best, small to moderate benefits. Participants were randomised to receive 'best care' in general practice, the comparator treatment, or one of three manual and/ or exercise treatments: 'best care' plus manipulation, exercise, or manipulation followed by exercise. We used established consensus thresholds for improvement in Roland-Morris disability questionnaire scores at three and twelve months to derive NNTs for improvements and for benefits (improvements gained+deteriorations prevented).
Results: At three months, NNT estimates ranged from 5.1 (95% CI 3.4 to 10.7) to 9.0 (5.0 to 45.5) for exercise, 5.0 (3.4 to 9.8) to 5.4 (3.8 to 9.9) for manipulation, and 3.3 (2.5 to 4.9) to 4.8 (3.5 to 7.8) for manipulation followed by exercise. Corresponding between-group mean differences in the Roland-Morris disability questionnaire were 1.6 (0.8 to 2.3), 1.4 (0.6 to 2.1), and 1.9 (1.2 to 2.6) points.
Conclusion: In contrast to small mean differences originally reported, NNTs were small and could be attractive to clinicians, patients, and purchasers. NNTs can aid the interpretation of results of trials using continuous outcomes. Where possible, these should be reported alongside mean differences. Challenges remain in calculating NNTs for some continuous outcomes.
Trial Registration: UK BEAM trial registration: ISRCTN32683578. Published: 11 June 2009
BMC Medical Research Methodology 2009, 9:35 doi:10.1186/1471-2288-9-35
Received: 10 November 2008 Accepted: 11 June 2009
This article is available from: http://www.biomedcentral.com/1471-2288/9/35
© 2009 Froud et al; licensee BioMed Central Ltd.
Background
Measurement, and reporting, of clinical outcomes is cru-cial to interpretation of randomised controlled trials. The clinical importance of some outcomes, such as death, is usually fairly clear. However, the clinical importance of differences found in patient-reported continuous out-comes, used to assess chronic disorders with variable courses, such as low back pain, is often less clear. With ever-larger trials, and meta-analyses of data from multiple trials, we have the statistical power to demonstrate quite small mean differences in these outcome measures that are unlikely to have arisen by chance. However, the inter-pretation of clinical importance remains problematic. Summary statistics are, through statistical inference, appli-cable to a population but results from these studies may be less useful if we want to apply them to an individual. For example, a 5 mm Hg change in blood pressure may be important at a population level but of little relevance to an individual. [1] For chronic disorders with variable courses, the importance of small mean differences in con-tinuous primary outcome measures of interest is less clear. In early 2008 there was considerable media interest in the UK in a meta-analysis of Selective Serotonin Reuptake Inhibitors (SSRIs) that was reported as demonstrating that these were not effective for the treatment of mild to mod-erate depression http://news.bbc.co.uk/2/hi/health/ 7263494.stm. [2] This paper has been very influential in informing popular opinion about the use of Selective Serotonin Reuptake Inhibitors, but it contrasts with an earlier meta-analysis in which a similarly small standard-ised effect size was reported (0.31 compared with 0.32) and the authors concluded that these were superior to pla-cebo. [3,4] It has been suggested that the discord between conclusions stemmed from the use of a standardised effect size to judge clinically important change. [4] Standardised effect sizes, calculated as the between-group mean differ-ence divided by the standard deviation at baseline, are one approach to quantifying effect sizes in trials. Convention-ally, 0.2 is considered small, 0.5 medium, and 0.8 large. [5] This approach is widely used to define the magnitude of changes in variables that can be readily observed. Although there is generally a close relationship between the standardised effect size and the proportion of partici-pants who benefit from treatment, [6] this may not always be the case. [7]
Thresholds of minimally important change (MIC) are often used to judge the clinical importance of between-group mean differences. However, simply dichotomising group change as clinically important or not, does not tell us how many individuals benefit from a treatment. Guyatt and colleagues, [7] in 1998, demonstrated the usefulness of assessing individual improvement by considering the example of a trial with a mean effect of 0.25 units on a
continuous outcome scale, where the MIC for an individ-ual is 0.5 units. This could represent a situation in which the intervention has no effect in 75% of participants, whilst 25% improve by 1.0 unit, implying that on average one in every four participants treated would gain a clini-cally important change; the number needed to treat (NNT) is four. When only the mean difference is pre-sented, which is half the magnitude of the MIC for an individual, the intervention is likely to be interpreted as ineffective. In contrast, an NNT of four suggests a highly effective treatment.
How outcomes are presented, can have a substantial effect on the interpretation of results. [8] However, many authors still use only one method. Adding an estimate of the NNT to gain, on average, one additional improve-ment, may aid interpretation of trials with continuous outcomes that are not intuitively understandable to patients, clinicians, and purchasers; few authors do this. Furthermore, for many common disorders, such as back pain, depression, chronic fatigue, etc, it may be just as important to prevent deteriorations as it is to promote improvement; but few authors who report NNT consider this. We aimed to explore practical challenges of using the NNT to report a patient-reported continuous outcome in a way that is clear to end-users and to explore its implica-tions on the interpretation of a previously reported trial. We report a re-analysis of data from the UK Back Pain Exercise and Manipulation (UK BEAM) trial. [9] The larg-est benefit from any of the treatments in UK BEAM was 1.87 points on the Roland-Morris disability questionnaire (RMDQ), [10] at three months (a standardised mean dif-ference of 0.47). This is smaller than the 2.5 point between-group difference used for the sample size calcu-lation and it has since been argued that, in light of this, the benefits found in UK BEAM were not clinically important. [11]
In this re-analysis we estimated the NNT for one patient to gain a clinically important improvement and for one patient to receive a benefit, defined as either an improve-ment gained or deterioration prevented.
Methods
The UK BEAM trial is reported in detail elsewhere. [12] Briefly, 1,334 participants with low back pain lasting for more than four weeks were recruited from 181 practices in the Medical Research Council General Practice Research Framework. They were randomised between the following interventions.
BMC Medical Research Methodology 2009, 9:35 http://www.biomedcentral.com/1471-2288/9/35
[13,14]Exercise programme – An initial assessment and up to nine exercise classes led by physiotherapists in commu-nity settings. [15]
Spinal manipulation package – The UK chiropractic, osteo-pathic, and physiotherapy professions agreed to use a package of techniques, during eight sessions over 12 weeks. [16]
Combined treatment – Participants received six weeks of manipulation followed by six weeks of exercise. Treat-ments were those given to the manipulation only or exer-cise only groups.
Outcome measures
UK BEAM's primary end point was the change in the RMDQ from baseline to follow-up. [10] This 24-item questionnaire measuring disability is one of the most commonly used outcome measures in trials of back pain. Scores range from 0 to 24; higher scores indicate greater disability. A secondary outcome in UK BEAM was the par-ticipants' global perception of change indicated on a health transition question, a single item asking partici-pants if they have experienced improvement or deteriora-tion in their low back pain since beginning treatment. [17] It has seven possible responses: 1. completely recov-ered, 2. much improved, 3. slightly improved, 4. no change, 5. slightly worsened, 6. much worsened, and 7. vastly worsened. Follow-up was at four weeks, three and 12 months by postal questionnaire. Analyses were based on mean differences between intervention groups and the comparator treatment group. There were no differences between groups at four weeks. Statistically significant pos-itive results were observed for all three interventions at three months, and for manipulation and combined treat-ment at 12 months (Table 1). Our new analyses are intended to aid interpretation of results unlikely to have arisen by chance, not to change conclusions. We have therefore focused on outcomes that were statistically sig-nificant in the original analysis.
Individual improvement
The measurement precision of the outcome of interest is important when judging the threshold for individual change (whether it is deterioration or improvement). [18] Clinicians are familiar with the concept of taking three blood pressure measurement readings to assess whether individuals are over a treatment threshold for hyperten-sion; this limits measurement error due to the instru-ment's imprecision and within person variation. The measurement error, of any instrument, is inversely pro-portional to the number of measurements; either repeated measures on an individual or participants measured in the group. The minimal detectable change is dependent on measurement error, and thus depends on the number of measurements. Trials can be designed so that the minimal detectable change, is less than the threshold of minimally
important change ((MIC) i.e., a magnitude of change that may be considered patient-important). [19-21] However, at an individual level, there is evidence that the minimal detectable change on the RMDQ is larger than the MIC. [19,22-24] This leads to difficulty choosing a threshold by which to judge individual improvement; adopting mini-mal detectable change as a proxy for importance may not lead to meaningful results; too few participants achieve such large changes. One suggestion is that we measure patients on multiple occasions before and after treat-ment—this is similar to the approach for measuring blood pressure. However, this may be impractical in stud-ies of low back pain, where a questionnaire is used to assess participants' change.
Similar MIC thresholds on the RMDQ have been identi-fied from different populations using receiver operator characteristic (ROC) curves. [19,23-27] In 2008, after reviewing a mix of literature on the instrument's MIC and minimal detectable change, a group of experts agreed five RMDQ points represented an appropriate threshold by which to judge individual improvement. [28] A further challenge, is that the absolute magnitude of MIC on the RMDQ may increase with baseline severity; [22,23,25,29]
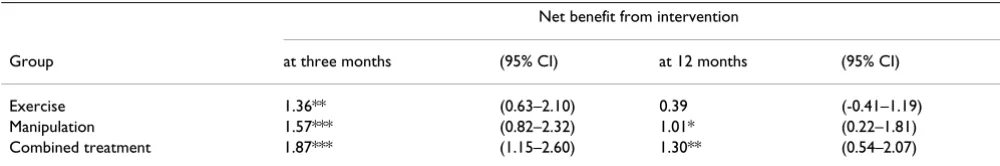
Table 1: Roland-Morris score decrease in the UK BEAM trial
Net benefit from intervention
Group at three months (95% CI) at 12 months (95% CI)
Exercise 1.36** (0.63–2.10) 0.39 (-0.41–1.19)
Manipulation 1.57*** (0.82–2.32) 1.01* (0.22–1.81)
Combined treatment 1.87*** (1.15–2.60) 1.30** (0.54–2.07)
Adapted from UK BEAM BMJ 2004;329:1377–81 * Significant at 5% level
this could mean that the MIC for more severely affected participants is larger, or it could be wholly or partly, an artifact due to regression to the mean. To account for this, the group suggested a ≥ 30% improvement from baseline as an alternative threshold for judging individual improvement. [28] It is these values that we have used in our analyses.
Population-specific comparison
To ensure that it was appropriate to apply the consensus threshold of five points (change from baseline), we exam-ined the MIC and the minimal detectable change in the UK BEAM population. We used ROC curves, using the transition question as the external criterion, to estimate MIC. We categorised participants as improved if their response to the transition question was 'completely recov-ered' or 'much improved' [30] and defined MIC as the cut-point on the RMDQ corresponding to the highest combi-nation of sensitivity and specificity. [31] We estimated minimal detectable change from the within person and residual error of stable (neither improving nor deteriorat-ing) patients' repeated measurements, between baseline and four weeks (see Additional File 1). [20,32] The four week follow-up data were not used in the original BEAM analysis. We estimated minimal detectable change using RMDQ data from those participants who indicated 'no change' on the transition question at four weeks. To fur-ther examine the stability of these participants, we tested for a difference in their RMDQ scores, between baseline and four weeks using Student's t test.
Guyatt et al [33] suggest that correlations of less than 0.5 between the change in health related quality of life (HRQoL) score and the transition question, provide grounds for doubting the construct validity of the transi-tion questransi-tion. Criticisms of using transitransi-tion questransi-tions are that the rating is likely to be highly correlated with the fol-low-up health state, and that respondents may not cor-rectly recall their initial health state (i.e., the baseline score). To ensure that the transition question is measuring change, and not merely reflecting current health states, a correlation between baseline score and the transition question, and follow-up score and the transition question should ideally be present, equal, and opposite. [33] In addition, in a linear regression model with follow-up score entered as the initial explanatory variable, the base-line score should explain a significant proportion of the residual variance in the transition rating. [33] Thus, in order to explore the validity of our transition question, we calculated Pearson's correlation coefficient between base-line and follow-up RMDQ scores, the change in RMDQ score and the transition question, the baseline score and the transition question, and the follow-up scores and the
transition question. Also, we constructed linear regression models, in which the transition question was entered as the dependent variable, and the follow-up scores as the explanatory variables. Subsequently, we added the base-line score to the models. Because of the large number of comparisons, we considered a probability less than 0.01 statistically significant. We performed all analyses using STATA version 10.
Calculating NNT
We calculated the NNT using the RMDQ for all compari-sons with a statistically significant difference in the origi-nal aorigi-nalysis. We used two methods of calculation; method one, improvements gained, and method two, benefits gained (improvements gained+deteriorations prevented).
Method one-additional improvements gained
We subtracted the proportion of patients who improved in the control group from those who improved in the intervention group (absolute risk reduction). We then inverted this to obtain the NNT, and calculated 95% con-fidence intervals using Bender's method, which is based on Wilson scores. [34] The conventional method for cal-culating 95% confidence intervals for NNTs is based on the simple Wald method, which yields confidence inter-vals that are, in many cases, too narrow. [34] The applica-tion of Wilson score method improves the calculaapplica-tion and presentation of the confidence intervals (See Additional File 1). For the RMDQ we estimated improvements gained using both a five-point reduction between baseline and three months score, and a proportional reduction of
≥ 30% in the baseline score.
Method two-benefits gained
To incorporate deteriorations prevented, we calculated the difference in the proportion of improvements minus deteriorations in the intervention group and improve-ments minus deteriorations in the control group. [35] We then inverted the resulting absolute risk reduction to obtain the NNT. We modified Bender's method of calcu-lating 95% confidence intervals for NNT, to incorporate the extra variance terms introduced through considering both improvements and deteriorations (see Additional File 1).
There-BMC Medical Research Methodology 2009, 9:35 http://www.biomedcentral.com/1471-2288/9/35
fore, we adopted a ≥ five-point deterioration and a ≥ 30% proportional increase in baseline score, as thresholds for deterioration.
Results
At three months, complete RMDQ and transition ques-tions were available on 1027/1334 (77%) and 882/1334 (66%) participants respectively. Figure 1 shows the distri-butions of the RMDQ scores reduction; patents who reported deterioration on the health transition question had a mean decrease of 0.4 RMDQ points. At 12 months, data were available on 994/1334 (75%) and 990/1334 (74%) participants; 640/1334 (48%) participants indi-cated 'No change' at four weeks. The MIC and minimal detectable change in our population were 4.0 (5.0 using
12 month data) and 8.1 points respectively. Participants who indicated 'No change' at four weeks had a baseline score of 8.5 RMDQ points (SD = 3.9) and a four week fol-low-up score of 6.6 (SD = 4.6), P < 0.001).
Pearson's correlation coefficient between the baseline and follow-up RMDQ scores was 0.52 (P < 0.001) at three months and 0.50 (P < 0.001) at one year. The correlation between the change in RMDQ score and the transition question was 0.49 (P < 0.001) at three months, and 0.57 (P < 0.001) at one year. The correlations between the base-line RMDQ score and the transition question were 0.17 (P
< 0.001) at three months and 0.22 (P < 0.001) at one year. Correlations between the RMDQ follow-up scores and the transition question were 0.57 (P < 0.001) at three months,
Score distributions of deteriorating, stable, and improving patients
Figure 1
and 0.67 (P < 0.001) at one year. The mean RMDQ score at baseline was 9.0 with an SD of 4.0, at three months it was 5.5 with an SD of 5.0, and at one year it was 5.4 with an SD of 5.2. In a linear regression model, the RMDQ fol-low-up score at three months explained 33% of the vari-ance in transition question rating at three months (β = 0.144, P < 0.001; the addition of the baseline score to the model was significant and explained an extra 2% of the variance (β= -0.056, P < 0.001). At one year, the RMDQ follow-up score explained 45% of the variance in the tran-sition question rating (β= 0.178, P < 0.001); the addition of baseline score to the model was significant and explained a further 2% of the variance (β= -0.058, P < 0.001).
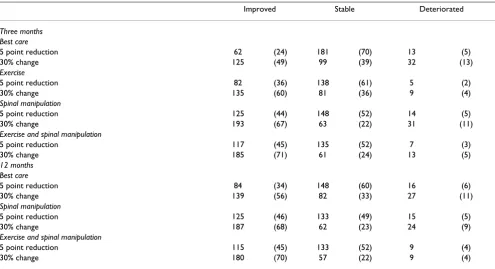
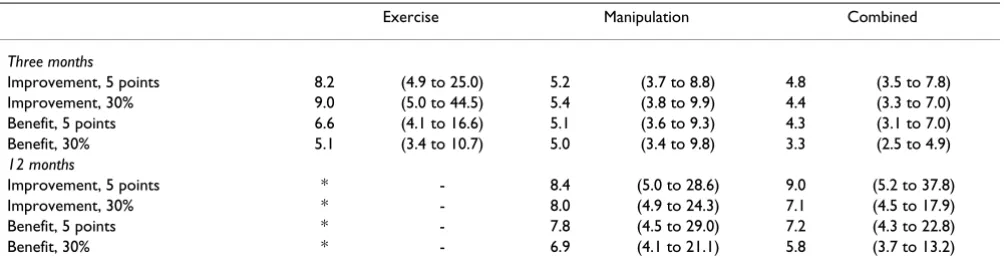
Table 2 shows the numbers and proportion of partici-pants who improved in each group using either five-points or 30% change as thresholds marking responders to treatment. Methods for calculating 'benefit' and 'improvement' produced similar NNTs using either five-points or 30% change thresholds (Table 3). The ranked effectiveness of the interventions followed the original analysis (Table 1): the largest effect was seen in the com-bined treatment group, and the smallest in the exercise group.
At 12 months, effect sizes were smaller and similar in each group (Table 3).
Discussion
These new analyses aid interpretation of the trial results. Our analyses illustrate how the practical challenges of incorporating deterioration and allowing for measure-ment error might be overcome when basing NNTs on patient-reported continuous outcomes. Nevertheless, we were unable to develop a robust threshold for deteriora-tion.
The striking finding here is that, in contrast to the original analysis suggesting at best a small to moderate benefit from the active interventions (Table 1), the NNTs to achieve an improvement/benefit on the RMDQ were small. Even for manipulation at one year, which had the smallest of the statistically significant mean effects, the NNT could be attractive to clinicians, patients, and pur-chasers. Notably referring only five to six patients for the manipulation package, on average will yield one addi-tional improvement at three months, and, using the most conservative of our estimates, eight to nine referrals, on average will yield additional improvement at one year. There is little difference in NNTs resulting from methods one and two, suggesting that in this case, the active inter-ventions had little effect on preventing or increasing dete-riorations.
[image:7.612.59.554.447.716.2]It is not ideal that our transition question ratings correlate moderately with follow-up scores, and slightly but in the
Table 2: Numbers (%) of improved and deteriorated patients
Improved Stable Deteriorated
Three months Best care
5 point reduction 62 (24) 181 (70) 13 (5)
30% change 125 (49) 99 (39) 32 (13)
Exercise
5 point reduction 82 (36) 138 (61) 5 (2)
30% change 135 (60) 81 (36) 9 (4)
Spinal manipulation
5 point reduction 125 (44) 148 (52) 14 (5)
30% change 193 (67) 63 (22) 31 (11)
Exercise and spinal manipulation
5 point reduction 117 (45) 135 (52) 7 (3)
30% change 185 (71) 61 (24) 13 (5)
12 months Best care
5 point reduction 84 (34) 148 (60) 16 (6)
30% change 139 (56) 82 (33) 27 (11)
Spinal manipulation
5 point reduction 125 (46) 133 (49) 15 (5)
30% change 187 (68) 62 (23) 24 (9)
Exercise and spinal manipulation
5 point reduction 115 (45) 133 (52) 9 (4)
BMC Medical Research Methodology 2009, 9:35 http://www.biomedcentral.com/1471-2288/9/35
same direction with the baseline score; nevertheless this is not an unusual finding. [33,36] The baseline RMDQ score significantly explained 2% of the residual variance in tran-sition rating in the regression models we fitted. However, this is a trivial proportion. In addition, we found the cor-relation between the follow-up score and the transition question was greater than the correlation between the change score and the transition question. These findings suggest that participants' health status at the time of fol-low-up may have been the prime driver of their response to the transition question.
The poor performance of the transition question may have led to inaccurate estimates of MIC and minimal detectable change, as both of these rely upon the transi-tion rating to identify improved or stable patients. How-ever, our estimated MIC value of 4.0 points, falls within the 3.0 to 5.0 range of values reported in other studies using similar methods; [19,22-27] and our minimal detectable change estimate of 8.1 points, falls between the 5.4 to 12.1 range seen in other studies. [19,20,22-24,37] Moreover, both our MIC and minimal detectable change estimates fall within the 2.0 to 8.6 point range considered by the consensus study team. [28] Therefore, notwith-standing the questionable performance of our transition question, we applied the 5 point RMDQ consensus threshold to our population.
Figure 1 shows the distributions of score change for dete-riorated, stable and improved patients; it shows that the mean score change in patients who reported deterioration on the health transition question is close to zero. The MIC cut-off point for the highest combination of sensitivity and specificity corresponded to an improvement in RMDQ score, rather than a deterioration as one might expect. This suggests some degree of construct mismatch: participants may have learned to cope with their disability better, even though globally, they felt that their back pain deteriorated. Therefore we adopted the consensus
tudes we used to define improvement, as proxy magni-tudes for deterioration; however, we acknowledge that magnitudes for deterioration may not mimic those for improvement.
Other authors have considered using NNT to report con-tinuous outcome measures. [7,35,38,39] However, the methods propounded either base NNT calculations on group differences, [35,38,39] do not consider measure-ment error, [7,39] do not consider deteriorations, [38,39] or are not conducive to the derivation of confidence inter-vals. [7] Calculating NNT from individual improvements, rather than group differences, may more accurately describe the effects of treatment, especially when treat-ment response is heterogeneous. We have shown that the measurement error can be considered and incorporated into consensus of the change threshold. This threshold is therefore neither MIC, which can be estimated empirically from valid anchors (such as correctly functioning transi-tion questransi-tions), nor the minimally detectable change, which can be estimated from a variety of distribution methods (although we favour the method described in Additional File 1[20,32]), but a hybrid of these two prop-erties. A potential weakness of the approach we present to generating this hybrid is its reliance on expert consensus to define the thresholds for individual change. Neverthe-less, NNT has been shown to be remarkably robust to small variations in thresholds. [6]
[image:8.612.55.557.100.234.2]One drawback of using NNT is that statistical power is lost when converting scales to binary outcomes. [7] By virtue of the large sample sizes in UK BEAM, we were generally able to report NNTs with confidence intervals of reasona-ble widths. Although the simpler Wald method produces confidence intervals that are almost identical to those pre-sented, we prefer confidence intervals derived from Wil-son scores; [34] using Wald confidence intervals in studies with smaller sample sizes, or when NNTs are greater than 10 may result in aberrations or be too narrow. [34]
Table 3: NNTs derived from consensus thresholds for MIC for the RMDQ (95% CI)
Exercise Manipulation Combined
Three months
Improvement, 5 points 8.2 (4.9 to 25.0) 5.2 (3.7 to 8.8) 4.8 (3.5 to 7.8)
Improvement, 30% 9.0 (5.0 to 44.5) 5.4 (3.8 to 9.9) 4.4 (3.3 to 7.0)
Benefit, 5 points 6.6 (4.1 to 16.6) 5.1 (3.6 to 9.3) 4.3 (3.1 to 7.0)
Benefit, 30% 5.1 (3.4 to 10.7) 5.0 (3.4 to 9.8) 3.3 (2.5 to 4.9)
12 months
Improvement, 5 points * - 8.4 (5.0 to 28.6) 9.0 (5.2 to 37.8)
Improvement, 30% * - 8.0 (4.9 to 24.3) 7.1 (4.5 to 17.9)
Benefit, 5 points * - 7.8 (4.5 to 29.0) 7.2 (4.3 to 22.8)
Benefit, 30% * - 6.9 (4.1 to 21.1) 5.8 (3.7 to 13.2)
Senn [40] points out, that for continuous outcomes, which vary within persons as well as between persons, an NNT of four may indicate that 25% of patients are likely to benefit whenever the treatment is used or that all patients will benefit 25% of the time. Thus, we cannot iso-late individual patients who will benefit using this method; but this does not minimise the usefulness of NNT in aiding decisions about treatment use at a popula-tion level.
Wu and Kottke draw attention to other general limitations of NNT. [41] They show that it can be misleading to com-pare NNTs from different populations, using the example of an intervention for lowering serum cholesterol, which for preventing mortality, has an NNT around 1000 times larger than the NNT for cardiac transplantation. Thus, the intervention for lowering serum cholesterol appears to have a trivial effect compared to cardiac transplantation, and one may be inclined to believe cardiac transplanta-tion to be the more useful technology. However, the first NNT estimate pertains to the entire national population, whereas the second pertains to a population of cardiac transplant candidates. At the level of the entire popula-tion, the intervention for lowering serum cholesterol would have an impact on death rates five times greater than cardiac transplantation.
Wu and Kottke also point out that NNT is dependent on time. Consider that at four weeks the proportion of back pain patients improving in treatment group A is 20% and in treatment group B it is 10%; the relative risk is 0.5, and the NNT is 10. However, at six months if the proportion improving in group A is 40% and in group B it is 20%; the relative risk is still 0.5, but the NNT becomes five. Com-parisons across non-related time points can mislead. We agree with Gorouhi, that it is necessary to specify a time period in order to correctly interpret the NNT. [42]
We used the transition question to help us identify partic-ipants who remained stable between baseline and four weeks in an attempt to estimate the population-specific minimal detectable change. This has certain methodolog-ical shortcomings. Norman et al, [43] caution against ret-rospective classification of participants as improved or stable based on a transition question, explaining that it is possible for this to be unrelated to treatment effect. Also, as discussed above, participants' selection of 'No change' may be guided more by their health state at the time, which was subject to within person variation, than by their aggregate change since first measurement. In this study, participants who selected 'No change' on the tran-sition question at four weeks had decreasing RMDQ scores. In light of this, we must consider that our popula-tion-specific estimate of minimal detectable change could be inaccurate, and we recommend that in future, this
method of retrospectively identifying stable participants is generally avoided.
A number of our analyses were subject to floor and ceiling effects. For example using five points to define an impor-tant change, means that a patient with a RMDQ score of four (the lowest score permitted in UK BEAM) could not have reached the improvement threshold and patients with scores of greater than 19 could deteriorate. Similarly, when using the 30% change threshold, although there was no floor effect, participants with scores higher than 18 could not deteriorate. Sensitivity analyses (not presented here) allowing for these effects, produced results similar to our main analyses.
Whilst not wanting to make too much of a post-hoc re-analysis of these data, it is clear that the small NNTs we derived might, if confirmed, make manipulation very attractive to clinicians, patients, and purchasers. This is an important and new observation.
We have demonstrated that patient-reported continuous outcomes can be reported as NNTs; these aid interpreta-tion. US Food and Drug Administration guidance states that when clinical trials show small mean effect sizes it may be more informative to look at individual rather than group responses. [44] It also states that the definition of an individual 'responder' should be based on pre-speci-fied criteria backed by empirically derived evidence. Fol-lowing consensus on appropriate thresholds of individual change, analysis in the manner we describe is both facili-tated and the logical next step. This raises the extremely important question, as to whether reporting results in this way should be the norm in trials assessing disorders with chronic variable courses such as depression, back pain or chronic fatigue. If the same pattern we have shown here was seen in trials of Selective Serotonin Reuptake Inhibi-tors, then in contrast with the conclusions of Kirsch and colleagues, [2] we might conclude that they were good enough to justify their routine use for mild to moderate depression.
Future agreement on thresholds for deterioration would permit the estimation for NNT for benefits gained and a more comprehensive picture of the effect of treatment could be portrayed. In some instances, especially where desirable correlations can be established between the HRQoL measure and the transition question, the transi-tion questransi-tion may be useful and aid interpretatransi-tion of out-comes.
BMC Medical Research Methodology 2009, 9:35 http://www.biomedcentral.com/1471-2288/9/35
occurrences, and which preserves statistical power. These analyses are complementary and aid clinical interpreta-tion. [7]
Conclusion
In contrast to the small mean differences originally reported, NNTs were small and could be attractive to cli-nicians, patients and purchasers. How results of clinical trials are presented could have important implications for how they are interpreted, and how their findings are implemented. Reporting outcomes of clinical trials using mean differences may not give a full picture of the effect of treatments on patient health, especially when the response to treatment is heterogeneous. Reporting the NNT is currently challenging due to difficulties in defining thresholds of individual improvement that encompass both within patient variation/measurement error and clinically important change. Where possible, trialists should consider reporting NNTs alongside mean differ-ences to aid interpretation.
Competing interests
RF is a practising osteopath. MU is the Chair of NICE low back pain Guideline Development Group and was a member of the UK BEAM study team.
Authors' contributions
RF participated in the conception of this new analysis, modification of the Wilson score method used by Bender (Newcombe's method 10), analysis of data, wrote the first draft, and contributed to its critical review. SE contributed to the design and analysis of the study, modification of the Wilson score method used by Bender (Newcombe's method 10), interpretation of results, and commented in detail on successive drafts of the paper. RL commented on the statistical analysis in the paper. MU generated funding for RF's studentship, participated in the conception of this new analysis, interpretation of the analyses, and has com-mented in detail on successive drafts of the paper. All authors read and approved the final manuscript.
Additional material
Acknowledgements
Thanks are due to Gordon Guyatt, Thomas Kottke, and Kamshwar Prasad, for their very useful comments on this paper; and to Mandy Hildebrandt
and Michal Vaillant for their comments on an earlier version. Thanks are also due to Barts and the London Charity for funding RF's PhD studentship.
References
1. Rose G: Individuals and populations. In The strategy of preventive medicine Oxford, United Kingdom: Oxford University Press; 1992:12,53-63,74.
2. Kirsch I, Deacon BJ, Huedo-Medina TB, Scoboria A, Moore TJ, John-son BT: Initial severity and antidepressant benefits: a meta-analysis of data submitted to the Food and Drug Administra-tion. PLoS Med 2008, 5(2):e45.
3. Turner EH, Matthews AM, Linardatos E, Tell RA, Rosenthal R: Selec-tive publication of antidepressant trials and its influence on apparent efficacy. N Engl J Med 2008, 358(3):252-60.
4. Turner EH, Rosenthal R: Efficacy of antidepressants. BMJ 2008,
336(7643):516-7.
5. Cohen J: Statistical power analysis for the behavioral sciences second edi-tion. Hillsdale, New Jersey: Lawrence Erlbaum Associates; 1988. 6. Norman GR, Sridhar FG, Guyatt GH, Walter SD: Relation of
distri-bution- and anchor-based approaches in interpretation of changes in health-related quality of life. Med Care 2001,
39(10):1039-47.
7. Guyatt GH, Juniper EF, Walter SD, Grifith LE, Goldstein RS: Inter-preting treatment effects in randomised trials. BMJ 1998,
316(7132):690-3.
8. Covey J: A meta-analysis of the effects of presenting treat-ment benefits in different formats. Medical Decision Making 2007, 27(5):638-654.
9. United Kingdom back pain exercise and manipulation (UK BEAM) randomised trial: Effectiveness of physical treat-ments for back pain in primary care. BMJ 2004,
329(7479):1377-1381.
10. Roland M, Morris R: A study of the natural history of back pain. Part I: development of a reliable and sensitive measure of disability in low-back pain. Spine 1983, 8(2):141-4.
11. Tveito TH, Eriksen HR: United Kingdom back pain exercise and manipulation (UK BEAM) trial: Is manipulation the most cost effective addition to "best care"? BMJ 2005,
330(7492):674.
12. UK Back pain Exercise and Manipulation (UK BEAM) trial a national randomised trial of physical treatments for back pain in primary care: objectives, design and interventions.
BMC Health services research 2003, 3(1):16.
13. Roland M, Waddel G, Klaber-Moffett J, Burton AK, Main C: The back book Norwich: The stationary office; 1996.
14. Underwood M, O'Meara S, Harvey E: The acceptability to pri-mary care staff of a multidisciplinary training package on acute back pain guidelines. Fam Pract 2002, 19(5):511-5. 15. Moffett JK, Frost H: Back to Fitness Programme. Physiotherapy
2000, 86:295-305.
16. Harvey E, Burton AK, Moffett JK, Breen A: Spinal manipulation for low-back pain: a treatment package agreed to by the UK chi-ropractic, osteopathy and physiotherapy professional associ-ations. Man Ther 2003, 8:46-51.
17. Beurskens A, de Vet H, Koke A: Responsiveness of functional status in low back pain: a comparison of different instru-ments. Pain 1996, 65:71-76.
18. de Vet HC, Terwee CB, Ostelo RW, Beckerman H, Knol DL, Bouter LM: Minimal changes in health status questionnaires: distinc-tion between minimally detectable change and minimally important change. Health Qual Life Outcomes 2006, 4:54. 19. de Vet HC, Bouter LM, Bezemer PD, Beurskens AJ: Reproducibility
and responsiveness of evaluative outcome measures. Int J Technol Assess Health Care 2001, 17(4):479-487.
20. Stratford PW: Using the Roland-Morris questionnaire to make decisions about patients. Physiotherapy Canada 1996, 48:107-110. 21. Guyatt G, Montori V, Devereaux PJ, Schunemann H, Bhandari M:
Patients at the center: in our practice, and in our use of lan-guage. ACP J Club 2004, 140:A11-2.
22. Jordan K, Dunn KM, Lewis M, Croft P: A minimal clinically impor-tant difference was derived for the Roland-Morris Disability Questionnaire for low back pain. J Clin Epidemiol 2006, 59:45-52. 23. Kovacs FM, Abraira V, Royuela A, Corcoll J, Alegre L, Cano A, Muriel A, Zamora J, del Real MT, Gestoso M, Mufraggi N: Minimal clini-cally important change for pain intensity and disability in
Additional file 1
Supplement. A word document detailing equations for both of the meth-ods described. Stata modules to perform these tasks are available from the corresponding author on request.
Click here for file
Publish with BioMed Central and every scientist can read your work free of charge "BioMed Central will be the most significant development for disseminating the results of biomedical researc h in our lifetime."
Sir Paul Nurse, Cancer Research UK
Your research papers will be:
available free of charge to the entire biomedical community
peer reviewed and published immediately upon acceptance
cited in PubMed and archived on PubMed Central
yours — you keep the copyright
Submit your manuscript here: BioMedcentral
patients with nonspecific low back pain. Spine 2007,
32(25):2915-20.
24. Ostelo RW, de Vet HC, Knol DL, Brandt PA van den: 24-item Roland-Morris Disability Questionnaire was preferred out of six functional status questionnaires for post-lumbar disc sur-gery. J Clin Epidemiol 2004, 57(3):268-76.
25. Lauridsen HH, Hartvigsen J, Manniche C, Korsholm L, Grunnet-Nils-son N: Responsiveness and minimal clinically important dif-ference for pain and disability instruments in low back pain patients. BMC Musculoskelet Disord 2006, 7:82.
26. Stratford PW: Sensitivity to Change of the Roland-Morris Back Pain Questionnaire: Part 1. Phys Ther 1998, 78(11):1186-96. 27. Stratford PW: Sensitivity to Change of the Roland-Morris Back
Pain Questionnaire: Part 2. Phys Ther 1998, 78(11):1197-207. 28. Ostelo RWJG, Deyo RA, Stratford P, Waddell G, Croft PP, Von Korff
M, Bouter LM, de Vet HC: Interpreting Change Scores for Pain and Functional Status in Low Back Pain: Towards Interna-tional Consensus Regarding Minimal Important Change.
Spine 2008, 33:90-94.
29. Roer N van der, Ostelo RW, Bekkering GE, van Tulder MW, de Vet HC: Minimal clinically important change for pain intensity, functional status, and general health status in patients with nonspecific low back pain. Spine 2006, 31(5):578-82.
30. Lauridsen HH, Hartvigsen J, Korsholm L, Grunnet-Nilsson N, Man-niche C: Choice of external criteria in back pain research: Does it matter? Recommendations based on analysis of responsiveness. Pain 2007, 131(1–2):112-20.
31. Farrar JT, Young JJP, LaMoreaux L, Werth JL, Poole RM: Clinical importance of changes in chronic pain intensity measured on an 11-point numerical pain rating scale. Pain 2001,
94(2):149-58.
32. de Vet HC, Terwee C, Knol DL, Bouter L: When to use agree-ment versus reliability measures. J Clin Epidemiol 2006,
59:1033-1039.
33. Guyatt GH, Norman GR, Juniper EF, Grifith LE: A critical look at transition ratings. J Clin Epidemiol 2002, 55(9):900-8.
34. Bender R: Calculating Confidence Intervals for the Number Needed to Treat. Controlled Clinical Trials 2001, 22:102-110. 35. Walter SD, Irwig L: Estimating the number needed to treat
(NNT) index when the data are subject to error. Stat Med 2001, 20(6):893-906.
36. de Vet H, Ostelo R, Terwee C, Roer N van der, Knol D, Beckerman H, Boers M, Bouter L: Minimally important change determined by a visual method integrating an anchor-based and a distri-bution-based approach. Quality of life research 2007, 16:131-142. 37. Davidson M, Keating J: A comparison of five low back disability questionnaires: Reliability and responsiveness. Physical therapy 2002, 82:8-24.
38. Marschner IC, Emberson J, Irwig L, Walter SD: The number needed to treat (NNT) can be adjusted for bias when the outcome is measured with error. J Clin Epidemiol 2004,
57(12):1244-1252.
39. Walter S: Number needed to treat (NNT): estimation of clin-ical benefit. Stat Med 2001, 20(24):3947-3962.
40. Senn S: N of 1 trials are needed. BMJ 1998:7157.
41. Wu LA, Kottke TE: Number needed to treat: caveat emptor. J Clin Epidemiol 2001, 54(2):111-6.
42. Gorouhi F, Jafarian S, Firooz A: Reporting of number needed to treat and its difficulties. Journal of the American Academy of Derma-tology 2007, 57(4):729-730.
43. Norman GR, Stratford P, Regehr G: Methodological problems in the retrospective computation of responsiveness to change: the lesson of Cronbach. J Clin Epidemiol 1997, 50(8):869-79. 44. Guidance for Industry. Patient-Reported Outcome
Meas-ures: Use in Medical Product Development to Support Labe-ling Claims. Health Qual Life Outcomes 2006, 4:79.
Pre-publication history
The pre-publication history for this paper can be accessed here: