Organized by C.O.E.T, Akola & IWWA, Amravati Center. Available Online at www.ijpret.com479
INTERNATIONAL JOURNAL OF PURE AND
APPLIED RESEARCH IN ENGINEERING AND
TECHNOLOGY
A PATH FOR HORIZING YOUR INNOVATIVE WORK
SPECIAL ISSUE FOR
NATIONAL LEVEL CONFERENCE
"SUSTAINABLE TECHNOLOGIES IN
CIVIL ENGINEERING"
PUSHOVER ANALYSIS AN INELASTIC STATIC ANALYSIS METHOD
P. S. LANDE1, A. D. YAWALE2
1. Assistant Professor, Applied Mechanics Department, Government college of Engineering Amravati, Amravati, Maharashtra, India. 2. Assistant Professor, Civil Engineering & Applied Mechanics Department, College of Engineering & Technology, Akola, Maharashtra, India.
Accepted Date: 13/03/2015; Published Date: 01/04/2015
Abstract: The recent advent of performance based design has brought the nonlinear static pushover analysis procedure to the forefront. Pushover analysis is a static, nonlinear procedure in which the magnitude of the structural loading is incrementally increased in accordance with a certain predefined pattern. With the increase in the magnitude of the loading, weak links and failure modes of the structure are found. The loading is monotonic with the effects of the cyclic behavior and load reversals being estimated by using a modified monotonic force-deformation criteria and with damping approximations. Static pushover analysis is an attempt by the structural engineering profession to evaluate the real strength of the structure and it promises to be a useful and effective tool for performance based design. In this study an urban bridge in Amravati which is accounted for as an important structure in the city transportation is studied using nonlinear static procedure. Three-dimensional model of the mentioned bridge is developed and analyzed using nonlinear static procedure (NSP) thus its seismic performance is evaluated accordingly. The results show the vulnerability of this bridge during earthquake and the necessity of retrofitting for improving its seismic behaviour.
Keywords-Pushover Analysis, Cyclic Behavior, Vulnerability.
Corresponding Author: MR. P. S. LANDE
Co Author: MR. A. D. YAWALE
Access Online On:
www.ijpret.com
How to Cite This Article:
P. S. Lande, IJPRET, 2015; Volume 3 (8): 479-486
Organized by C.O.E.T, Akola & IWWA, Amravati Center. Available Online at www.ijpret.com480 INTRODUCTION
Bridges as one of the important man-made structures play a vital role in everyday life of the people of Amravati city. Serviceability of bridges is of high importance in order to help injured people and required transportation, especially after earthquakes. Strong ground motions in the past decade in the densely populated area had great impacts on many bridges specially those designed according to older codes and demonstrated that these structures are vulnerable. In order to verify current codes which have had great changes compared with old ones and also recognizing of possible deficiencies, the careful study of bridges performance in the recent earthquake is necessary. Therefore, it’s preferable to investigate the structures that play a main role in everyday life. Linearly elastic procedures are efficient as long as the structure behaves within elastic limits. If the structure responds beyond the elastic limits, linear analyses may indicate the location of first yielding but cannot predict failure mechanisms and account for redistribution of forces during progressive yielding. This fact makes the elastic procedures insufficient to perform assessment and retrofitting evaluation for those bridges in particular and structures in general. Nonlinear (static and dynamic) procedures can overcome this problem and show the performance level of the structures under any loading level.
Although elastic analysis provides a useful overview of the expected dynamic response of a bridge, in general it cannot predict the failure mechanisms or the redistribution of forces that follow plastic hinge development during strong ground shaking. Nonlinear pushover analysis on the other hand, is a widely used analytical tool for the evaluation of the structural behavior in the inelastic range and the identification of the locations of structural weaknesses as well as of failure mechanisms. Nevertheless, the method is limited by the assumption that the response of the structure is controlled by its fundamental mode. In particular, the structure is subjected to monotonically increasing lateral forces with an invariant spatial distribution until a predetermined target displacement is reached at a monitoring point. As a result, both the invariant force distributions and the target displacement, do not account for higher mode contribution, which can affect both, particularly in the inelastic range, thus limiting the application of the approach to cases where the fundamental mode is dominant.
Organized by C.O.E.T, Akola & IWWA, Amravati Center. Available Online at www.ijpret.com481 event. The aforementioned comparison can be based on force or displacement. In pushover analyses, both the force distribution and target displacement are based on very restrictive assumptions, i.e. a time-independent displacement shape.
2.0 Standard pushover analysis method
This method primarily estimates the elastic displacement of an equivalent SDOF system assuming initial linear properties and damping for the ground motion excitation under consideration. Then it estimates the total maximum inelastic displacement response for the building at roof by multiplying with a set of displacement coefficients.
Fig. 1: Schematic representation of Displacement Coefficient Method (FEMA 356)[1]
The process begins with the base shear versus roof displacement curve (pushover curve) as shown in Fig. 1a. An equivalent period (Teq) is generated from initial period (Ti) by graphical procedure. This equivalent period represents the linear stiffness of the equivalent SDOF system. The peak elastic spectral displacement corresponding to this period is calculated directly from the response spectrum representing the seismic ground motion under consideration (Fig. 1b).
(1)
Now, the expected maximum roof displacement of the building (target displacement) under the selected seismic ground motion can be expressed as:
Organized by C.O.E.T, Akola & IWWA, Amravati Center. Available Online at www.ijpret.com482 C0 = a shape factor (often taken as the first mode participation factor) to convert the spectral displacement of equivalent SDOF system to the displacement at the roof of the building.
C1 = the ratio of expected displacement (elastic plus inelastic) for an inelastic system to the displacement of a linear system.
C2 = a factor that accounts for the effect of pinching in load deformation relationship due to strength and stiffness degradation
C3 = a factor to adjust geometric nonlinearity (P-Δ) effects.
These coefficients are derived empirically from statistical studies of the nonlinear response history analyses of SDOF systems of varying periods and strengths and given in FEMA 356 [6].
Short comings of standard pushover analysis [4]
Pushover analysis is a very effective alternative to nonlinear dynamic analysis, but it is an approximate method. Major approximations lie in the choice of the lateral load pattern and in the calculation of target displacement. FEMA 356 guideline for load pattern does not cover all possible cases. It is applicable only to those cases where the fundamental mode participation is predominant. Both the methods to calculate target displacement (given in FEMA 356) do not consider the higher mode participation. Also, it has been assumed that the response of a MDOF system is directly proportional to that of a SDOF system. This approximation is likely to yield adequate predictions of the element deformation demands for low to medium-rise buildings, where the behaviour is dominated by a single mode. However, pushover analysis can be grossly inaccurate for buildings with irregularity, where the contributions from higher modes are significant.
3.0 BRIDGE SELECTION AND MODELING
A multi-span concrete bridge in Bandera area is chosen as the study case. The bridge deck is supported by single-span prestressed concrete girders. The girders are placed on the concrete pier head through the bearing and locked in the transverse direction. The supporting piers are in various heights, but in this study equal height of 8 m is selected. The width of the bridge is 17.2 m with24 m length of equal span. The bridge is considered is 13 span bridges which is to be able to represent the behavior of multi-span bridge as the whole.
Organized by C.O.E.T, Akola & IWWA, Amravati Center. Available Online at www.ijpret.com483 rigid in x- and y-direction. All node lies at the same elevation in which at the centre of gravity of the girder and stringers, and mass is lumped at both ends of element. Each pier is modeled as an element with an elastic plastic behavior. It is assumed that the piers will fail in flexural mode where a plastic hinge formed at the pier’s base. The moment-rotation capacity of the plastic hinge is defined based on the stress-strain relationship of the section considering the confinement effect from transverse reinforcement. Bearing is modeled using link element in SAP2000 Nonlinear program. To accommodate the soil-structure interaction, each pile is modeled as spring with six degree of freedom to represent translational and rotational support.
To perform analysis of structure, the next step after modeling is applying loads. Design response spectrum should be available in order to perform pushover analysis. This bridge is to be built in a seismic zone with an acceleration coefficient of PGA = 0.3g.
4.0 RESULTS AND DISCUSSION
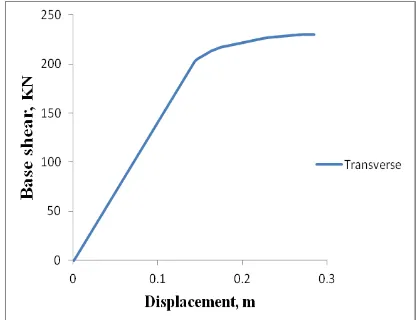
Standard pushover analysis is performed according to the FEMA 356 [6] and Pushover curves are plotted in both the direction i.e. Transverse and longitudinal as shown in fig. 1 and fig. 2. The predominant direction of excitation during an earthquake would have a low probability of being aligned with either pushover direction investigated here. Therefore, any dependencies on pushover direction could be very important in the response, and potentially to the survivability, of bridge subjected to an earthquake. In the longitudinal direction results obtained are more conservative and in transverse direction the results are reasonable. Bridge pushed in longitudinal direction achieves higher displacement as compared to bridge pushed in transverse direction. It is observed that the displacement is increasing rapidly in longitudinal direction therefore more failures will occur.
Organized by C.O.E.T, Akola & IWWA, Amravati Center. Available Online at www.ijpret.com484 In transverse direction the target displacement achieved is 245mm with the base shear 240KN.
Output for the pushover analysis can be printed in a tabular form for the entire model or for selected elements of the model. The types of output available in this form include joint displacements at each step of the pushover, frame member forces at each step of the pushover.
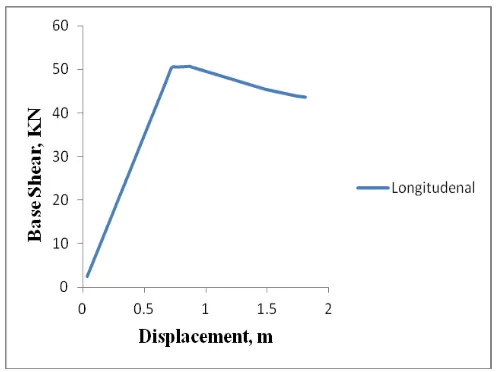
Figure 2: Pushover Curve for Longitudinal Direction.
In longitudinal direction the target displacement achieved is 390 mm with the base shear 50KN.
4.2 Evaluation of Different Procedure
Organized by C.O.E.T, Akola & IWWA, Amravati Center. Available Online at www.ijpret.com485 Figure 3 Deck Displacements at the Pier Location
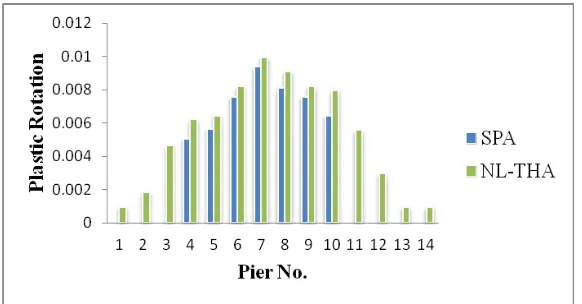
In order to further evaluate the results obtained from the SPA analysis, comparison is also performed for total base shear and plastic hinges’ rotations at the bottom of piers between results from the SPA with corresponding values from the NL-THA procedure for increasing levels of earthquake excitation. SPA underestimates the base shear by about 27%. It is observed that SPA poorly predicts plastic rotations.
Figure 4: Rotation of Plastic Hinges at Bottom of Piers.
5.0 CONCLUSION
The predominant direction of excitation during an earthquake would have a low probability of being aligned with either pushover direction investigated here. Therefore, any dependencies on pushover direction could be very important in the response, and potentially to the survivability, of the bridge subjected to an earthquake.
Organized by C.O.E.T, Akola & IWWA, Amravati Center. Available Online at www.ijpret.com486 1. Conservative results are obtained from the Displacement coefficient method in the longitudinal direction of the bridge and those results become to be over-conservative as the structure is driven farther into the inelastic range.
2. Reasonable results are obtained from the Displacement coefficient method in the transverse direction and those results become more conservative as the structure is driven further into the inelastic range.
3.The variation of displacements along the bridge is rather different. The SPA method predicts well the displacement only in the central, first mode dominated, area of the bridge.
4. To run a full dynamic, non – linear analysis on even a simple structure takes a long time. But with pushover analysis accurate results can be obtained in fractions of the time it would take to get any useful results from the fully dynamic analysis.
6.0 REFERENCES
1. A. Camara, M.A. Astiz, (2012) “Pushover analysis for the seismic response prediction of cable-stayed bridges under multi-directional excitation.” Engineering Structures 41 (2012) 444– 455.
2. Bignell John L., LaFave James M., Hawkins Neil M., (2005)“ Seismic Vulnerability assessment of wall pier supported highway bridges using nonlinear pushover analyses”, Science direct, Engineering structures, 27, 2044-2063.
3. Ching-Jong Wang, Ming-Hsiang Shih, (2007) “Performance study of a bridge involving sliding decks and pounded abutment during a violent earthquake.”, Engineering Structures 29 802– 812.
4. Dameron R. A., Sobash V. P. and Lam I. P.(1997) “ Nonlinear Seismic analysis of Bridge structures. Foundation- Soil Representation and ground motion” Science direct, Computers & structures vol. 64, No. 5/6, pp. 1251-1269.
5. Dr. V. K. Raina Concrete Bridge Practice Analysis. Design and Electronic Third Edition 2007.
![Fig. 1: Schematic representation of Displacement Coefficient Method (FEMA 356)[1]](https://thumb-us.123doks.com/thumbv2/123dok_us/8723880.1744659/3.612.163.470.261.434/fig-schematic-representation-displacement-coefficient-method-fema.webp)