ORIGINAL RESEARCH
SPINE
Diagnostic Quality of 3D T2-SPACE Compared with T2-FSE in
the Evaluation of Cervical Spine MRI Anatomy
XF.H. Chokshi,X G. Sadigh,XW. Carpenter, andX J.W. Allen
ABSTRACT
BACKGROUND AND PURPOSE: Spinal anatomy has been variably investigated using 3D MRI. We aimed to compare the diagnostic quality of T2 sampling perfection with application-optimized contrasts by using flip angle evolution (SPACE) with T2-FSE sequences for visualiza-tion of cervical spine anatomy. We predicted that T2-SPACE will be equivalent or superior to T2-FSE for visibility of anatomic structures.
MATERIALS AND METHODS: Adult patients undergoing cervical spine MR imaging with both T2-SPACE and T2-FSE sequences for radiculopathy or myelopathy between September 2014 and February 2015 were included. Two blinded subspecialty-trained radiologists independently assessed the visibility of 12 anatomic structures by using a 5-point scale and assessed CSF pulsation artifact by using a 4-point scale. Sagittal images and 6 axial levels from C2–T1 on T2-FSE were reviewed; 2 weeks later and after randomization, T2-SPACE was evaluated. Diagnostic quality for each structure and CSF pulsation artifact visibility on both sequences were compared by using a paired ttest. Interobserver agreement was calculated ().
RESULTS:Forty-five patients were included (mean age, 57 years; 40% male). The average visibility scores for intervertebral disc signal, neural foramina, ligamentum flavum, ventral rootlets, and dorsal rootlets were higher for T2-SPACE compared with T2-FSE for both reviewers (P⬍.001). Average scores for remaining structures were either not statistically different or the superiority of one sequence was discordant between reviewers. T2-SPACE showed less degree of CSF flow artifact (P⬍.001). Interobserver variability ranged between ⫺0.02– 0.20 for T2-SPACE and⫺0.02– 0.30 for T2-FSE (slight to fair agreement).
CONCLUSIONS: SPACE may be equivalent or superior to FSE for the evaluation of cervical spine anatomic structures, and T2-SPACE shows a lower degree of CSF pulsation artifact.
ABBREVIATIONS:C-spine⫽cervical spine; SPACE⫽sampling perfection with application-optimized contrasts by using flip angle evolution
H
istorically, cervical spine (C-spine) MR imaging has included 2D T1WI and T2WI sequences that allow single-plane visu-alization of soft tissue and osseous structures. The advent of 3D MR imaging sequences has allowed MPR visualization aftersin-gle-plane acquisition. Although 3D sequences have historically been based on GRE techniques, the advent of FSE 3D sequences, such as sampling perfection with application-optimized contrasts by using flip angle evolution (SPACE sequence; Siemens, Erlan-gen, Germany), affords a potential new means of evaluating anat-omy and pathology. The SPACE sequence is a proprietary 3D FSE sequence and is analogous to the VISTA (volume isotropic turbo spin-echo acquisition [Philips Healthcare, Best, the Nether-lands]) sequence or Cube sequence (GE Healthcare, Milwaukee, Wisconsin).1
Studies have evaluated the advantages of 3D T2WI sequences in brain2and head and neck imaging3,4; however, there have only
been a small number of studies investigating their value in spine MR imaging.5-7Most of these studies have compared the
visual-ization of degenerative disease of the lumbar spine on conven-tional T2-FSE sequences versus 3D T2WI sequences. Lee et al7
reported no statistically significant difference between the sensi-tivities of T2-FSE and 3D T2-SPACE for the detection of neural
Received September 8, 2016; accepted after revision November 23.
From the Department of Radiology and Imaging Sciences, Division of Neuroradiol-ogy (F.H.C., G.S., J.W.A.), Department of Biomedical Informatics (F.H.C.), Depart-ment of Radiology and Imaging Sciences, Division of Musculoskeletal Radiology (W.C.), and Department of Neurology (J.W.A.), Emory University School of Medi-cine, Atlanta, Georgia.
This work is supported, in part, by the Association of University Radiologists (AUR) General Electric Academic Radiology Research Fellowship (GERRAF) grant. Dr. Chokshi is an AUR GERRAF Fellow from 2015 to 2017.
Paper previously presented at: Annual Meeting of the American Society of Neuro-radiology and the Foundation of the ASNR Symposium, May 21–26, 2016; Washing-ton, DC.
Please address correspondence to Falgun H. Chokshi, MD, MS, Department of Ra-diology and Imaging Sciences, Division of NeuroraRa-diology, Emory University School of Medicine, 1364 Clifton Rd NE, Atlanta, GA 30322; e-mail: falgun.chokshi@ emory.edu; @FalgunChokshiMD
foraminal stenosis, spinal canal stenosis, and nerve compression at 3T. Furthermore, Blizzard et al5found a high degree of
inter-observer agreement between T2-FSE and T2-SPACE images for the evaluation of spinal canal stenosis, disc herniation, and degen-erative changes. A similar study comparing FSE and T2-SPACE also found high interobserver agreement for the visualiza-tion of C-spine degenerative disease.6
To our knowledge, Meindl et al8published the only study
comparing the visualization of C-spine normal anatomic struc-tures and CSF visualization on T2-FSE and T2-SPACE in 15 healthy volunteers (mean age, 28.4 years) and found statistically significant better visibility of CSF, intraspinal nerve roots, and neural foraminal structures on T2-SPACE. To date, however, there has been no similar study to evaluate anatomic visualization in clinically symptomatic patients. Such a study would help deter-mine the replicability of the previous findings and generate fur-ther hypotheses about and support for how T2-SPACE could be used and integrated into routine spine MR imaging while main-taining appropriate workflow. Moreover, we felt it is important to establish visibility of anatomy before focusing on pathology be-cause the former is the foundation of the latter.
Therefore, we aimed to adapt the methods of Meindl et al8and
evaluated clinical spine MRIs to assess the visualization of C-spine anatomy in a clinical patient population. We predicted that T2-SPACE would be equivalent or superior to T2-FSE for the evaluation of C-spine anatomic structures and that T2-SPACE would show a lesser degree of CSF flow artifact.
MATERIALS AND METHODS
Patient Selection
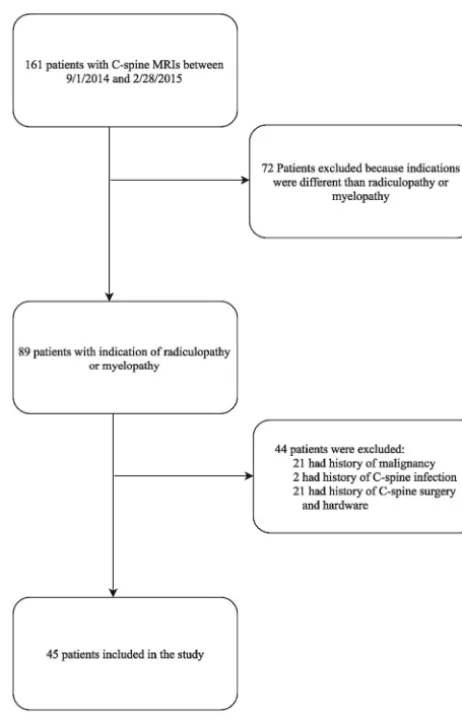
[image:2.594.300.531.43.402.2]This retrospective study was approved by our institutional review board, and a waiver of consent was granted. We searched our institutional radiology data base for all C-spine MRIs without contrast performed on a 1.5T Aera scanner (Siemens, Erlangen, Germany) at 1 of our 2 university hospitals between September 1, 2014, and February 28, 2015. We limited the search to this scanner because it has a diagnostic-quality T2-SPACE sequence that is routinely acquired as part of the clinical C-spine MR imaging protocol. We included consecutive patients aged 18 years or older who underwent C-spine MR imaging without contrast with both T2-FSE and T2-SPACE sequences for the indication of radiculop-athy, myelopradiculop-athy, or neck pain, which was determined by search-ing the indication on the scan requisition as filled out by the or-dering physician. Using information from the electronic health record, patients were excluded if they had any history of malig-nancy, C-spine infection, C-spine surgery, and/or surgical instru-mentation.Fig 1shows the patient selection characteristics. Pa-rameters for the T2-FSE and T2-SPACE sequences are listed in Table 1.
Anatomic Visualization and Scoring
Using a paired study design, 2 reviewers blinded to the clinical presentation and C-spine MR imaging results (but not the patient demographics displayed on the PACS) independently assessed the visibility of 12 anatomic structures (Fig 2) and CSF flow artifact on the sagittal view and 6 axial levels spanning C2–T1 on T2-FSE. To decrease recall bias, T2-SPACE was evaluated at least 2 weeks
later, and the subject order was randomized (paired study de-sign9). Subsequently, each reviewer generated 8190 total visibility
scores. Both reviewers were subspecialty-trained attending radi-ologists, each with more than 10 years of experience. Reviewer 1 was a musculoskeletal radiologist (W.C.) and reviewer 2 was a neuroradiologist (J.W.A.).
The C-spine anatomic structures were evaluated by using a 5-point scale (0⫽not visible, 4⫽excellent visibility), and CSF flow artifact was evaluated by using a 4-point scale (0⫽severe artifact, 3⫽no artifact), both adapted from Meindl et al.8
Statistical Analysis
[image:2.594.302.532.433.538.2]Differences between the visibility scores for the 2 sequences were tested for statistical significance by using a pairedttest for the scores documented for each of the 12 anatomic structures and the FIG 1. Patient selection flowchart.
Table 1: 1.5T MRI parameters for T2-FSE and T2-SPACE sequences
Sequence T2-FSE T2-FSE T2-SPACE
Orientation Axial Sagittal Sagittal
TR (ms) 3370 3140 1500
TE (ms) 79 84 120
FA (degrees) 150 150 Variable
FOV (mm) 100 100 100
Matrix 256⫻182 384⫻269 256⫻256
Voxel size (mm) 3 3 1
Sections 40 15 80
TA (min:sec) 1:44 2:46 4:00
CSF flow artifact on sagittal view and 6 axial levels for each re-viewer separately. Interobserver agreement of the 2 rere-viewers for each of the sequences (T2-FSE and T2-SPACE) was measured by using the Cohencorrelation coefficient.10All statistical
calcula-tions were performed by using STATA/SE version 14.1 (Stata-Corp, College Station, Texas).P⬍.05 was considered statistically significant.
RESULTS
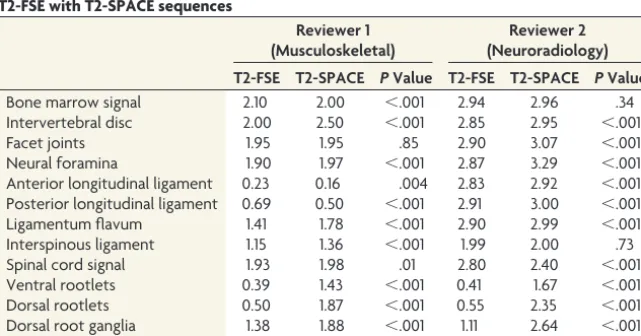
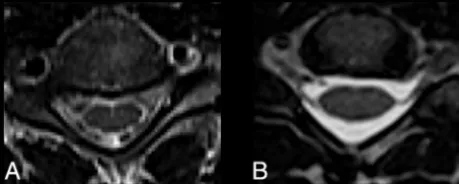
Forty-five patients met our inclusion criteria (Fig 1). The mean age was 57 years (SD, 15 years), ranging from 22– 82 years, and 40% of the patients were men. As depicted inTable 2, average visibility scores for intervertebral disc signal, neural foramina, ligamentum flavum, ventral rootlets, and dorsal rootlets were higher for T2-SPACE compared with T2-FSE for both reviewers (P⬍.001). For both reviewers, T2-SPACE showed significantly less CSF flow artifact compared with T2-FSE (P⬍.001) (Fig 3).
Average scores for the remaining anatomic structures were either not statistically different or the superiority of one sequence was discordant between both reviewers. Reviewer 1 scored the bone marrow signal (P⬍.001), anterior longitudinal ligament
(P⫽.004), and posterior longitudinal ligament higher for T2-FSE, indicating better visualization compared with T2-SPACE. For this reviewer, there was no statistically significant difference in the visualization of the facet joints (P⫽.85); conversely, re-viewer 2 scored T2-SPACE higher than T2-FSE for facet joint visualization (P⬍.001). Reviewer 2 scored the spinal cord signal (P⬍ .001) higher for T2-FSE compared with T2-SPACE, and there was no statistically significant difference in the visualization of the bone marrow signal (P⫽.34) and the interspinous liga-ments (P⫽.73). Interobserver agreement ranged between val-ues of⫺0.02– 0.20 for T2-SPACE and⫺0.02– 0.30 for T2-FSE, consistent with slight to fair agreement for both sequences.10
DISCUSSION
In this study, we compared the visibility scores of 12 anatomic structures of the cervical spine and CSF pulsation artifact on T2-FSE and T2-SPACE MR imaging sequences. Five anatomic struc-tures, namely the intervertebral disc, neural foramina, ligamen-tum flavum, ventral rootlets, and dorsal rootlets, were better seen on T2-SPACE compared with T2-FSE for both reviewers, and CSF pulsation artifact was less on T2-SPACE. The remaining structures showed statistical equivalency in visualization or dis-cordance in visualization between both reviewers.
This is the second study to focus on visualization of normal anatomic structures of the C-spine at 1.5T MR imaging strength by using T2-SPACE. Compared with the first such study by Meindl et al,8which included only healthy volunteers, ours
in-cluded older patients with clinical indications warranting C-spine MR imaging and is arguably more clinically relevant. Similar to Meindl et al,8we also found that intraspinal structures (rootlets)
and neural foramina were better visualized with T2-SPACE, while also evaluating additional anatomic structures not evaluated in that study, namely the ligamentum flavum and longitudinal ligaments.
Comparable with Meindl et al,8our study also found less CSF
pulsation artifact (better CSF visibility) on T2-SPACE in compar-ison with T2-FSE. Conventional T2-FSE images are often wrought with pulsation artifact,11which greatly diminishes their
utility in visualizing thecal sac contents, especially small struc-tures such as the rootlets. Many patients undergo invasive CT myelography12 or contrast-enhanced
MR myelography13to interrogate these
structures. The ability of T2-SPACE to better identify the rootlets could be helpful in clinical diagnosis and surgical planning because no intrathecal con-trast is needed and there is no radiation exposure. This “myelographic” applica-tion of T2-SPACE should be explored via prospective comparative trials with CT and MR myelography.
In contrast to studies of degenerative disease by using T2-SPACE2-7and the
MR imaging anatomy study by Meindl et al,8our interobserver agreement for
T2-SPACE ranged from slight to fair. It is unclear if this reflects any underlying difference in experience with this se-FIG 2. C-spine anatomic structures evaluated by reviewers. ALL
[image:3.594.55.376.554.722.2]in-dicates anterior longitudinal ligament; PLL, posterior longitudinal ligament.
Table 2: Average visibility score for anatomic structures and CSF flow artifact comparing T2-FSE with T2-SPACE sequences
Reviewer 1 (Musculoskeletal)
Reviewer 2 (Neuroradiology) T2-FSE T2-SPACE PValue T2-FSE T2-SPACE PValue
Bone marrow signal 2.10 2.00 ⬍.001 2.94 2.96 .34
Intervertebral disc 2.00 2.50 ⬍.001 2.85 2.95 ⬍.001
Facet joints 1.95 1.95 .85 2.90 3.07 ⬍.001
Neural foramina 1.90 1.97 ⬍.001 2.87 3.29 ⬍.001
Anterior longitudinal ligament 0.23 0.16 .004 2.83 2.92 ⬍.001 Posterior longitudinal ligament 0.69 0.50 ⬍.001 2.91 3.00 ⬍.001
Ligamentum flavum 1.41 1.78 ⬍.001 2.90 2.99 ⬍.001
Interspinous ligament 1.15 1.36 ⬍.001 1.99 2.00 .73
Spinal cord signal 1.93 1.98 .01 2.80 2.40 ⬍.001
Ventral rootlets 0.39 1.43 ⬍.001 0.41 1.67 ⬍.001
Dorsal rootlets 0.50 1.87 ⬍.001 0.55 2.35 ⬍.001
Dorsal root ganglia 1.38 1.88 ⬍.001 1.11 2.64 ⬍.001
CSF flow artifacta 1.65 2.93 ⬍.001 1.69 2.8 ⬍.001
quence between the 2 reviewers. Reviewer 1 (attending musculo-skeletal radiologist) had no experience with this newer sequence, whereas reviewer 2 (attending neuroradiologist) had approxi-mately 1 year of experience. It is also unclear if this difference may reflect an underlying learning curve associated with the T2-SPACE sequence or may be related to the different approaches to spine MR imaging interpretation between these 2 subspecialties. These questions could be assessed in future studies by testing mul-tiple reader interobserver agreement after various amounts of ex-perience with the sequence. In addition, future studies may ben-efit from training observers before the onset of the study to establish baselines for the measurements and thereby improve interobserver agreement.
Interestingly, we also found slight to fair interobserver agree-ment for the T2-FSE sequence. Although this finding has not been reported thus far for C-spine MRIs, a 2005 study by van Rijn et al14found greater than 50% interobserver disagreement when
they evaluated lumbar spine MRIs for disc herniation. That study included only neuroradiology-trained reviewers and examined degenerative lumbar spine disease (defined as osteophyte at end-plates, disc herniation, central canal stenosis, and lateral recess stenosis). Interobserver studies of C-spine MR imaging have re-ported a wide range of agreement for detection of degenerative disease on T2-FSE or T2-SPACE.15-18None, however, have
re-ported interobserver agreement for T2-FSE visualization of C-spine anatomic structures. Our interobserver agreement results may represent the first description of visualization and detection differences of C-spine MR imaging anatomy on T2-FSE between musculoskeletal radiologists and neuroradiologists.
Our study limitations are as follows:
1) We used a retrospective study design, which raises the concern for selection bias and the presence of unknown confounders, both of which can be better addressed by using a prospective, randomized design;
2) Although we used a paired study design, we assessed visualiza-tion with only 2 reviewers. Future studies could use a multi-reader design, which would allow better evaluation of interob-server agreement and allow a lower sample size to find statistical significance19; and,
3) For T2-SPACE evaluation, we did not compare visualization scores between inexperienced versus experienced readers.
We feel the biggest advantage of T2-SPACE is the ability to acquire isotropic imaging data at millimeter or sub-millimeter section thickness with a single sagittal acquisition followed by
multiplanar reformats. This is in contradistinction to conven-tional T2-FSE imaging, where the increased section thickness, and the variable addition of skip sections in some clinical settings, leads to an averaging of the area imaged rather than depicting the true anatomy. In addition, the artifacts that can cause diagnostic problems on T2-FSE tend to stem from CSF pulsation, which is minimized on T2-SPACE.
Potential roles for the T2-SPACE sequence may include, but are not limited to: 1) supplanting contrast-enhanced CT or MR myelography; 2) replacing conventional T2-FSE sequences in the imaging of degenerative C-spine disease, similar to a recent study examining lumbar spine MR imaging20; 3) assessing traumatic
C-spine ligamentous injury and nerve root avulsions; and, 4) gen-erating oblique sagittal MPR images for the evaluation of C-spine neural foramina without the time cost associated with T2-FSE oblique imaging.21However, robust comparative effectiveness
studies are needed to further characterize the benefits and limits of this sequence’s uses.
CONCLUSIONS
T2-SPACE may be superior to T2-FSE for evaluation of some, but not all, C-spine anatomic structures and shows less degree of CSF flow artifact. This provides further opportunities for this se-quence to replace T2-FSE for certain clinical implications or to avoid contrast-enhanced CT or MR myelography.
REFERENCES
1. Mugler JP 3rd.Optimized three-dimensional fast-spin-echo MRI.J Magn Reson Imaging2014;39:745– 67CrossRef Medline
2. Senova S, Hosomi K, Gurruchaga JM, et al. Three-dimensional SPACE fluid-attenuated inversion recovery at 3 T to improve sub-thalamic nucleus lead placement for deep brain stimulation in Par-kinson’s disease: from preclinical to clinical studies.J Neurosurg
2016;125:472– 80CrossRef Medline
3. Ciftci E, Anik Y, Arslan A, et al.Driven equilibrium (drive) MR imaging of the cranial nerves V-VIII: comparison with the T2-weighted 3D TSE sequence.Eur J Radiol2004;51:234 – 40CrossRef Medline
4. Czerny C, Trattnig S, Baumgartner WD, et al.[MRI of the regions of the inner ear and cerebellopontine angle using a 3D T2-weighted turbo spin-echo sequence. Comparison with conventional 2D T2-weighted turbo spin-echo sequences and T1-T2-weighted spin-echo se-quences]. [Article in German] Rofo 1997;167:377– 83 CrossRef Medline
5. Blizzard DJ, Haims AH, Lischuk AW, et al.3D-FSE isotropic MRI of the lumbar spine: novel application of an existing technology.J Spi-nal Disord Tech2015;28:152–57CrossRef Medline
6. Fu MC, Buerba RA, Neway WE 3rd, et al.Three-dimensional isotro-pic MRI of the cervical spine: a diagnostic comparison with conven-tional MRI.Clin Spine Surg2016;29:66 –71CrossRef Medline
7. Lee S, Jee WH, Jung JY, et al.MRI of the lumbar spine: comparison of 3D isotropic turbo spin-echo SPACE sequence versus conventional 2D sequences at 3.0 T.Acta Radiol2015;56:174 – 81CrossRef Medline
8. Meindl T, Wirth S, Weckbach S, et al.Magnetic resonance imaging of the cervical spine: comparison of 2D T2-weighted turbo spin echo, 2D T2*weighted gradient-recalled echo and 3D T2-weighted variable flip-angle turbo spin echo sequences.Eur Radiol2009;19: 713–21CrossRef Medline
9. Obuchowski NA. Statistical Issues in Study Design. In: Obuchowski NA, Gazelle GS, eds.Handbook for Clinical Trials of Imaging and Im-age-Guided Interventions. Hoboken: Wiley-Blackwell; 2016:103–25 10. Viera AJ, Garrett JM.Understanding interobserver agreement: the
kappa statistic.Fam Med2005;37:360 – 63Medline FIG 3. CSF visualization on T2-FSE and T2-SPACE. There is
[image:4.594.54.284.48.140.2]11. Ross JS.MR imaging of the cervical spine: techniques for two- and three-dimensional imaging.AJR Am J Roentgenol1992;159:779 – 86
CrossRef Medline
12. Chokshi FH, Tu RK, Nicola GN, et al.Myelography CPT coding updates: effects of 4 new codes and unintended consequences. AJNR Am J Neuroradiol2016;37:997–99CrossRef Medline
13. Cowley P.Neuroimaging of spinal canal stenosis.Magn Reson Im-aging Clin N Am2016;24:523–39CrossRef Medline
14. van Rijn JC, Klemetso¨ N, Reitsma JB, et al.Observer variation in MRI evaluation of patients suspected of lumbar disk herniation.AJR Am J Roentgenol2005;184:299 –303CrossRef Medline
15. Stafira JS, Sonnad JR, Yuh WT, et al.Qualitative assessment of cer-vical spinal stenosis: observer variability on CT and MR images. AJNR Am J Neuroradiol2003;24:766 – 69Medline
16. Braga-Baiak A, Shah A, Pietrobon R, et al.Intra- and inter-observer reliability of MRI examination of intervertebral disc abnormalities in patients with cervical myelopathy.Eur J Radiol2008;65:91–98
CrossRef Medline
17. Cook C, Braga-Baiak A, Pietrobon R, et al.Observer agreement of spine stenosis on magnetic resonance imaging analysis of patients with cervical spine myelopathy.J Manipulative Physiol Ther2008;31: 271–76CrossRef Medline
18. Kuijper B, Beelen A, van der Kallen BF, et al.Interobserver agree-ment on MRI evaluation of patients with cervical radiculopathy. Clin Radiol2011;66:25–29CrossRef Medline
19. Chen W, Wunderlich A, Petrick N, et al.Multireader multicase reader studies with binary agreement data: simulation, analysis, validation, and sizing.J Med Imaging (Bellingham)2014;1:031011CrossRef Medline
20. Sayah A, Jay AK, Toaff JS, et al.Effectiveness of a rapid lumbar spine MRI protocol using 3D T2-weighted SPACE imaging versus a stan-dard protocol for evaluation of degenerative changes of the lumbar spine.AJR Am J Roentgenol2016;207:614 –20CrossRef Medline
21. Freund W, Klessinger S, Mueller M, et al. [Utility of coronal oblique slices in cervical spine MRI: improved detection of the neuroforamina].[Article in German]Radiologe2015;55:1000 – 08