http://www.scirp.org/journal/eng ISSN Online: 1947-394X ISSN Print: 1947-3931
DOI: 10.4236/eng.2018.103007 Mar. 20, 2018 85 Engineering
Simulation of Solidification Parameters during
Zr Based Bulk Metallic Glass Matrix
Composite’s (BMGMCs) Additive Manufacturing
Muhammad Musaddique Ali Rafique
School of Engineering [Aerospace, Mechanical and Manufacturing Engineering], RMIT University, Carlton, Australia
Abstract
After a silence of three decades, bulk metallic glasses and their composites have re-emerged as a competent engineering material owing to their excellent mechanical properties not observed in any other engineering material known till date. However, they exhibit poor ductility and little or no toughness which make them brittle and they fail catastrophically under tensile loading. Exact explanation of this behaviour is difficult, and a lot of expensive experimenta-tion is needed before conclusive results could be drawn. In present study, a theoretical approach has been presented aimed at solving this problem. A de-tailed mathematical model has been developed to describe solidification phe-nomena in zirconium based bulk metallic glass matrix composites during ad-ditive manufacturing. It precisely models and predicts solidification parame-ters related to microscale solute diffusion (mass transfer) and capillary action in these rapidly solidifying sluggish slurries. Programming and simulation of model is performed in MATLAB®. Results show that the use of temperature
dependent thermophysical properties yields a synergic effect for multitude improvement and refinement simulation results.Simulated values proved out to be in good agreement with prior simulated and experimental results.
Keywords
Simulation, Metallic Glass, Solidification, Toughness
1. Introduction
Bulk Metallic Glasses [1] and their Composites [2] have emerged [3] as competi-tive structural engineering material [4] during last two decades and have at-tracted the attention of several major research clusters [5]-[19] around the globe How to cite this paper: Rafique, M.M.A.
(2018) Simulation of Solidification Para-meters during Zr Based Bulk Metallic Glass Matrix Composite’s (BMGMCs) Additive Manufacturing. Engineering, 10, 85-108. https://doi.org/10.4236/eng.2018.103007
Received: February 5, 2018 Accepted: March 17, 2018 Published: March 20, 2018
Copyright © 2018 by author and Scientific Research Publishing Inc. This work is licensed under the Creative Commons Attribution International License (CC BY 4.0).
microstruc-DOI: 10.4236/eng.2018.103007 87 Engineering ture primarily explaining dendrite tip temperature and dendrite tip radius as a function of growth rate/dendrite tip velocity based on dendrite tip stability theory.
2. Mathematical Model
In order to develop a model consider a dendrite tip evolving out of liquid as it starts cooling in melt pool of additive manufacturing. Its shape could be consi-dered to be resembling a parabola. Using KGT model [47] following assump-tions could be made about this type of microstructural evolution.
1) The solute field around the dendrite tip is given by Ivantsov solution. 2) The dendrite tip grows at marginal stability limit.
3) The diffusion coefficient d, is (tip) temperature dependent.
4) The segregation/partition coefficient, k, takes into account solute trapping; i-e, k is (dendrite tip) velocity dependent.
5) Initial partition coefficient (ko) is temperature dependent and binary alloy
(Zr-Cu) is assumed to behave as multicomponent alloy.
6) The undercooling of tip (ΔT) is the sum of solute undercooling and the curvature undercooling.
7) The effect of convection is ignored.
In present study, however, a further practical approach is adopted which takes into account the calculation of supersaturations of individual constitu-ents/components in an alloy which eliminates the fact that their diffusion fields superimpose and supports the actual conditions in which binary alloy system does not behave as ternary or multicomponent system (BMGMC). This is a con-tradiction to assumption 5 above in basic KGT model and provides the basis of development of present model to explain microstructural evolution in detail.
There are three main velocities which are of interest here (Figures 1(a)-(c)) when a beam of high energy (electron or laser) travels on surface of specimen in additive manufacturing setup (Figure 2).
1) Moving heat source velocity (Vb), 2) solidification front velocity (Vs) and 3)
dendrite tip velocity (Vhkl)
Model comprises of three main parts and separate mathematical expression is developed for each segment.
Nucleation
This is based on Oldfield theory of heterogeneous nucleation which describes a relationship between undercooling (ΔT) and grain density at each segment of interest (bulk liquid, mold wall and potent nuclei) in terms of Gaussian distribu-tion to explain solidificadistribu-tion. Two most important parameters sought after to be determined are, maximum nucleation density (nmax) and grain density (n(ΔT)).
Maximum nucleation density may be obtained by integral of nucleation distri-bution from zero undercooling to infinite undercooling.
max 0
d d
i
n
n T
T
∝
′
= ∆
′ ∆
DOI:10.4236/eng.2018.103007 88 Engineering
Figure 1. Schematic showing relationship between different velocity components ( re-printed with permission from Springer) [50].
[image:4.595.230.515.467.687.2]DOI: 10.4236/eng.2018.103007 89 Engineering Similarly, grain density is given by following equation
( )
max0
1
exp d
2 2π
T
N
n T T
n T T
T
Tσ σ
∆ ∆ − ∆′
′
∆ = − ∆ ∆
∆
∫
(2)
where ΔTn and ΔTσ are mean undercooling and standard deviation of grain
den-sity distribution respectively.
With this, probability of happening of one event (nucleation) is given by nuc-leation probability (pv) as described by Prof. Rappaz in his famous article [46].
v
p ≥r (3)
i-e if at any instant of time t, pvexceeds r, nucleation will occur. pv=δn Vv⋅ CA where δnv= grain density increase and VCA = one cell volume (measure by
not-ing all dimensions of a cell assumnot-ing it to have square shape) (Figure 3(a)). A change in state index of a cell represents its growth as depicted by cells in Figure 3(b). Typically, cell dimensions are in nanometers while typical number of cells reported in previous calculations are 30,000 [52].
Dendrite growth orientation
Second part of the model deals with determination of dendrite growth orien-tation i-e the direction in which some dendrites preferably grow faster and long-er as compared to othlong-ers due to balance between geometrical and kinetic va-riables. This also highlights and points towards grain competition and selection mechanisms. Two important parameters are held responsible for assigning and determining grain orientation. a) Growth of first grain as a result of heteroge-neous nucleation at mold wall or potent nuclei and b) Location of further sub-sequent new grain(s) and their crystallographic orientation. For example, for cu-bic metals, the preferential growth directions of dendrites are given by direction of easy heat flow which is along <100> crystallographic direction/orientation. During early stage of solidification, a nucleus grows at the surface of mold or potent nuclei in the form of hemispherical surface. This surface becomes unsta-ble and then dendritic after a certain incubation time and growth occurs with
[image:5.595.212.539.523.680.2](a) (b)
DOI:10.4236/eng.2018.103007 90 Engineering main trunk and arms coinciding with <100> crystallographic direction. The lo-cation of new grains is assumed to be governed by random process. This specific orientation is described to be controlled by three Euler angles θ, φ and ψ irres-pective of grain nucleated at the surface of mold, potent nuclei or bulk liquid. This is described in Figure 4. In this figure, a reference frame, Oxyz, is attached to laboratory (e.g. the mold) in which direction Oz is perpendicular to mold wall. First two angles describes the growth and orientation of main [001] trunk while third angle ψ describes the orientation of [100] and [010] secondary branches. A schematic showing their arrangement is shown in Figure 4.
The probability dp
(
θ ϕ ψ, ,)
that a newly nucleated grain has its main trunk orientation in the range[
θ θ, +dθ]
and[
ϕ ϕ, +dϕ]
and one of its set of sec-ondary branches within the orientation[
ψ ψ, +dψ]
is given by [52](
)
dp θ ϕ ψ, , = ⋅A sinθ θ ϕ ψ⋅d ⋅d ⋅d (4)
where A = constant which takes into account the fourfold symmetry of the den-drite along its trunk axis and the possible permutations of the <100> directions.
In general, dendrite growth direction of grain nucleated at the mold surface determines the time during which grain can survive competitive growth of its neighbors.
Grain growth/Growth kinetics/Dendrite stability theory
[image:6.595.275.474.540.689.2]This section concerns kinetics associated with growth of already formed grains in bulk liquid, mold surface and potent nuclei. A unique feature adopted here concerns the determination of supersaturation of individual elements in multicomponent alloy (BMGMC) systems. This approach arises from the notion that in contrast to conventional castings in which undercooling related with thermal diffusion, attachment kinetics and curvature is small, in multicompo-nent systems (undergoing additive manufacturing treatment) basic KGT model must be used with certain modifications which not only accounts for superim-position of solute fields around each dendrite tip but also incorporate determi-nation of supersaturation for each individual component (Zr, Cu, Ni, Al and Co) of alloy system. This supersaturation Ωi is a function of Peclet number, Pei
DOI: 10.4236/eng.2018.103007 91 Engineering
( )
v
I Pe
Ω = (5)
(
)
i Iv Pei
Ω =
(6)
2 i i R V Pe D ⋅ =
⋅ (7)
Putting in [5]
2 i v i R V I D ⋅
Ω = ⋅
(8)
( )
1
e
eei eei d
i i i
ei
u
P P
i Pe E Pe Pe P u
u
− ∞
Ω = =
∫
(9)
( )
2 2
1
2
e
e e d
2 2
i i
i
i
R V R V u
D D
R V
i e
D
i i
R V R V
E P u
D D u
⋅ ⋅ − ∞ ⋅ ⋅ ⋅ ⋅ ⋅ ⋅
Ω = =
⋅ ⋅
∫
(10)but
(
)
* , * 1 i o i i i i c c c k − Ω =−
(11)
where, *
i
c = concentration of constituent i in liquid at dendrite tip (to be found),
,
o i
c = initial concentration of constituent i, ki = partition coefficient for this
constituent i (velocity dependent). Comparing (10) and (11)
(
)
* , 2 * 2 e e d 2 1 i iR V u
i o i D
R V D i
i i
c c R V
u D u c k ⋅ − ∞ ⋅ ⋅ ⋅ − ⋅ = ⋅
−
∫
(12)
However,
(
) ( )
(
,)
* 1 1 o i ii v i
c c
k I Pe
=
− − (13)
1 o o i i o i a V k D k a V D + = + (14)
where, ao = length scale related to interatomic distance and is estimated to be
between 0.5 - 5 nm and
*
e g
Q R T i o
D D ⋅
−
=
(15)
where, Do = Proportionality constant, Q = Activation energy, Rg = Gas con-stant, T* = Tip temperature calculated by iterative method (described below)
[51].
In a linearized phase diagram
(
)
2 * * , 1 2L i i o i
i
T T m c c
R
=
Γ
= +
∑
− −DOI:10.4236/eng.2018.103007 92 Engineering L i i T m c ∂ =
∂ (17)
TL = Liquidus temperature for initial alloy composition, Γ = Gibbs-Thomson
coefficient, 2 0
R
Γ
≈ (negligible) (under normal solidification conditions),
2 1
R
Γ=
(under rapid solidification conditions (additive manufacturing)). Another term can be generated from linearized phase diagram known as ficti-tious melting point of pure constituent [51].
2 , 1
m L i o i
i
T T m c
=
′ = −
∑
(18) Using Equations (13) and (18), Equation (16) becomes
(
) ( )
(
)
2 , * 1 2 1 1i o i m
i i v ei
m c
T T
R
k I P
=
Γ ′
= + −
− −
∑
(19)where, R = Dendrite tip radius, V = Dendrite tip velocity.
This model is iterative model which is based on assigning final values to orig-inal value thus generating a loop whose explanation will be given in next section. 100 iterative cycles are used to generate homogeneous and normalized data based upon best software engineering practice. In general while writing the pro-gram, reading it and executing it, Ω depends on Iv
( )
Pei and*
i
c , *
i
c depends
on ki and Iv
( )
Pei , ki depends on Di, Di depends on Tip temperature and finally, Tip temperature depends on *i
c . Thus, a loop is generated which
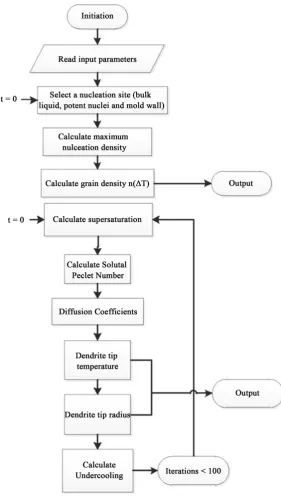
ac-counts for “to and fro” motion of information and iterative handling of data. This is the essence of generation of refined outputs and results. A schematic flow chart describing the working of model and interdependence of parameters is presented in Figure 5.
Finally, total undercooling (ΔT) is related to supersaturation (Ω) by [52]
(
)
,
1 1
1 1
i i o i
i i
T m c
k
∆ = −
− Ω −
⋅
⋅
⋅
(20)
The criteria used to specify radius of dendrite tip (R) is assumed to be given by marginal stability wavelength of planar wave front (as given in Mullins and Sekerka [60], Langer and Mueller-Krumbhaar [61], KGT [47] and BLL [62] models).
Accordingly, one has for a ternary system
( )
1 2 2 , 1 2πi c i c ei
i
R
m G ε P G
=
Γ
=
−
∑
(21)where, Gc,i = solute gradient of constituent i in the liquid near tip which can be
written as
(
)
*
, 1
c i i i
i
G C k
D
υ
= − −
DOI: 10.4236/eng.2018.103007 93 Engineering Figure 5. Schematic flow chart describing working of model.
G = Average thermal gradient near tip and εc
( )
Pei = f P( )
ei =1 (low speed/ low Pei).Putting values of 2 ei
i
R V P
D
⋅ =
⋅ and Equation (22) in Equation (21) [51]
(
) ( )
(
) ( )
2 2
, 2
1
1
4π 2
0
1 1
ei i o i i c ei
i i v ei
P m C k P
G R
R k I P
ξ
=
− Γ
+ + =
− −
∑
(23)where, Γ = Gibbs-Thomson coefficient, mi = the slope of liquidus, ξc = a
DOI:10.4236/eng.2018.103007 94 Engineering
3. Simulation Using Object Oriented Programming (OOP)
A computer program was written in MATLAB®. Instead of fixing the Peclet
[image:10.595.198.536.494.745.2]number as was done in previous approaches [51], this program account for changing Peclet number with the change of each state value of system [63]. Fur-thermore, the program is based on transient transport processes and values are incorporated into original values using “for” loop and are assigned to their initial values using iterative approach. This helps in improving the efficiency of pro-gram and generation of fine mesh less results. Propro-gram asks for initial values and upon assigning initial values to dynamic variables, it generates first set of data which is repeated and assigned back to original variable to generate a loop. This process is repeated 100 times based on the number of iterations assigned in loop. It also takes into account temperature dependent diffusion coefficient and veloc-ity dependent partition/segregation coefficient in accordance with KGT model [47]. Exact thermophysical data of BMGMCs derived out of very recent studies [64] [65] was normalized and used in simulations. A correlation for the use of thermophysical data for major alloying elements of BMGMC system was devel-oped. This was done based on their presence in same reactive group (transition metals) in periodic table. Nearest possible commonly studied element (Cr) [51] was chosen for generation of first set of data. Based on this, the parameters used in calculations are listed in Table 1. The thermal gradient (G) which is a function of additive manufacturing (AM) condition is taken as free number and only one value (100 K/mm) is used for calculations. A unique feature of program is it can work for; and be tailored according to, the need of any material (alloy) and manufacturing process (e.g. additive manufacturing). Data on thermophysical properties of metals and alloys (especially exotic materials) as they change with the change of time and temperature is scarce and more efforts are needed in this
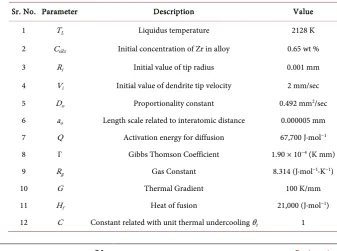
Table 1. Parameters used in the calculations of dendritic growth for Zr based BMGMCs.
Sr. No. Parameter Description Value 1 TL Liquidus temperature 2128 K 2 CoZr Initial concentration of Zr in alloy 0.65 wt % 3 Ri Initial value of tip radius 0.001 mm 4 Vi Initial value of dendrite tip velocity 2 mm/sec 5 Do Proportionality constant 0.492 mm2/sec 6 ao Length scale related to interatomic distance 0.000005 mm 7 Q Activation energy for diffusion 67,700 J∙mol−1 8 Γ Gibbs Thomson Coefficient 1.90 × 10⁻⁴ (K mm) 9 Rg Gas Constant 8.314 (J∙mol−1∙K−1)
10 G Thermal Gradient 100 K/mm
DOI: 10.4236/eng.2018.103007 95 Engineering front. Performing simulations employing data from other elements in a BMGMC system e.g. Cu, Al, Co, Ni is left for reader as an exercise and home work task.
4. Experimental
BMGMC samples were produced in two ways. Firstly, they are made in form of wedge using vacuum suction casting system in lab scale Vacuum Arc Melting (VAM) button furnace at CSIRO-Manufacturing. The process consists of care-fully calculating raw material based on weight percentage of each element in the alloy system. These powders/granules/chucks are subsequently mixed using hand spatulas to a homogeneity observable by naked eye. For their positioning, handling and control inside enclosed chamber of VAM furnace, they are wrapped in an aluminum foil which not only protects the powders but also serve as alloying element in sufficient quantity in original mix. This Aluminum foil wrapped toffee is placed in horizontal slot in the water cooled copper hearth of furnace at appropriate time after which, it is melted to get solid chuck/button for subsequent research. During second approach, casted wedge samples were sub-jected to laser solid forming (LSF) [66] in Additive Manufacturing setup. Model theory was developed and tailored to describe microstructure evolution during both processes.
5. Results and Discussion
Model works by explaining dendritic growth in cast alloys during solidification by manipulating physical process parameters with the change of heat and mass transfer coefficients. Its unique feature is it explains the behavior of multicom-ponent alloys in terms of transient state variables. An effort is made to keep con-stant values to a minimum to get real picture of actual physical processes. Boundary conditions of solidification phenomena are kept open which makes model more rigorous and robust and it is possible to apply this to a variety of al-loys systems under various conditions. Following results and graphs have been generated after writing script of solidification code and running it in MATLAB®.
Effect of heat dissipation on dendrite tip velocity
DOI:10.4236/eng.2018.103007 96 Engineering
Figure 6. Plot of solutal Peclet number Vs dendrite tip velocity for individual elements of BMGMC system.
DOI: 10.4236/eng.2018.103007 97 Engineering gain high velocity in the thick slurry of multicomponent systems at tip of den-drite or spheroid. Also, as the heat keeps on getting dissipated from its sur-rounding and it has relatively low atomic weight as compared to others, it does not attain high speed and gets stuck in its own region. This reasoning is based on atomic size, weight, electronic configuration and thermal conductivity of indi-vidual elements. However, no data exists about actual dendrite growth velocity of this complex BMGMC system and further experimental research is needed to measure this.
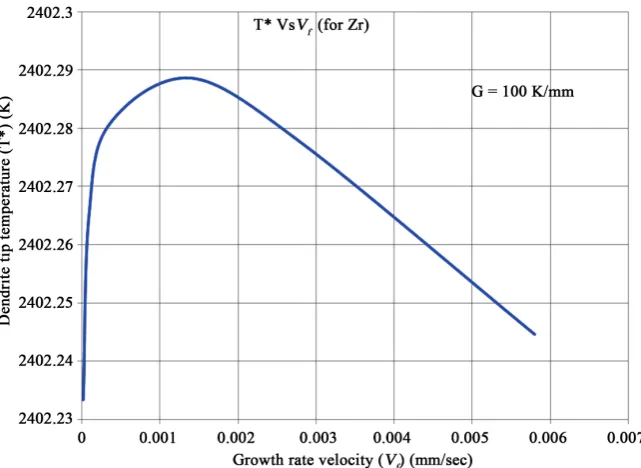
Effect of tip temperature on dendrite tip velocity
Below graph (Figure 7) shows relationship between dendrite tip velocity as a function of dendrite tip temperature for Zirconium only in the systems consi-dering it to be major alloying element. Graph shows three different regions which are distinctive of velocity evolution of Zr in the system as temperature change. There is a sharp increase in Ttip at slow Vf because dendrites are
[image:13.595.213.534.456.690.2]equiaxed in nature and due to their rapid mechanical interaction with each other a lot of heat is accumulated in small area. This is more evident in multicompo-nent alloys. Here, since only Zirconium is under consideration, so the large atomic size and weight of Zr also contribute towards increase of this value. This is early/initial stage of solidification. Another reason for this is there is planar wave front during initial stages which does not allow the development of high surface area i-e surface area/volume ratio remain low and not a lot of heat gets dissipated. This is also shown in previous works by Rappaz et al. [51] but as equiaxed to columnar transition (ECT) stage reaches, a stability region evolves. It happens due to very nice delicate balance between heat loss at dendrite tip and growth velocity of propagating solidification front. After that, again drop in Ttip
DOI:10.4236/eng.2018.103007 98 Engineering with increase in velocity is observed. This happens as Zr dendrite gain speed; it starts creating regions of very high surface/volume ratio around it in the body of melt and at the tip of advancing dendrite. In other words fast moving dendrites become source of high heat dissipation. Owing to this, temperature drops. Dis-crepancy between experimental values and simulation results is due to lesser number of iterative cycles which create low convergence. Hence, a temperature field with a deviation from actual values is observed. This anomaly could be re-moved by increasing iterations which enhances simulation efficiency and helps in model refinement. A decreasing trend in dendrite tip temperature is also ex-pected at higher thermal gradients (G) as this will provide a large sink for the heat to get dissipated away from liquid melt pool which eventually will lower the tip temperature even at low growth velocities.
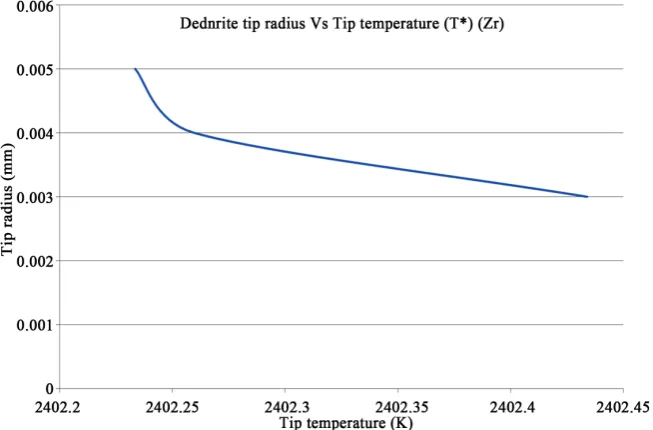
Effect of tip temperature on dendrite tip radius
[image:14.595.211.538.475.690.2]The effect of dendrite tip temperature on the evolved radius is shown in Fig-ure 8 below for Zirconium. This is a typical graph describing transient nature transport phenomena in metallurgical unit operations. At very high melting points liquid and solid fronts are immiscible with each other. Hence, no sharp interface/boundary is observed. As the alloy cools in mold / liquid melt pool of additive manufacturing, a distinct interface describing evolution of dendrite starts appearing. This effectively can be described in terms of curvature known as dendrite tip radius. The graph shows the behavior of this radius at different values of temperature and clearly shows that this radius decreases with the rise of temperature leading towards its complete disappearance near melting point. At lower tip temperatures, more time is available to solute to diffuse out of sol-vent to accumulate in the form of a mass which evolves in the form of radius of solidifying front. This radius can change from planar to dendrite depending on
DOI: 10.4236/eng.2018.103007 99 Engineering thermal gradient which is final description of microstructural phenomena in so-lidifying alloys [67]. These results are consistent with earlier observations [47] [61] and very recently observed phenomena of nanoscale solute partitioning in bulk metallic glass matrix composites [68]. This effect is not as sharp as observed in previous studies [47] because bulk metallic glass and their composites are sluggish alloys inherently and it is difficult to observe sharp interfaces and growth front in these materials specially at low thermal gradients (G).
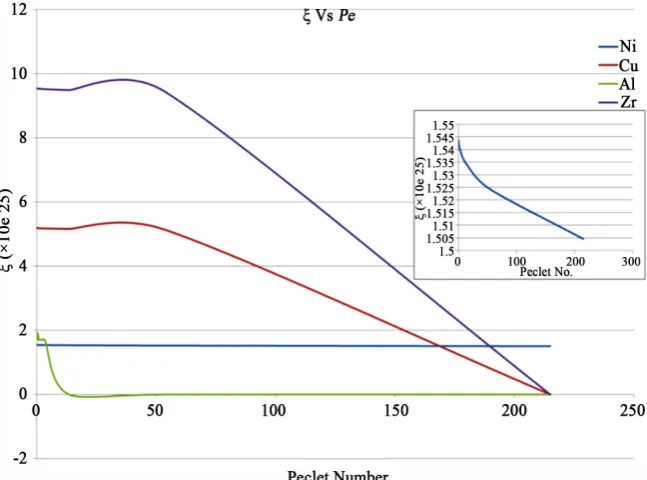
Effect of ξ (a function of Pei) on Pei
Below graph (Figure 9) is representation of ξ with respect to Peclet number. It briefly shows that ξ (which is a function of Pe) shows almost decreasing linear
relationship with the increase of rate of heat transfer from system to surround-ing for all major alloysurround-ing elements of hypoeutectic system at a fixed thermal gra-dient. It shows the effectivity of heat transfer process for BMGMC and describes that dissipation was proper and homogenous. The curves are generated by plot-ting solution of present model by the use of indigenous MATLAB code incorpo-rating different transient thermo-physical data of each individual alloy system from literature [64] [65] [69] [70] [71] [72]. Simulation results are in nice agreement with previously reported behavior of elements in alloy systems [62]. It clearly shows that ξ value finally turns to zero for all elements generating a nice synergy between simulation and experimental observations in high speed additive manufacturing processes.
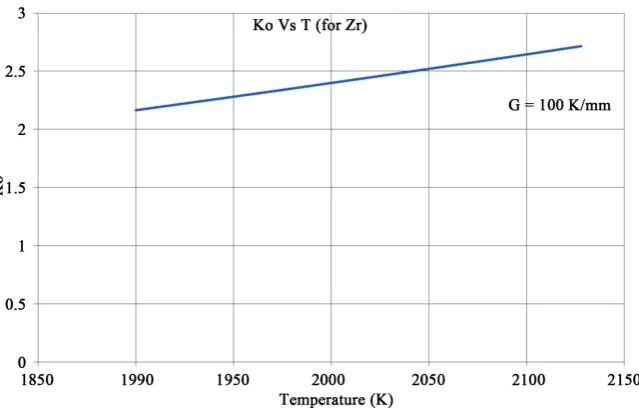
Evolution of segregation/partition coefficient with temperature
[image:15.595.213.537.462.702.2]This is very interesting graph (Figure 10) which shows the relationship be-tween temperature dependent partition coefficients as a function of increasing temperature itself. It shows that partition coefficient is not uniform in its behavior
DOI:10.4236/eng.2018.103007 100 Engineering
Figure 10. Plot of evolution of partition coefficient with temperature for Zr in BMGMC system at constant thermal gradient.
when studied over a temperature range. It evolves with the change/evolution of temperature. Although assumed to be, and observed to be almost linear, its evo-lution is highly dependent on the gap chosen to calculate the values. The smaller the temperature gap, better will be the representation of actual behavior or evo-lution of partition coefficient over that period. For simplicity reasons, this effect is not studied in detail and general assumption that it shows linearity of evolu-tion over temperature and time in the range of interest is made and adopted. Again, thermal gradient (G) is kept constant at 100 K/mm.
Effect of dendrite tip growth velocity on supersaturation
DOI: 10.4236/eng.2018.103007 101 Engineering (a)
[image:17.595.210.539.70.618.2](b)
Figure 11. (a) Plot of evolution of dendrite tip growth velocity as a function of supersa-turation for all alloying elements in Zr65Cu15Al10Ni10 BMGMC system at constant thermal
gradient; (b) Plot of evolution of dendrite tip growth velocity as a function of supersatu-ration for Ni in Zr65Cu15Al10Ni10 BMGMC system at constant thermal gradient.
6. Salient Features of Model
DOI:10.4236/eng.2018.103007 102 Engineering [47] [50] [51] [52] studies
1) Gandin, C.-A., M. Rappaz, and R. Tintillier, Three-dimensional probabilistic simulation of solidification grain structures: Application to superalloy precision castings. Metallurgical Transactions A, 1993. 24(2): p. 467-479.
2) Rappaz, M., et al., Analysis of solidification microstructures in Fe-Ni-Cr single-crystal welds. Metallurgical Transactions A, 1990. 21(6): p. 1767-1782.
3) Rappaz, M., et al., Development of microstructures in Fe-15Ni-15Cr single crystal electron beam welds. Metallurgical Transactions A, 1989. 20(6): p. 1125-1138.
4) Kurz, W., B. Giovanola, and R. Trivedi, Theory of microstructural development during rapid solidification. Acta Metallurgica, 1986. 34(5): p. 823-830.
5) Zhang, J., et al. Probabilistic simulation of solidification microstructure evolution during laser-based metal deposition. In Proceedings of 2013 Annual International Solid Freeform Fabrication Symposium—An Additive Manufactur-ing Conference. 2013.
Apart from these, its salient features are;
1) Supersaturation of individual elements was measured to account for overall behavior of multicomponent system—an approach missing in previous studies
2) Due to scarcity, dispersion and unavailability of data, a correlation from nearest possible element in same group in periodic table was used.
3) An effort was made to remove/reduce error by use of iteration based ap-proach to refine model.
4) Programming of model was done in MATLAB®—not done elsewhere
pre-viously.
5) Temperature dependent properties (transient heat transfer conditions) were used.
6) A unique approach based on segregation coefficient (k) as a function of temperature was adopted (Previously [47], it was only velocity dependent).
7) Slope of liquids (m) is taken to be concentration (C*) dependent.
8) Peclet number (Pe) & ξ are not taken as constant like previous studies
[Bo-badilla, M., J. Lacaze, and G. Lesoult, Journal of Crystal Growth, 1988. 89(4): p. 531-544] in which it is assumed
a) ξ = 1 (low growth rate) (low Pe)
b) ξ = 0 (very fast cooling rate—typical Additive Manufacturing conditions) 9) 2Γ/R = 1 (high velocity AM conditions).
10) New relation for dendrite tip temperature was developed.
NOTE: No physical microstructure was either reported previously or tried in present approach. Physical simulation is “not possible” at deterministic stage as it is numerical/analytical model which defines parameters for next stage proba-bilistic studies only.
7. Conclusions
DOI: 10.4236/eng.2018.103007 103 Engineering a) There is significant effect of initial metal temperature, composition, type of alloying elements, temperature gradient and thermo-physical properties on final microstructure developed as a result of heat and mass transfer phenomena.
b) Determination of supersaturation of individual elements yield best possible strategy for its correlation with superimposition of solute field around each dendrite tip.
c) Determination of dimensionless solutal Peclet number is the main factor responsible for accurate quantitative prediction of microstructure in solidifying alloys.
d) Dependence and evolution of ξ on, and with respect to solutal Peclet num-ber is decisive in explaining transient nature transport phenomena in additive manufacturing processes.
e) Employment of iterative process helps in refining the model and generates accurate results.
f) Final microstructure evolution is expressed in the form of dendrite tip tem-perature and dendrite tip radius as a function of growth rate/dendrite tip veloci-ty and must be carefully measured.
In essence, model comprises of extension of KGT theory for multicomponent systems beyond BLL model [62] employing real time temperature dependent conditions experienced in Additive Manufacturing. All these considerations must be taken into account while designing an alloy system (present case BMGMC) for a practical application processed by additive manufacturing. Any fault or carelessness will result in erroneous reading and in worst case scenario, catastrophic failure of components, parts and assemblies which must be avoided.
Acknowledgements
This work is partially supported by scholarship provided by RMIT University for tuition and living of author. Further, author would like to acknowledge moral support and encouragement provided by his primary supervisor (Dr. Dong Qiu) and Prof. Milan Brandt throughout the work and helpful discussion and con-structive criticism by Prof. Mark Easton. The authorization of gracious use of experimental facilities during short term stay at CSIRO and above average moral support by Dr. Daniel East is also gratefully acknowledged.
Competing Financial Interests
The author(s) declare no competing financial interests.
References
[1] Klement, W., Willens, R.H. and Duwez, P.O.L. (1960) Non-Crystalline Structure in Solidified Gold-Silicon Alloys. Nature, 187, 869-870.
https://doi.org/10.1038/187869b0
DOI:10.4236/eng.2018.103007 104 Engineering 2901-2904.https://doi.org/10.1103/PhysRevLett.84.2901
[3] Johnson, W.L. (1999) Bulk Glass-Forming Metallic Alloys: Science and Technology. MRS Bulletin, 24, 42-56.https://doi.org/10.1557/S0883769400053252
[4] Ashby, M.F. and Greer, A.L. (2006) Metallic Glasses as Structural Materials. Scripta Materialia, 54, 321-326.https://doi.org/10.1016/j.scriptamat.2005.09.051
[5] Flores, K.M. and Dauskardt, R.H. (1999) Local Heating Associated with Crack Tip Plasticity in Zr-Ti-Ni-Cu-Be Bulk Amorphous Metals. Journal of Materials Re-search, 14, 638-643.https://doi.org/10.1557/JMR.1999.0642
[6] Eckert, J., et al. (2007) Mechanical Properties of Bulk Metallic Glasses and Compo-sites. Journal of Materials Research, 22, 285-301.
https://doi.org/10.1557/jmr.2007.0050
[7] Das, J., et al. (2009) Designing Bulk Metallic Glass and Glass Matrix Composites in Martensitic Alloys. Journal of Alloys and Compounds, 483, 97-101.
https://doi.org/10.1016/j.jallcom.2008.08.139
[8] Das, J., et al. (2005) “Work-Hardenable” Ductile Bulk Metallic Glass. Physical Re-view Letters, 94, 205501.https://doi.org/10.1103/PhysRevLett.94.205501
[9] Choi-Yim, H. and Johnson, W.L. (1997) Bulk Metallic Glass Matrix Composites. Applied Physics Letters, 71, 3808-3810.https://doi.org/10.1063/1.120512
[10] Cheng, J.L. and Chen, G. (2013) \ Glass Formation of Zr-Cu-Ni-Al Bulk Metallic Glasses Correlated with L → Zr2Cu + ZrCu Pseudo Binary Eutectic Reaction. Jour-nal of Alloys and Compounds, 577, 451-455.
https://doi.org/10.1016/j.jallcom.2013.06.126
[11] Chen, M. (2011) A Brief Overview of Bulk Metallic Glasses. NPG Asia Materials, 3, 82-90.https://doi.org/10.1038/asiamat.2011.30
[12] Chen, M. (2008) Mechanical Behavior of Metallic Glasses: Microscopic Under-standing of Strength and Ductility. Annual Review of Materials Research, 38, 445-469.https://doi.org/10.1146/annurev.matsci.38.060407.130226
[13] Chen, H.S. (1974) Thermodynamic Considerations on the Formation and Stability of Metallic Glasses. Acta Metallurgica, 22, 1505-1511.
https://doi.org/10.1016/0001-6160(74)90112-6
[14] Akihisa, I., et al. (1988) Glass Transition Behavior of Al-Y-Ni and Al-Ce-Ni Amorphous Alloys. Japanese Journal of Applied Physics, 27, L1579.
https://doi.org/10.1143/JJAP.27.L1579
[15] Johnson, W.L., et al. (2011) Beating Crystallization in Glass-Forming Metals by Mil-lisecond Heating and Processing. Science, 332, 828-833.
https://doi.org/10.1126/science.1201362
[16] Jiang, M.Q., et al. (2010) Fractal in Fracture of Bulk Metallic Glass. Intermetallics, 18, 2468-2471.https://doi.org/10.1016/j.intermet.2010.08.003
[17] Qiao, J., Jia, H. and Liaw, P.K. (2016) Metallic Glass Matrix Composites. Materials Science and Engineering: R: Reports, 100, 1-69.
https://doi.org/10.1016/j.mser.2015.12.001
[18] Schroers, J. (2010) Processing of Bulk Metallic Glass. Advanced Materials, 22, 1566-1597.https://doi.org/10.1002/adma.200902776
[19] Greer, A.L. (2010) Materials Science: A Cloak of Liquidity. Nature, 464, 1137-1138.
https://doi.org/10.1038/4641137a
[20] Greer, A.L. (1995) Metallic Glasses. Science, 267, 1947-1953.
DOI: 10.4236/eng.2018.103007 105 Engineering [21] Yi, J., et al. (2016) Glass-Forming Ability and Crystallization Behavior of Al86Ni9La5
Metallic Glass with Si Addition. Advanced Engineering Materials, 18, 972-977.
https://doi.org/10.1002/adem.201500354
[22] Cheng, Y.Q., Sheng, H.W. and Ma, E. (2008) Relationship between Structure, Dy-namics, and Mechanical Properties in Metallic Glass-Forming Alloys. Physical Re-view B, 78, 014207.https://doi.org/10.1103/PhysRevB.78.014207
[23] Sarac, B. (2015) Microstructure-Property Optimization in Metallic Glasses. Sprin-ger, Berlin.
[24] Greer, A.L. (2011) Metallic Glasses: Damage Tolerance at a Price. Nature Materials, 10, 88-89.https://doi.org/10.1038/nmat2949
[25] Gu, X.W., et al. (2014) Mechanisms of Failure in Nanoscale Metallic Glass. Nano Letters, 14, 5858-5864.https://doi.org/10.1021/nl5027869
[26] Schroers, J. and Johnson, W.L. (2004) Ductile Bulk Metallic Glass. Physical Review Letters, 93, 255506.https://doi.org/10.1103/PhysRevLett.93.255506
[27] Schuh, C.A., Hufnagel, T.C. and Ramamurty, U. (2007) Mechanical Behavior of Amorphous Alloys. Acta Materialia, 55, 4067-4109.
https://doi.org/10.1016/j.actamat.2007.01.052
[28] Donovan, P.E. and Stobbs, W.M. (1981) The Structure of Shear Bands in Metallic Glasses. Acta Metallurgica, 29, 1419-1436.
https://doi.org/10.1016/0001-6160(81)90177-2
[29] Dodd, B. and Bai, Y. (2012) Adiabatic Shear Localization: Frontiers and Advances. Elsevier, Amsterdam.
[30] Gao, Y.F., et al. (2011) On the Shear-Band Direction in Metallic Glasses. Acta Mate-rialia, 59, 4159-4167.https://doi.org/10.1016/j.actamat.2011.03.039
[31] Greer, A.L., Cheng, Y.Q. and Ma, E. (2013) Shear Bands in Metallic Glasses. Mate-rials Science and Engineering: R: Reports, 74, 71-132.
https://doi.org/10.1016/j.mser.2013.04.001
[32] Jiang, M.Q., Wang, W.H. and Dai, L.H. (2009) Prediction of Shear-Band Thickness in Metallic Glasses. Scripta Materialia, 60, 1004-1007.
https://doi.org/10.1016/j.scriptamat.2009.02.039
[33] Leng, Y. and Courtney, T.H. (1991) Multiple Shear Band Formation in Metallic Glasses in Composites. Journal of Materials Science, 26, 588-592.
https://doi.org/10.1007/BF00588291
[34] Hajlaoui, K., et al. (2007) Unusual Room Temperature Ductility of Glassy Cop-per-Zirconium Caused by Nanoparticle Dispersions That Grow during Shear. Ma-terials Science and Engineering: A, 449-451, 105-110.
https://doi.org/10.1016/j.msea.2006.01.168
[35] Zhang, Y. and Greer, A.L. (2007) Correlations for Predicting Plasticity or Brittleness of Metallic Glasses. Journal of Alloys and Compounds, 434-435, 2-5.
https://doi.org/10.1016/j.jallcom.2006.08.094
[36] Lewandowski, J., Wang, W.-H. and Greer, A. (2005) Intrinsic Plasticity or Brittle-ness of Metallic Glasses.Philosophical Magazine Letters, 85, 77-87.
https://doi.org/10.1080/09500830500080474
[37] Kruzic, J.J. (2016) Bulk Metallic Glasses as Structural Materials: A Review. Ad-vanced Engineering Materials, 18, 1308-1331.
https://doi.org/10.1002/adem.201600066
DOI:10.4236/eng.2018.103007 106 Engineering [39] Schroers, J. (2005) The Superplastic Forming of Bulk Metallic Glasses. JOM, 57,
35-39.https://doi.org/10.1007/s11837-005-0093-2
[40] Guo, G.-Q., et al. (2015) Detecting Structural Features in Metallic Glass via Syn-chrotron Radiation Experiments Combined with Simulations. Metals, 5, 2093-2108.
https://doi.org/10.3390/met5042093
[41] Guo, G.-Q., et al. (2015) How Can Synchrotron Radiation Techniques Be Applied for Detecting Microstructures in Amorphous Alloys? Metals, 5, 2048-2057.
https://doi.org/10.3390/met5042048
[42] Zimmermann, G., et al. (2011) Investigation of Columnar-to-Equiaxed Transition in Solidification Processing of AlSi Alloys in Microgravity—The CETSOL Project. Journal of Physics: Conference Series, 327, 012003.
https://doi.org/10.1088/1742-6596/327/1/012003
[43] Zu, F.-Q. (2015) Temperature-Induced Liquid-Liquid Transition in Metallic Melts: A Brief Review on the New Physical Phenomenon. Metals, 5, 395-417.
https://doi.org/10.3390/met5010395
[44] Kim, D.H., et al. (2013) Phase Separation in Metallic Glasses. Progress in Materials Science, 58, 1103-1172.https://doi.org/10.1016/j.pmatsci.2013.04.002
[45] Ott, R.T., et al. (2005) Micromechanics of Deformation of Metallic-Glass-Matrix Composites from in situ Synchrotron Strain Measurements and Finite Element Modeling. Acta Materialia, 53, 1883-1893.
https://doi.org/10.1016/j.actamat.2004.12.037
[46] Rappaz, M. and Gandin, C.A. (1993) Probabilistic Modelling of Microstructure Formation in Solidification Processes. Acta Metallurgica et Materialia, 41, 345-360.
https://doi.org/10.1016/0956-7151(93)90065-Z
[47] Kurz, W., Giovanola, B. and Trivedi, R. (1986) Theory of Microstructural Develop-ment during Rapid Solidification. Acta Metallurgica, 34, 823-830.
https://doi.org/10.1016/0001-6160(86)90056-8
[48] Wei, Y.H., et al. (2007) Numerical Simulation of Columnar Dendritic Grain Growth during Weld Solidification Process. Science and Technology of Welding and Join-ing, 12, 138-146.https://doi.org/10.1179/174329307X164427
[49] Rappaz, M. and Blank, E. (1986) Simulation of Oriented Dendritic Microstructures Using the Concept of Dendritic Lattice. Journal of Crystal Growth, 74, 67-76.
https://doi.org/10.1016/0022-0248(86)90249-6
[50] Rappaz, M., et al. (1989) Development of Microstructures in Fe-15Ni-15Cr Single Crystal Electron Beam Welds. Metallurgical Transactions A, 20, 1125-1138.
https://doi.org/10.1007/BF02650147
[51] Rappaz, M., et al. (1990) Analysis of Solidification Microstructures in Fe-Ni-Cr Sin-gle-Crystal Welds. Metallurgical Transactions A, 21, 1767-1782.
https://doi.org/10.1007/BF02672593
[52] Gandin, C.-A., Rappaz, M. and Tintillier, R. (1993) Three-Dimensional Probabilis-tic Simulation of Solidification Grain Structures: Application to Superalloy Preci-sion Castings. Metallurgical Transactions A, 24, 467-479.
https://doi.org/10.1007/BF02657334
[53] Zhang, J., et al. (2013) Probabilistic Simulation of Solidification Microstructure Evolution during Laser-Based Metal Deposition. 24th Annual International Solid Freeform Fabrication Symposium—An Additive Manufacturing Conference, Aus-tin, 2013, TX,739-748.
De-DOI: 10.4236/eng.2018.103007 107 Engineering position and Micro-Rolling Process. Journal of Materials Science, 51, 6735-6749.
https://doi.org/10.1007/s10853-016-9961-0
[55] Gu, C., et al. (2017) A Three-Dimensional Cellular Automaton Model of Dendrite Growth with Stochastic Orientation during the Solidification in the Molten Pool of Binary Alloy. Science and Technology of Welding and Joining, 22, 47-58.
https://doi.org/10.1080/13621718.2016.1183962
[56] Nastac, L. (1999) Numerical Modeling of Solidification Morphologies and Segrega-tion Patterns in Cast Dendritic Alloys. Acta Materialia, 47, 4253-4262.
https://doi.org/10.1016/S1359-6454(99)00325-0
[57] Laurentiu, N. and Doru, M.S. (1997) Stochastic Modelling of Microstructure For-mation in Solidification Processes. Modelling and Simulation in Materials Science and Engineering, 5, 391.https://doi.org/10.1088/0965-0393/5/4/008
[58] Von Neumann, J. and Burks, A.W. (1996) Theory of Self-Reproducing Automata. University of Illinois Press, Urbana, IL.
[59] Reuther, K. and Rettenmayr, M. (2014) Perspectives for Cellular Automata for the Simulation of Dendritic Solidification—A Review. Computational Materials Science, 95, 213-220.https://doi.org/10.1016/j.commatsci.2014.07.037
[60] Mullins, W.W. and Sekerka, R.F. (1964) Stability of a Planar Interface during Solidi-fication of a Dilute Binary Alloy. Journal of Applied Physics, 35, 444-451.
https://doi.org/10.1063/1.1713333
[61] Langer, J.S. and Müller-Krumbhaar, J. (1977) Stability Effects in Dendritic Crystal Growth. Journal of Crystal Growth, 42, 11-14.
https://doi.org/10.1016/0022-0248(77)90171-3
[62] Bobadilla, M., Lacaze, J. and Lesoult, G. (1988) Influence des conditions de solidifi-cation sur le déroulement de la solidifisolidifi-cation des aciers inoxydables austénitiques. Journal of Crystal Growth, 89, 531-544.
https://doi.org/10.1016/0022-0248(88)90216-3
[63] Rafique, M.M.A., Qiu, D. and Easton, M. (2017) Modeling and Simulation of Mi-crostructural Evolution in Zr Based Bulk Metallic Glass Matrix Composites during Solidification. MRS Advances, 2, 3591-3606.
[64] Wu, K., Li, R. and Zhang, T. (2013) Crystallization and Thermophysical Properties of Cu46Zr47Al6Co1 Bulk Metallic Glass. AIP Advances, 3, 112115.
https://doi.org/10.1063/1.4832235
[65] Yamasaki, M., Kagao, S. and Kawamura, Y. (2005) Thermal Diffusivity and Con-ductivity of Zr55Al10Ni5Cu30 Bulk Metallic Glass. Scripta Materialia, 53, 63-67.
https://doi.org/10.1016/j.scriptamat.2005.03.021
[66] Yang, G., et al. (2012) Laser solid forming Zr-based bulk metallic glass. Intermetal-lics, 22, 110-115.https://doi.org/10.1016/j.intermet.2011.10.008
[67] Flemings, M.C. (1974) Solidification Processing. McGraw-Hill,New York. [68] Yang, L., et al. (2009) Nanoscale Solute Partitioning in Bulk Metallic Glasses.
Ad-vanced Materials, 21, 305-308.https://doi.org/10.1002/adma.200801183
[69] Mills, K.C. (2002) Front Matter A2—Recommended Values of Thermophysical Properties for Selected Commercial Alloys. Woodhead Publishing, Cambridge, iii. [70] Grimvall, G. (1999) Front Matter A2—Thermophysical Properties of Materials.
El-sevier Science B.V., Amsterdam, iii.
DOI:10.4236/eng.2018.103007 108 Engineering [72] Choy, C.L., et al. (1991) Thermal Conductivity of Amorphous Alloys above Room
Temperature. Journal of Applied Physics, 70, 4919-4925.
![Figure 2. Schematic of melt pool formation in additive manufacturing (EBM) and veloc-ity of heat source (reprinted with permission from Springer) [50]](https://thumb-us.123doks.com/thumbv2/123dok_us/9938235.495682/4.595.255.491.74.422/figure-schematic-formation-additive-manufacturing-reprinted-permission-springer.webp)
![Figure 3. (a) Schematic of growth in one cell; (b) Schematic diagram of movement of dendrite tip in a grid of cells represented by change of state index of each cell (reprinted with permission from Taylor and Francis Group) [48]](https://thumb-us.123doks.com/thumbv2/123dok_us/9938235.495682/5.595.212.539.523.680/schematic-schematic-movement-dendrite-represented-reprinted-permission-francis.webp)
![Figure 4. Schematic of crystallographic orientation of new nucleated grain as defined by three Euler Angles, θ, φ and ψ (reprinted with permission from Springer) [52]](https://thumb-us.123doks.com/thumbv2/123dok_us/9938235.495682/6.595.275.474.540.689/figure-schematic-crystallographic-orientation-nucleated-reprinted-permission-springer.webp)