Model Based Data Transmission: Analysis of Link Budget
Requirement Reduction
Jeremy Straub
Department of Computer Science, University of North Dakota, Grand Forks, USA Email: [email protected]
Received July 20, 2012; revised August 22, 2012; accepted September 23, 2012
ABSTRACT
Communications capability can be a significant constraint on the utility of a spacecraft. While conventionally enhanced through the use of a larger transmitting or receiving antenna or through augmenting transmission power, communica-tions capability can also be enhanced via incorporating more data in every unit of transmission. Model Based Transmis-sion Reduction (MBTR) increases the misTransmis-sion utility of spacecraft via sending higher-level messages which rely on pre- shared (or, in some cases, co-transmitted) data. Because of this a priori knowledge, the amount of information contained in a MBTR message significantly exceeds the amount the amount of information in a conventional message. MBTR has multiple levels of operation; the lowest, Model Based Data Transmission (MBDT), utilizes a pre-shared lower-resolu- tion data frame, which is augmented in areas of significant discrepancy with data from the higher-resolution source. MBDT is examined, in detail, herein and several approaches to minimizing the required bandwidth for conveying data required to conform to a minimum level of accuracy are considered. Also considered are ways of minimizing transmis- sion requirements when both a model and change data required to attain a desired minimum discrepancy threshold must be transmitted. These possible solutions are compared to alternate transmission techniques including several forms of image compression.
Keywords: Spacecraft Communications; Data Compression; Satellite Communications; Link Budget Reduction; Image
Format
1. Introduction
Any space mission must contend with degradation of communications performance as the spacecraft moves further from Earth. Commonly, larger transmitting or receiving antennas or increased transmission power are utilized to maintain the required data rate. However, for small satellites (such as SmallSat and CubeSat-class craft) power, mass and volume constraints preclude signifi- cantly boosting the signal strength, and thus effective data rate, through transmission antenna or power aug- mentation. The budgets of many of these programs, simi- larly, preclude procuring or leasing access to the larger an- tennas that would be required to increase signal strength/ reception and, thus, data rate from the ground station side.
For many missions, the science utility of the mission can be conceptualized as being a function of the data that is received by the ground station. The amount of data that is received, can be constrained by the sensors and equipment that generate it. However, in many cases these sensors can generate far more data than can be processed and transmitted by the spacecraft. Thus, onboard pro- cessing capabilities and transmission capabilities become
the bottleneck. Model-Based Data Transmission (MBDT) is not a panacea for this problem, as it trades the in- creased consumption of onboard processing resources for a decrease in the amount of bytes of data transmission required to transmit a given amount of information.
Model-Based Data Transmission is the lowest level of Model-Based Transmission Reduction (MBTR), which is a set of methods for transmitting higher-level and more meaningful messages. Each MBTR message conveys sig- nificantly more data than a message under the conven- tional transmit-each-data-element approach. Each level of MBTR requires progressively more onboard computa- tional resources to perform.
2. Background
Bozzi et al. [1] state that data compression is not gene- rally used on deep-space missions. Despite this, smaller spacecraft, such as SmallSats and CubeSats, will gene- rally require some form of compression, particularly when they go beyond Earth orbit. This is necessitated by the small spacecraft size and the level of data transmis-sion required to achieve mistransmis-sion objectives.
sions. The Helioseismic Magnetic Imager (HMI) Instru- ment aboard the Solar Dynamics Observatory, for exam- ple, has utilized compression as part of its mission design [2]. The HMI uses hardware image processing boards to crop images and perform lossless compression. The de- sign for the High Time Resolution Spectrometer (HTRS) instrument on the International X-ray Observatory, uti- lizes compression for lists of time stamp, silicon drift de- tector and energy data [3]. Planning simulations indi- cated that up to a 50% compression level was achievable for this type of data, when CPU-intensive compression software was utilized.
In response to a failure of the high-gain antenna, the Galileo mission utilized an image compression approach similar to that used by the JPEG standard [4]. An order of magnitude of improvement in the level of images and other data was achieved, compared to pre-failure esti- mates of the transmission capabilities of the low-gain antenna [5].
Faria et al. [6] compared, for satellite imagery appli- cation purposes, a variety of image compression tech- niques. Their work proffers that compression ratios of up to 353.5 may be possible; however, the quality (and thus suitability) of imagery at these high levels of compres- sion is unclear.
3. MBTR Framework
The MBTR paradigm (presented in [7,8]) is a “game changing” approach to space communications. Unlike traditional communications models which transmit nu- merous discrete or related data elements for analysis on Earth, MBTR performs onboard analysis. MBTR con- sists of four different levels of onboard processing activi- ties. Each progressively higher level encapsulates the activities of the lower levels, requiring more onboard processing capabilities and producing messages which convey a greater level of meaning per unit of data trans- fer.
The lowest level of MBTR is Model-Based Data Transmission (MBDT), which is the primary subject of this paper. Under MBDT, both the spacecraft and the ground station begin with a pre-shared low-resolution version of the data of interest. For imagery, for example, this might be an image taken by an Earth-based or Earth- orbiting satellite. This low-resolution data set is utilized as a model to which changes are applied. Transmission requirements are thus reduced because only the changes (not the whole data set) must be transmitted to mission scientists.
The second level of MBTR is Model-Based Data Analysis (MBDA). Under MBDA, context-aware data analysis is performed to identify the most important areas of model discrepancy for transmission. This requires contextual understanding and a framework under which
to evaluate the importance of each prospective model change (which may or may not include the discrepancy- level-based metric used in MBTR as well as other me- trics).
Model-Based Result Transmission (MBRT), the third level of MBTR, extends MBDA through additional ana- lysis. Under MBRT, data is prioritized based on the par- ticular thesis (and the associated priority of the thesis) that it helps support or refute and the judged-level of support or refutation that it provides. MBRT, thus, begins to look at data from a mission utility maximization per- spective.
The highest level of MBTR, Model-Based Findings Transmission (MBFT), maximizes the value of the com- munications link. Under MBFT, the base model of the phenomena of interest is revised based on data-driven changes. The model updates are reviewed to determine whether they are relevant to the mission-objective-driven findings. Differences between the a priori projected find- ings and those arrived at through proximal and in-situ
data collection are prioritized based on their signifi- cance. Updated findings are transmitted to ground con- trollers along with supporting data that allows the proper operation of the onboard autonomous software to be va- lidated. This validation data also serves to allow the sci- entific community to conduct a rigorous review of mis- sion operations.
4. Discussion of Data versus Transmission
Requirements
To effectively compare the value provided by different levels of MBTR (described in Section 3), it is necessary to create two definitions of data. The first, transmitted data, is (as the name suggests) the amount of data sent over the communications link, ignoring transmission protocol overhead. The second, effective data, is the amount of knowledge/information that is provided by the transmission. This is estimated, for comparison purposes, through ascertaining the amount of data that would be required to be transmitted with a conventional approach to provide the knowledge obtained.
For illustrative purposes, under MBFT, a finding might be transmitted requiring 10 kilobytes of finding data and 1.5 megabytes of validation data. Presuming that the spacecraft was configured to send only 1% of data for verification, under a conventional approach, this would have required 150 megabytes of data. Thus, the transmitted data would be 1.51 megabytes and the effec- tive data would be 150 megabytes.
5. Discussion of MBTR Advantages and
Disadvantages
Earth-orbiting missions. At its highest level of operation, it removes most of the data transmission required and simply transmits scientific findings and limited data to justify the conclusion. This is akin to a journal article: the experiment and conclusion are presented along with summary data and examples to explain the experimental process and convince the reader of its proper implemen- tation. However, unlike a journal article, where the re- searcher retains the data for later review or re-use by others in the scientific community, the data supporting the MBTR conclusions survives only as long as the mis-sion craft—and there may be insufficient time before the craft’s intended or incidental end-of-life to bring back even a portion of the data on which a conclusion is based. Onboard storage re-use requirements may even necessi- tate the loss of this data prior to the end of the mission. This is the fundamental dilemma of the MBTR paradigm. Findings from MBTR will likely only be a component of understanding a particular phenomenon, and will need to be combined with other observations (including, per- haps, other sets of MBTR findings) to produce a level of insight comparable to the typical journal article. None the less, the unavailability of the underlying data pits the standard scientific process against a desire for maximiz- ing scientific understanding. One can either limit re- search to what the link budget can support full data transfer for—or embrace a new model where scientific rigor is based on testing and trusting the process—but not being able to review each and every piece of individual data.
Fortunately, MBDT does not suffer from this particu-lar problem. With MBDT, all of the data is still returned. However, the level of minimum guaranteed quality (MGQ) is the subject of decision-making. Later sections present the trade-off between guaranteeing a higher level of MGQ and reducing transfer requirements. Conven- tional wisdom [1] seems to be that no level of loss should be accepted; however, this ignores the fact that the reso- lution of the image is inherently a quality standard. Just as data is lost through using lower than sub-atomic-scale resolution, data is lost through compression and other processing as well. MBDT, however, can be configured to attempt to maximize the transmission of important data through providing priority to dissimilar pixels (or pixel clusters) in an area—thus increasing resolution on anomalies while limiting the transmission cost for areas of minor fluctuation.
6. MBDT for Image Data
Many space missions transmit image data. This data is analyzed for scientific analysis purposes and it is also made available to members of the public for viewing. Thus, transmitted image data must, generally, be both highly accurate and pleasant to view. Techniques which
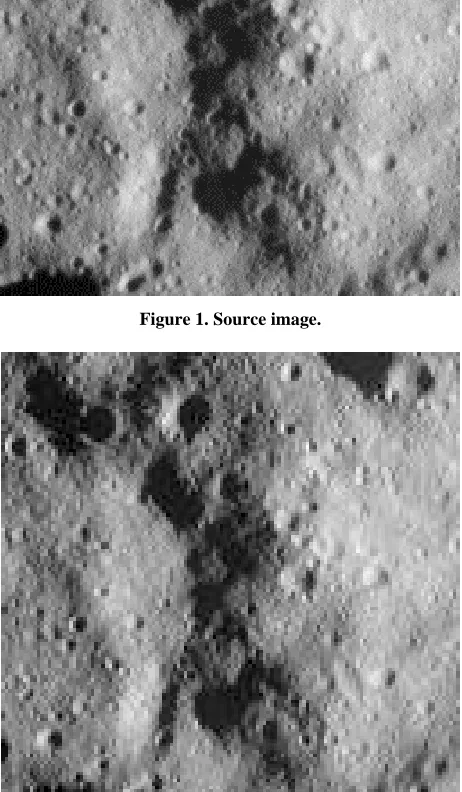
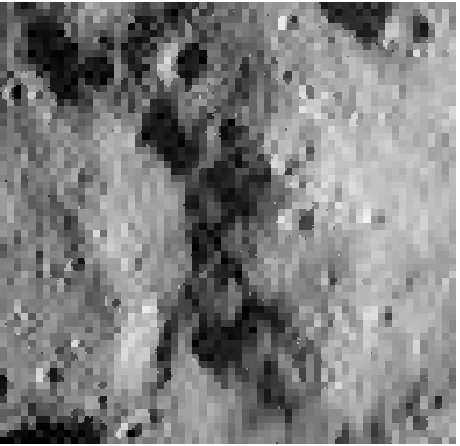
diminish data accuracy while maintaining smoothness (and other viewing pleasantness metrics) or which main- tain accuracy while causing pixilation (or other arti- facting which makes the image appear less natural) are not, generally, acceptable. Figures 1-3 allow a compari- son of the source image to images that are visually pleas- ing and more accurate, but less visually pleasing.
6.1. Overview
[image:3.595.308.539.222.459.2]Two uses for MBDT for image data are examined. In the
Figure 1. Source image.
[image:3.595.308.539.304.700.2]Figure 3. JPEG image, storage quality 90, enhanced from 50% × 50% of original height and width to 20% MGQ.
first, a shared a priori low-resolution image exists which is used as a model. This image could be a low-resolution image taken from Earth (or an Earth-orbiting telescope). In the second, no model exists or the model is judged to be so divergent from the higher-resolution data as to be unhelpful for reducing data transmission requirements. In this latter case, a down-scaled image is created from the source-scale data and utilized as a model. This low-reso- lution model must be transmitted along with the MBDT aug- mentation/correction data.
In both cases, the model image up-scaled to the source- scale and compared to the source-scale imagery. Devia-tions between the two are identified and assessed to de-termine whether they merit transmission inclusion. Se- veral metrics can be included in this assessment. These include the single-pixel difference value as well as the difference values of surrounding pixels. Generally, it is presumed that pixels with a higher level of difference or areas that are more divergent from the model than ave- rage represent higher-value data. However, this may not be true in all applications and, thus, the relative weight- ing of these metrics must be configured for each particu- lar application. Tables 1 and 2 show the data transmis-sion requirements for transmitting model updates and the model and model updates, respectively, at various levels of model size and MGQ threshold values.
MGQ is defined as the maximum level of divergence between a data element in the model (e.g., low resolution image) and the high-resolution data. Any variance over the MGQ threshold will result in the inclusion of a cor- rective message element in the MBDT transmission. However, the MGQ should not be equated to a standard
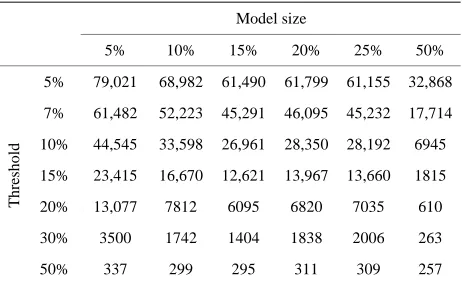
Table 1. Data transmission required for model updates for different model sizes & threshold values.
Model size
5% 10% 15% 20% 25% 50%
5% 79,021 68,982 61,490 61,799 61,155 32,868
7% 61,482 52,223 45,291 46,095 45,232 17,714
10% 44,545 33,598 26,961 28,350 28,192 6945
15% 23,415 16,670 12,621 13,967 13,660 1815
20% 13,077 7812 6095 6820 7035 610
30% 3500 1742 1404 1838 2006 263
T
h
re
shold
[image:4.595.308.539.111.253.2]50% 337 299 295 311 309 257
Table 2. Data transmission required for model and model updates for different model sizes & threshold values.
Model size
5% 10% 15% 20% 25% 50%
5% 79,349 70,293 64,440 67,042 69,347 65,636
7% 61,810 53,534 48,241 51,338 53,424 50,482
10% 44,873 34,909 29,911 33,593 36,384 39,713
15% 23,743 17,981 15,571 19,210 21,852 34,583
20% 13,405 9123 9045 12,063 15,227 33,378
30% 3828 3053 4354 7081 10,198 33,031
T
h
re
shold
50% 665 1610 3245 5554 8501 33,025
or average level of error. Most data elements (e.g., pixels for image data) will have an error level that is lower than the MGQ threshold.
Tables 1 and 2 show that the required level of correc-
tive data declines as the model size is increased (com- parative to the size of the source data) and acceptable MGQ is increased. At the highest quality (lowest ac- ceptable MGQ) and smallest model (highlighted on the tables) sizes, the data transmission requirement actually exceeds the requirement to transmit the whole, uncom- pressed image. The transmission requirements are less for other MGQ threshold and model size combinations.
6.2. Data Format
For images, the model change description language con- sist of three parts: a header, section header, and section data [7]. Data segmentation is utilized to allow for the use of local addressing. Local addressing precludes need ing to transmit several bytes of identifying information for each pixel-change (as would be required in the global context).
6.2.1. Header
[image:4.595.308.539.292.432.2]mission identification field, transmission sequence num- ber, date and time stamp field, and a validation field. Each of the above fields is of variable length. The fields are delimited by the ASCII 13 carriage return character. When implemented, the MBDT transmission data will be further encapsulated through lower-level transmission protocols.
The locally unique craft identification field identifies the source craft. This field is included to facilitate (via identifying the original source) a craft relaying data for another. At higher MBTR levels, crafts may also process data. If image data, for example, is processed into a high- er-level data product, the processing craft will transmit only results and associated validation data, (based on the data from the lower level craft). The validation data would be stamped with the ID of the collecting craft, while the higher-level data product would be stamped with the ID of the producing craft.
The transmission identification field is required for two reasons. First, it uniquely identifies the transmission. This allows reconstruction of a transmission that spans multiple high level messages. The use of multiple mes- sages is anticipated in cases where high priority data may be transmitted immediately (or with limited delay), and lower-priority is transmitted later (e.g., on a space-avai- lable basis).
The transmission identification field also identifies the data type being sent and the object or target to which it relates. The format of this field is not specified, allowing the individual mission designer choose a format best sui- ted to the mission.
The transmission sequence number field identifies subsequent messages that are part of a particular trans- mission. The messages for individual-pixel changes used for the experiment described herein do not require this. However, for region-level changes, where pixel level changes could be applied over top of them, the order in which to perform the changes is critical.
The validation field stores a hash value or checksum which can be utilized to validate that the data has not been modified (due to interference, error or intentionally) during transmission. It is left to the implementer to de- termine the validation method best suited for a given mission. This service may be provided by lower level protocols and, if so, this field may be left blank.
6.2.2. Section Header
Section headers are utilized for identifying the location of the section inside the image. A section, which is de- fined by an X, Y coordinate pair, is 256 × 256 pixels. Be- cause of this, each local address is represented by a sin- gle byte. The section header consists of section location and length fields. The section location field is two five- byte values. The length field is two bytes.
6.2.3. Section Data
Section data follows the section header. The format of section data is data-type specific. For image files, it con- sists of local coordinates and the change to be made, for each change. Two approaches for section data coordi- nates can be utilized. If it is expected that few changes will be required (e.g., an average of less than one per line), the coordinate set will consist of one-byte x and y coordinates. If it is expected that one or more changes will be required per line, then only the x coordinate is included. Under this format, lines are delimited by set of all zeros (x-coordinate = 0, change value = zeros). As the coordinate system starts from a minimum 1, 1 point, the zero value is not ambiguous.
7. Introduction of Image Compression
[image:5.595.307.540.459.578.2]The above (Section 6.1) presumes that the model is a bitmap image. This format is lossless; however, it is not particularly efficient if co-transmission is required. In cases where the image model must be transmitted along with the MBDT data, the utilization of compression may be advantageous. Table 3 shows the transmission re- quirements for models with different levels of JPEG compression and MGQ threshold values. Table 4 shows the combined transmission requirements for the JPEG- compressed model and the MBDT data for different le- vels of JPEG compression and MGQ threshold values.
Table 3. MBDT data required for various MGQ threshold levels and levels of JPEG compression.
JPEG compression setting
10 30 50 70 90
5% 36,149 18,017 12,723 7065 317
10% 5917 1095 483 297 257
15% 867 275 259 257 257
25% 263 257 257 257 257
T
h
re
shold
50% 257 257 257 257 257
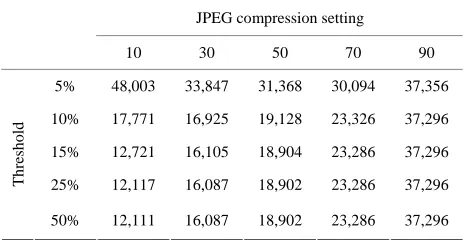
Table 4. MBDT and model data required for various MGQ threshold levels and levels of JPEG compression.
JPEG compression setting
10 30 50 70 90
5% 48,003 33,847 31,368 30,094 37,356
10% 17,771 16,925 19,128 23,326 37,296
15% 12,721 16,105 18,904 23,286 37,296
25% 12,117 16,087 18,902 23,286 37,296
T
h
re
shold
[image:5.595.307.539.616.736.2]Table 3 shows that at many combinations of levels of JPEG compression and MGQ threshold (highlighted in the table), the JPEG compression alone is suitable to provide the level of quality required. Because of the de- cision to utilize the data format, for comparison purposes, for section data where a line is included for each line of data (see Section 6.2.3), the minimum possible transmis- sion level required is 257 bytes. However, this equates to no actual corrective data being transmitted. Table 4 shows that the optimal JPEG quality setting varies based on the MGQ threshold desired, with higher levels of MGQ thresholds being most optimally transmitted through the utilization lower JPEG-quality-levels.
8. Evaluating Comparative Performance
Its desirable to be able to quantify the quality of images transmitted via a combination of MBDT and data com- pression. While the MGQ threshold value is a standard that cannot be exceeded on a pixel-by-pixel basis, it does not provide any metric for the error level for the whole image. Such a metric is required for comparing various forms of compression and augmentation. One commonly used metric (e.g., [9-12]) is pixel difference. Table 5 reports the average pixel difference (the sum of the ab- solute value of all differences in the image divided by the number of pixels present) as a function of threshold value and JPEG compression setting.
[image:6.595.57.287.466.586.2]With a metric for image quality, it is now possible to evaluate performance relative to file size. Table 6 pre-
Table 5. Average pixel difference values.
JPEG compression setting
10 30 50 70 90
5% 0.01865 0.02026 0.01989 0.01933 0.01254
10% 0.03473 0.02879 0.02588 0.02250 0.01257
15% 0.03928 0.02950 0.02607 0.02255 0.01261
25% 0.04006 0.02952 0.02608 0.02255 0.01261
T
h
re
shold
[image:6.595.307.538.482.721.2]50% 0.04007 0.02952 0.02608 0.02255 0.01261
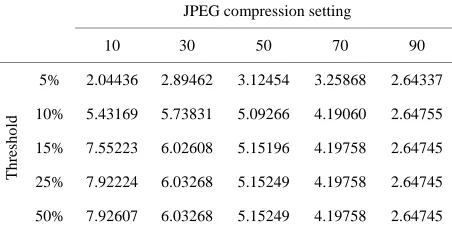
Table 6. Image quality as a function of file size.
JPEG compression setting
10 30 50 70 90
5% 2.04436 2.89462 3.12454 3.25868 2.64337
10% 5.43169 5.73831 5.09266 4.19060 2.64755
15% 7.55223 6.02608 5.15196 4.19758 2.64745
25% 7.92224 6.03268 5.15249 4.19758 2.64745
T
h
re
shold
50% 7.92607 6.03268 5.15249 4.19758 2.64745
sents this using a metric of the average pixel difference subtracted from one and divided by the file size (in 1/10 megabyte units).
Based on this metric, the low JPEG quality value and high MGQ threshold maximizes the quality/file size met- ric. This metric, however, fails to consider that a mini- mum quality level may be required for some applications and that any image with a quality below this level, thus, contains no useful data.
Table 5 shows that the minimum average pixel dif-
[image:6.595.58.284.619.735.2]ference value (APDV) is obtained through the combina- tion of the 5% MGQ threshold and using a JPEG storage quality level of 90. This minimum APDV, however, doesn’t correlate with the best performance in terms of the image quality as a function of file size (IQFFS) met- ric. The IQFFS metric is maximized with the lowest JPEG storage quality value (q = 10) and highest MGQ threshold (50%). The worst performance, is quite logi- cally, the MGQ threshold of 5% and JPEG storage qual- ity setting of 10, as at this MGQ level, the most number of MBDT corrections are required to raise the low sto- rage level to the high quality (low MGQ threshold) re- quired.
Table 6 also demonstrates that the IQFFS metric will
plateau at points where the JPEG storage quality level meets the MGQ threshold on its own. The JPEG storage quality levels of 30 and 50, for example, plateau (show- ing no improvement) between the 25% and 50% MGQ levels. JPEG quality levels of 70 and 90 show similar effects, starting at the 15% MGQ threshold. Figures 4-6 depict the visual quality of JPEG quality settings of q = 10, q = 50 and q = 90, respectively.
9. Comparing Compression Techniques
While a format very similar to the JPEG format has been used in space previously [4], it is only one of numerous compression technologies that are available for use. Ta-
ble 7 compares the size of several different image for-
[image:7.595.58.285.83.310.2] [image:7.595.57.288.336.568.2]mats (including several different levels of JPEG com- pression). Table 8 presents the average pixel difference values for each image type. Note that several image for- mats are loss-less or do not result in loss in this instance.
Table 7 shows that the most optimal format to com-
bine with MBDT to achieve the 5% MGQ standard is JPEG, with a storage quality level of 70. While the image file size is higher than other JPEG quality levels (10, 50), the combination of minimizing file size and MBDT cor- rections occurs there. The APDV metric, on the other hand, is maximized by the lossless (generally, or in this instance) image formats, as shown in Table 8.
10. Comparison of Dithering and
Non-Dithering Upsizing Methods
Figure 5. JPEG with image storage quality, q = 50.Previous work [7] showed an improvement in perfor- mance when dithering occurred due to upsizing an image that could not be upsized on a pixel-to-fixed-multiple- of-pixels (where each pixel in the small image corre- sponded to a × b pixels in the upscaled image). A dither- ing approach was compared to a non-dithered approach. The data requirement for MBDT transmissions for two image sizes and four threshold levels are presented for both dithered and non-dithered upsizing in Table 9. In all cases, the non-dithered approach out-performed the dither- ed approach. Given the prior performance [7], additional investigation will be conducted to evaluate the compara-tive performance of various dithering techniques as a way of possibly further enhancing MBDT.
11. Combining Image Compression and
Reduced Resolution
[image:7.595.53.540.611.659.2]Combining image compression and a reduced model im- age size maximizes the IQFFS metric. Table 10 shows the data levels for MBDT messages required to reach a Figure 6. JPEG with image storage quality, q = 90.
Table 7. File sizes for different image formats and associated MBDT data.
BMP PNG TIFF JPG-10 JPG-50 JPG-70 JPG-90
Base 198,458 38,958 44,290 11,854 18,645 23,029 37,039
[image:7.595.62.536.687.737.2]5% MGQ 198,458 38,958 44,290 48,003 31,368 30,094 37,356
Table 8. Average pixel difference for different image formats and with the use of MBDT augmentation.
BMP PNG TIFF JPG-10 JPG-50 JPG-70 JPG-90
Base 0 0 0 0.03982 0.02563 0.02198 0.01159
Table 9. Comparison of dithering-based and non-dithering upsizing approaches.
Dithered Not Dithered
50% 25% 50% 25%
5% 47,365 70,225 37,971 61,101
10% 15,873 35,161 10,865 28,165
15% 5739 17,653 3793 13,647
T
h
re
shold
[image:8.595.304.540.122.233.2]20% 2255 8599 1413 7031
Table 10. MBDT message size required to reach various MGQ threshold level for multiple image sizes and levels of JPEG quality.
JPEG q = 70 JPEG q = 90
50% 25% 50% 25%
5% 41,440 57,078 34,882 51,540
10% 9292 21,312 6882 17,788
15% 1862 7876 1430 6618
T
h
re
shold
20% 492 2892 380 2620
25% 290 1170 262 1126
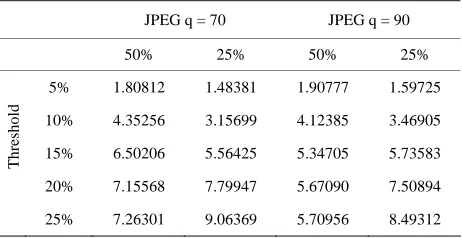
given MGQ threshold. Table 11 combines the MBDT messages and model image file size. Table 12 presents the average pixel difference for each JPEG quality level, threshold MGQ level, and model image size. Table 13 presents the resulting image quality as a function of file size, using the IQFFS metric previously described. The combination of JPEG 70 storage quality, a 25% × 25% height and width and a MGQ threshold of 25% maxi- mizes the performance, among the tested scenarios, pro- ducing an IQFFS metric value of 9.06. Note that this combined approach out-performs the JPEG-compression- only approach: producing a superior IQFFS value at a MGQ threshold of 25% to what was produced by JPEG compression at MGQ of 50%.
[image:8.595.57.288.257.367.2]The best performing combination, in terms of IQFFS, is neither the best performing in terms of MBDT mes- sage size or APDV. MBDT message size, the metric that one would seek to minimize if the model was not being co-transmitted, is minimized by the JPEG q = 90, model size of 50% × 50% height and width at all MGQ thresh- old levels. The best performance for APDV is provided by the JPEG q = 70, model size of 25% × 25% height and width at the MGQ 5% threshold level. Note that at higher MGQ levels, the best performing APDV for the level is provided by the JPEG q = 90, model size 50% × 50% height and width. It appears that given the signifi- cant number of MBDT updates required to meet the 5% MGQ threshold, the condition that required the most modifications (JPEG q = 70, model size of 25% × 25% height and width) out performed due to a near brute-force
Table 11. MBDT messages and image size required to reach various MGQ threshold level for multiple image sizes and levels of JPEG quality.
JPEG q = 70 JPEG q = 90
50% 25% 50% 25%
5% 54,305 66,300 51,422 61,556
10% 22,157 30,534 23,422 27,804
15% 14,727 17,098 17,970 16,634
T
h
re
shold
20% 13,357 12,114 16,920 12,636
25% 13,155 10,392 16,802 11,142
Table 12. Average pixel difference at various MGQ threshold level for multiple image sizes and levels of JPEG quality.
JPEG q = 70 JPEG q = 90
50% 25% 50% 25%
5% 0.01810 0.01624 0.01898 0.01679
10% 0.03560 0.03604 0.03411 0.03546
15% 0.04244 0.04862 0.03913 0.04590
T
h
re
shold
20% 0.04422 0.05517 0.04048 0.05117
25% 0.04455 0.05810 0.04068 0.05370
Table 13. Image quality as a function of file size for various MGQ threshold level for multiple image sizes and levels of JPEG quality.
JPEG q = 70 JPEG q = 90
50% 25% 50% 25%
5% 1.80812 1.48381 1.90777 1.59725
10% 4.35256 3.15699 4.12385 3.46905
15% 6.50206 5.56425 5.34705 5.73583
T
h
re
shold
20% 7.15568 7.79947 5.67090 7.50894
25% 7.26301 9.06369 5.70956 8.49312
(replacing more pixels with actual values) approach. The best performing in terms of the IQFFS metric does cor- relate with the best performing condition in terms of file size: JPEG q = 70, 25% × 25% height and width with a 25% MGQ threshold in both cases.
12. Evaluation of Combined Model
The MBDT approach outperforms JPEG compression in terms of the IQFFS metric. Based on the trends observed, it would seem likely that even higher IQFFS scores could be generated by testing lower JPEG storage quality levels and smaller model sizes.
[image:8.595.305.539.270.383.2] [image:8.595.308.539.429.548.2]arbitrary weighting between the average pixel difference and the file size. The metric will increase with decreased file size or decreased pixel error (APDV); however, the comparative level of change for a change in file size versus error can be set at numerous levels. The compara- tive benefit of quality versus transmission cost will clearly need to be evaluated by application/mission plan- ners. For this reason, the components of the IQFFS met-ric have been presented for all of the various experi- ments performed, allowing the reader to review the per- formance of the various experimental conditions in terms of his or her own preferred weighting between size and quality.
Figures 7 and 8 show the best performing images in
terms of the IQFFS and APDV metrics, respectively.
Figure 9 shows the best performing image in terms of
MBDT message minimization. A visual comparison of these images clearly indicates that IQFFS is not an ap- propriate metric for maximizing human viewing pleasure. However, the images presented in both Figures 8 and 9 would appear suitable. Figure 9, in particular, shows the utility of using MBDT to provide higher resolution ima- gery based on the enhancement of a pre-shared model.
13. Conclusions and Future Work
[image:9.595.308.539.84.315.2]The work presented demonstrates the value of using model based data transmission. In the case where a pre-shared, lower-resolution model is available, data transmission can be reduced significantly. Even if a model is not available, however, MBDT can be utilized to maximize the utility of the available bandwidth. Via
Figure 7. Best performing image in terms of IQFFS, JPEG q = 70, MGQ threshold = 25% and model size of 25% × 25% height and width.
Figure 8. Best performing image in terms of MGQ, JPEG q = 70, MGQ threshold = 5% and model size of 25% × 25% height and width.
Figure 9. Best performing image in terms of MBDT mes- sage minimization, JPEG q = 90, MGQ threshold = 25% and model size of 50% × 50% height and width.
utilizing MBDT, a minimum level of quality can be guaranteed and/or features can be prioritized based on their importance (which is presumed to be a function of a given area’s discrepancy from the model).
[image:9.595.58.288.476.699.2]example. High-resolution data very likely exists for the area (possibly even taken by the same satellite that will re-image it after the disaster). Using MBDT, differences can be identified and prioritized based on the level of difference. Not only does this reduce the bandwidth re- quired for transmission (allowing responders to obtain the data more quickly), it also highlights areas where focus is needed (e.g., those areas that have presumably been impacted by the disaster).
Future work will focus on evaluating MBDT with a larger data set, evaluating its use in a disaster scenario and characterizing the performance (in terms of knowl- edge gained per byte transmitted) of other MBTR levels. This will allow the relative performance the MBTR le- vels to be compared in terms of a common metric. Fur-ther, application-specific performance metrics will be ex- plored to facilitate an analysis of MBDT/MBTR per- formance in terms of user application performance met- rics.
14. Acknowledgements
Small satellite development work at the University of North Dakota is funded by the North Dakota Space Grant Consortium, the UND Faculty Research Seed Money Committee and North Dakota NASA EPSCoR.
REFERENCES
[1] M. Bozzi, M. Cametti, M. Fornaroli, P. Maguire, S. Marti, M. Pasian, K. Perregrini and S. Rawson, “Future Archi- tectures for European Space Agency Deep-Space Ground Stations [Antenna Applications Corner],” Antennas and Propagation Magazine, Vol. 54, No. 1, 2012, pp. 254-263. doi:10.1109/MAP.2012.6202560
[2] J. Schou, et al., “Design and Ground Calibration of the Helioseismic and Magnetic Imager (HMI) Instrument on the Solar Dynamics Observatory (SDO),” Solar Physics, Vol. 275, No. 1-2, 2012, pp. 229-259.
doi:10.1007/s11207-011-9842-2
[3] D. Barret, et al., “The High Time Resolution Spectrome- ter (HTRS) aboard the International X-Ray Observatory (IXO),” Proceedings of SPIE, Vol. 2011, No. 3, p. 77321M.
[4] K. Cheung, M. Belongie and K. Tong, “End-to-End Sys- tem Consideration of the Galileo Image Compression System,” TDA Progress Report 42-126, 1996.
[5] R. Lutz, “Software Engineering for Space Exploration,” IEEE Computer, Vol. 44, No. 10, 2011, pp. 41-46. doi:10.1109/MC.2011.264
[6] L. Faria, L. Fonseca and M. Costa, “Performance Evalua- tion of Data Compression Systems Applied to Satellite Imagery,” Journal of Electrical and Computer Engineer- ing, Vol. 2012, No. 2012, 2012, 15 p.
doi:10.1155/2012/471857
[7] J. Straub, “Reducing Link Budget Requirements with Model-Based Transmission Reduction Techniques,” Pro- ceedings of the 26th Annual AIAA/USU Conference on Small Satellites, Logan, 13-16 August 2012.
[8] J. Straub, “Increasing Interplanetary CubeSat Mission Science Return with Model Based Transmission Reduc- tion,” The 1st Interplanetary CubeSat Workshop, Boston, 2012.
[9] M. Trifas and J. Straub, “A Comparison of Techniques for Super-Resolution Evaluation,” Proceedings of the IS&T/SPIE Electronic Imaging Conference, Burlingame, 22 January 2012. doi:10.1117/12.912172
[10] M. Trifas and J. Straub, “Super Resolution: A Database Driven Inference Approach,” Proceedings of the 15th World Multi-Conference on Systemics, Cybernetics and Informatics, Orlando, 19-22 July 2011.
[11] M. Kharrazi, H. Sencar and N. Memon, “Blind Source Camera Identification,” Proceedings of the 2005 Interna-tional Conference on Image Processing, Genoa, 11-14 September 2005, pp. 69-72.