Original Article
Association between MSMB rs10993994 polymorphism
and susceptibility to prostate cancer: a meta-analysis
and trial sequential analysis
Zhiqiang Qin1,2*, Xiao Li1,2*, Jingyuan Tang2*, Peng Han2, Zhen Xu2, Yajie Yu2, Jianzhong Zhang2, Feng
Wang3, Yun Zhao1, Bin Yu1
1Department of Urologic Surgery, The Affiliated Cancer Hospital of Jiangsu Province of Nanjing Medical Univer -sity, Nanjing, 210009, China; 2Department of Urology, The First Affiliated Hospital of Nanjing Medical University,
Nanjing, 210029, China; 3Department of Radiotherapy, The First Affiliated Hospital of Nanjing Medical University, Nanjing, 210029, China. *Equal contributors.
Received March 22, 2016; Accepted June 21, 2016; Epub August 15, 2016; Published August 30, 2016
Abstract: Background: Previous studies remained controversial results related to the relationship between microse-minoprotein beta gene (MSMB) rs10993994 polymorphism and prostate cancer risk. Therefore, this meta-anal-ysis was performed to summarize such association. Methods: We searched for relevant available literatures on rs10993994 and prostate cancer until March 1st, 2016 on the databases Pubmed, Embase and web of science. The
pooled odds ratios (ORs) with 95% confidence intervals (CIs) were used to assess the strength of the association. Subgroup analyses were conducted based on ethnicity and source of controls. Then, trial sequential analysis was performed to reduce the risk of type I error and evaluate whether the results were based on firm evidence. Results: Overall, our results indicated that significant increased risk of prostate cancer was associated with rs10993994 for dominant model OR=1.28 (95% CI: 1.21-1.36), recessive model OR=1.41 (95% CI: 1.25-1.58) and homozygote model OR=1.57 (95% CI: 1.45-1.70) and heterozygote model OR=1.19 (95% CI: 1.12-1.26). In the subgroup analy-sis by ethnicity, significant results were detected only in Caucasian populations (dominant model: OR=1.29, 95% CI: 1.22-1.37; recessive model: OR=1.46, 95% CI: 1.33-160; homozygote model: OR=1.62, 95% CI: 1.49-1.77; heterozygote model: OR=1.19, 95% CI: 1.12-1.27). Moreover, when stratified by source of controls, statistically sig-nificant increased risks were found among both population-based control group and hospital-based control group. In the present study, such association was confirmed by trial sequential analyses. Conclusions: This meta-analysis suggests the T allele of the MSMB rs10993994 polymorphism increases prostate cancer susceptibility, which holds potential as biomarkers for prostate cancer risk.
Keywords: MSMB polymorphism, rs10993994, prostate cancer, meta-analysis
Introduction
As one of the most common malignancies among men in the western countries, prostate cancer (PCa) is considered the second leading cause of cancer-related deaths in men [1, 2]. Although previous studies have reported a series of potential risk factors such as smok-ing, inflammation, diet, environment, age, and genetic factors that might increase PCa sus-ceptibility, the accurate etiology of PCa is still unclear [3-8]. A study revealed that malignant transformation of prostate cells was associat-ed with somatic genomic changes, including
deletions, amplifications, or point mutations [9, 10]. Genetic factors, particularly single-nucleo-tide genetic polymorphisms (SNPs), have been reported to play an important role in the devel-opment of PCa [11].
prostate gland [15]. More importantly, early studies suggested that the replacement of T allele by C allele might destroy a potential bind-ing site of cAMP response element bindbind-ing pro-tein (CREB), the T allele therefore had much lower promoter activity than the C allele [16, 17]. In addition, a growing number of studies discovered the association between rs10993- 994 causal variant and PCa susceptibility [17-24]. Hence, this SNP, rs10993994: C>T may play a vital role in prostate carcinogenesis. Subsequently, a number of studies were per-formed to elucidate the possible relationship between rs10993994 and the risk of PCa. However, the results remained unclear or even contradictory. Moreover, due to lack of meta-analysis on comprehensive understanding of the relationship between rs10993994 and the risk of PCa, this meta-analysis was for the first time conducted by including all eligible articles to clarify the real association and identify sta-tistical evidence. Furthermore, trial sequential analyses (TSA) were used to clarify whether the evidence for the results was sufficient.
Materials and methods
We conducted a comprehensive search based on PubMed, EMBASE and Web of Science to identify relevant studies, with the last search update on March 1st, 2016.
The following search items were utilized: “mic- roseminoprotein beta gene” or “rs10993994”, “MSMB”, “variants” or “polymorphism”, and “pr- ostate cancer”. Additional eligible studies were collected by a manual search from the refer-ences of original studies identified or recent review articles for the meta-analysis. Only the latest or more comprehensive publication was included, if the same data existed in more than one publication. Furthermore, ethical approval and informed consent were not required because our meta-analysis was based on data from previously published studies.
Eligible studies were selected if they met the following inclusion criteria: (1) An independent case-control design; (2) The association bet- ween rs10993994 polymorphism and PCa sus-ceptibility was evaluated; (3) The data on fre-quency of genotypes of the polymorphisms must be clearly presented. In addition, in case of the violation of the aforementioned
require-ments, this study was certainly excluded from this meta-analysis.
Data extraction
Based on the above the inclusion criteria, data were extracted from the identified studies by two investigators (Qin ZQ and Tang JY) indepen-dently, and any disagreement was resolved by a discussion with a third reviewer and a ulti-mate decision was based on the main point of view. All the extracted information were record-ed in a standardizrecord-ed form: first author’s last name, year of publication, ethnicity, source of controls, genotyping assay, number of cases and controls, genotype frequency of rs10993- 994 gene polymorphism between cases and controls respectively, and the results of the Hardy-Weinberg equilibrium (HWE) test.
Statistical analysis
College Station, TX) was utilized to deal with all above statistical analyses.
Trial sequential analysis
when a cumulative meta-analyses was updated with addition of new publishing trials, repeated significance testing and sparse data might result in type I and type II errors owing to an increased risk of random error [28-30]. Thus, TSA was introduced to control the risk of type I error by estimation of required information size and with an adjusted threshold for statistical significance [31, 32]. TSA was performed with a desire to maintain a 20% relative risk reduc-tion, an overall 5% risk a type I error of and 15% risk of the type II error (a statistical test power of 85%) [33]. When the blue line (the cumula-tive Z-curve) crosses the sloping red (the line trial sequential monitoring boundary), a suffi-cient level of evidence may have been reached
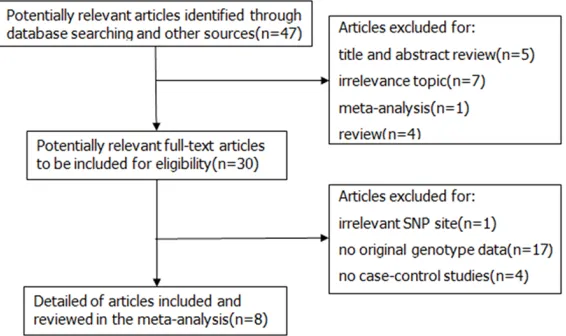
[image:3.612.91.526.84.221.2]Finally, A total of nine case-control studies fr- om eight articles including 11935 cases and 10219 controls were selected based on the inclusion and exclusion criteria and were com-bined in the current meta-analysis [17-24]. Additionally, due to different source of controls in an article by Chang et al. [17], we divided it into two research studies. The detailed charac-teristics and genotype distribution of the selected studies are listed in Table 1. The pro-cess of literature search and exclusion was shown in Figure 1. Among these previous stud-ies, there were three different ethnic groups, including 6 studies conducted in Caucasians population, 2 studies based on Asian popula-tion and a study from mixed populapopula-tion. Furthermore, in order to distinguish between different sources of control group, we consist-ed of 7 population-based studies and 2 hospi-tal-based studies.
Table 1. Characteristics of individual studies included in the meta-analysis
MSMB rs10993994 Case (n) Control (n)
Year Surname Ethnicity SOC Genotyping Case Control CC CT TT CC CT TT HWE 2016 Sjoblom Caucasian HB Sequenom 368 901 154 160 54 394 396 111 Y
2015 Mhatre Asian PB PCR 50 30 9 24 17 5 10 15 Y
2013 Stott-Miller Caucasian PB Taqman 1239 1232 377 621 241 465 599 168 Y 2013 FitzGerald Caucasian PB Taqman 1257 1253 382 633 242 472 608 173 Y 2012 Haiman Mixed PB AutoDELFIA 1221 1230 314 588 319 359 585 286 Y 2012 Ho Caucasian PB PCR 242 264 83 94 65 102 119 43 Y
2010 Xu Asian HB TaqMan 251 258 57 122 72 71 140 47 Y
2009 Chang-a Caucasian PB PCR 2863 1701 963 1354 546 627 810 264 Y 2009 Chang-b Caucasian HB PCR 4444 3350 1380 2129 935 1275 1584 491 Y
SOC: Source of controls; PB: Population-based controls; HB: Hospital-based controls.
Figure 1. Flow diagram of literature search and selection process.
and further studies are unnec-essary. If the blue line does not cross any of the boundar-ies and the vertical red line (the required information size) has not been reached, addi-tional clinical trials are need-ed to reach a sufficient con-clusion [34]. The trial seque- ntial analysis software (TSA, version 0.9; Copenhagen Trial Unit, Copenhagen, Denmark, 2011) was applied in this study.
Results
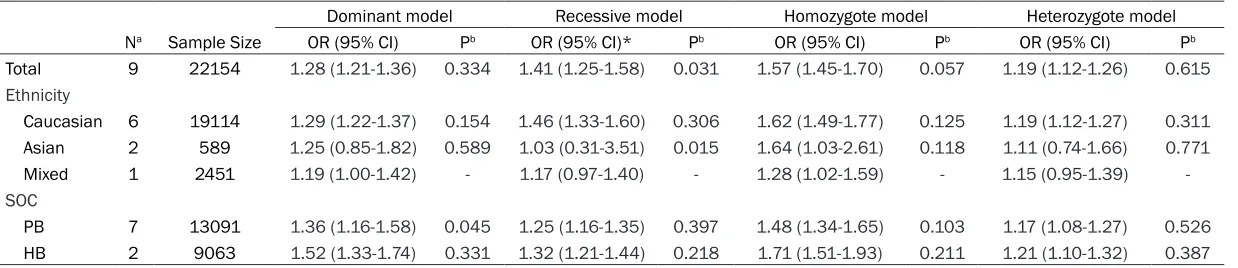
[image:3.612.94.377.256.424.2]Table 2. Meta-analysis results of association between rs10993994 polymorphism and prostate cancer risk
Dominant model Recessive model Homozygote model Heterozygote model
Na Sample Size OR (95% CI) Pb OR (95% CI)* Pb OR (95% CI) Pb OR (95% CI) Pb
Total 9 22154 1.28 (1.21-1.36) 0.334 1.41 (1.25-1.58) 0.031 1.57 (1.45-1.70) 0.057 1.19 (1.12-1.26) 0.615
Ethnicity
Caucasian 6 19114 1.29 (1.22-1.37) 0.154 1.46 (1.33-1.60) 0.306 1.62 (1.49-1.77) 0.125 1.19 (1.12-1.27) 0.311
Asian 2 589 1.25 (0.85-1.82) 0.589 1.03 (0.31-3.51) 0.015 1.64 (1.03-2.61) 0.118 1.11 (0.74-1.66) 0.771
Mixed 1 2451 1.19 (1.00-1.42) - 1.17 (0.97-1.40) - 1.28 (1.02-1.59) - 1.15 (0.95-1.39)
-SOC
PB 7 13091 1.36 (1.16-1.58) 0.045 1.25 (1.16-1.35) 0.397 1.48 (1.34-1.65) 0.103 1.17 (1.08-1.27) 0.526
HB 2 9063 1.52 (1.33-1.74) 0.331 1.32 (1.21-1.44) 0.218 1.71 (1.51-1.93) 0.211 1.21 (1.10-1.32) 0.387
Dominant model: CT/TT vs CC; recessive model: TT vs CT/CC; homozygote model: TT vs CC; heterozygote model: CT vs CC. aNumber of studies. bP value of Q test for
Quantitative synthesis results
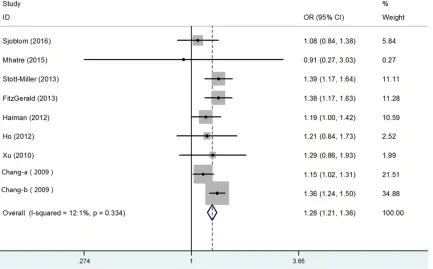
In this meta-analysis, we conducted analyses using fixed-effect models except in recessive model, when P value for heterogeneity test >0.05. Besides, the combined results indicat-ed that rs10993994 polymorphism was signifi-cantly associated with risk of PCa. Overall, the main results of this meta-analysis about the associations between rs10993994 polymor-phism and PCa were shown in Table 2. The pooled OR was 1.28 (95% CI: 1.21-1.36) for dominant model, 1.41 (95% CI: 1.25-1.58) for recessive model 1.57 (95% CI: 1.45-1.70) for homozygote model and 1.19 (95% CI: 1.12-1.26) for heterozygote model (Figure 2). In the subgroup analysis by ethnicity, the results were significant only in Caucasian populations (domi
-nant model: pooled OR=1.29, 95% CI: 1.22-1.37; recessive model: pooled OR=1.46, 95% CI: 1.33-1.60; homozygote model: OR=1.62, 95% CI: 1.49-1.77; heterozygote model: pooled OR=1.19, 95% CI: 1.12-1.27) (Figure 3A). Moreover, when the studies were stratified by source of controls, the positive result was detected in both population-based control gr-
oup (dominant model: pooled OR=1.25, 95% CI: 1.16-1.35; recessive model: pooled OR= 1.36, 95% CI: 1.16-1.58; homozygote model: pooled OR=1.48, 95% CI: 1.34-1.65;
heterozy-gote model: pooled OR=1.17, 95% CI: 1.08-1.27) and hospital-based controls (dominant model: pooled OR=1.32, 95% CI: 1.21-1.44;
recessive model: pooled OR=1.52, 95% CI: 1.33-1.74; homozygote model: pooled OR=1.71, 95% CI: 1.51-1.93; heterozygote model: pooled OR= 1.21, 95% CI: 1.10-1.32) (Figure 3B). In general, with the effect of rs10993994 gene polymorphism, the carriers of T allele held high-er PCa risk than carrihigh-ers of C allele, especially in Caucasian ethnicity.
Test of heterogeneity
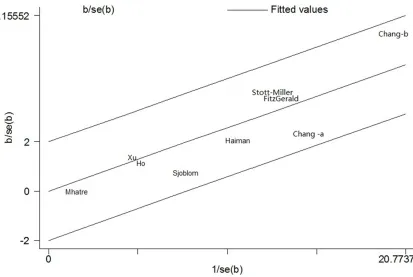
[image:5.612.94.527.77.346.2]Heterogeneity was observed in overall genetic models, but it was interesting that subgroup analyses could decrease the heterogeneity. Thus, neither ethnicity nor source of controls were performed to contribute to substantial heterogeneity. Figure 4 showedthe analysis of a Galbraith radial plot in dominant model, sug-gesting that there is no obvious heterogeneity between studies.
Sensitivity analysis
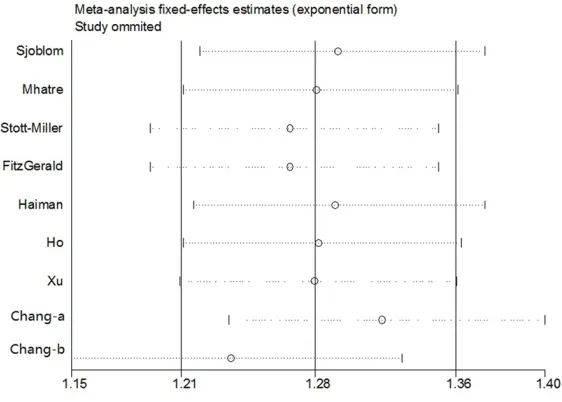
Sensitivity analysis was carried out by omitting one single study one by one to check their influ-ence of each individual study on the recalcu-lated ORs by repeating the meta-analysis. The sensitivity analysis on association between rs10993994 polymorphism with PCa for domi-nant model was listed in Figure 5, demonstrat-ing that the pooled ORs were not significantly influenced. Therefore, the sensitivity analysis suggested that our meta-analysis results were robust and stability.
Publication bias
The Begg’s funnel plot and Egger’s test were applied to assess the publication bias for all data. The shapes of the funnel plots seemed symmetrically distributed in the funnel plots of rs10993994 polymorphism, indicating little evidence of significant publication bias across studies, which was also confirmed by Egger’s test (dominant model: P=0.602) (Figure 6).
Trial sequential analysis results
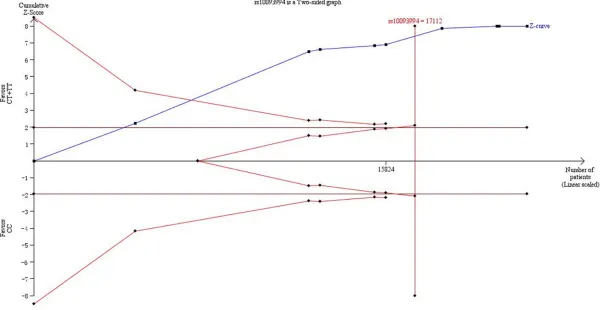
In our present study, Figure 7 showed that not only the cumulative Z-curve crosses the trial sequential monitoring boundary, but also the total number of cases and controls were more than the required information size, showing the results were firm evidence of effect.
Discussion
[image:7.612.102.515.114.391.2]The SNP rs10993994:C>T on chromosome 10q11.2, is located in a putative CREB-binding site of the promoter region of MSMB gene, which encodes MSP. Moreover, MSP, as a mem-ber in the immunoglobulin binding factor family, is synthesized by epithelial cells of the prostate gland before secretion into the seminal plasma [12, 13]. MSMB might act as a serum marker for early diagnosis of high-risk PCa. In addition, MSMB was considered as a tumor suppressor gene, which expression of MSMB progressively decreases during occurrence and development of PCa from early to late stages. Meanwhile,
Figure 3. Forest plots of subgroup analysis of the association between rs10993994 polymorphism and prostate cancer susceptibility in dominant model. A: Stratified by ethnicity; B: Stratified by source of controls.
over expression of MSMB has been described as a protective element, implying MSMB might induce PCa cell apoptosis and suppress PCa growth, invasion and metastasis [35-38]. Thus, these findings support further exploratory stud-ies that the risk T allele of rs10993994 might be predicted to result in the production of PCa with lower amounts of this putative tumor sup-pressor gene in individuals carrying this variant allele.
In summary, the outcomes of previous case-control studies depicting the association bet- ween rs10993994 polymorphism and PCa risk remained inconclusive and controversial. The
comprehensive understanding of the associa-tion between rs10993994 polymorphism and the risk of PCa through different subgroup anal-ysis [39]. All these factors contributed to the development of the current meta-analysis. As a consequence, we took advantage of meta-anal-ysis to illustrate this possible association. In the current meta-analysis, our results revealed the T allele of rs10993994 polymorphism in- creases PCa susceptibility, especially among Caucasian ethnicity.
These findings of subgroup analyses based on ethnicity and control source can be explained as follows. After stratified analysis was
[image:8.612.93.374.74.275.2]per-Figure 5. Sensitivity analysis under the dominant model.
Figure 6. Begg’s funnel plot of publication bias test in the dominant model.
causes of these conflicting among them might be the rel-atively small sample size of individual studies, the various ethnicities, the different me- thodologies, the limited sta-tistical power in the published studies and the possible sm- all effect of the rs10993994 polymorphism on the risk of PCa. However, since then, no meta-analyses explored the relationship between rs109- 93994 and PCa susceptibility. Recently, as the case-control studies published about such association has continued to increase, our meta-analysis were adopted for the first time to conduct a comprehensive assessment of the relation-ship between rs10993994 polymorphism and the risk of PCa. Last but not least, TSA was performed to effectively reduce the risk of type I error and assess whether the evi-dence of our results is reli-able. Therefore, it was signifi-cant to investigate the asso- ciation of rs10993994 poly-morphisms with PCa suscep- tibility.
[image:8.612.93.376.311.498.2]formed by ethnicity, and statistically significant-ly increased PCa risk was onsignificant-ly in Caucasian populations instead of Asian or Mixed popula-tions. Though the exact mechanism was un- clear, it was likely that different ethnic groups with various genetic backgrounds might have different gene polymorphisms risk of develop-ing PCa. In addition, we conducted stratified analysis by source of controls and the result was detected significant both in population-based and hospital-population-based populations. In this meta-analysis, the results were in concordance with these hypotheses of previous studies, which needed to further prove that rs10993994 played an important role in PCa susceptibility. TSA, as an useful tool, is similar to interim anal-yses in a single trial, where trial monitoring boundaries are drawn for each outcome wheth-er to continue additional trials to evaluate for evidence when a P value is sufficiently small to show the anticipated effect or for futility. In some previous studies, it is believed that the application of TSA is more reliable compared to traditional meta-analysis [40, 41]. when the cumulative Z-curve crosses by the monitoring boundaries, it shows firm evidence for such study. In consequence, we took advantage of TSA to control the risk of type I error and esti-mate whether further trials are necessary. In the current meta-analyses, the cumulative Z-curve crossed the monitoring boundaries and larger sample size were included than the required information size. Thus, it was strongly of the view that our results were based on firm evidence of effect.
Notably, this is the first meta-analysis to com-prehensively illustration the impact of rs1099- 3994 polymorphism in response to PCa risk. Nevertheless, several limitations should be taken into consideration and interpreted. Fir- stly, certain results, especially those in each stratified analyses, are still indefinitive and remain to be further validated due to relatively insufficient sample size, contributing to poten-tially limiting the statistical power to explore the real association. Secondly, the pathogenesis of PCa, as a multi-factorial disease, is closely related to environmental backgrounds as well as the interaction with various genetic factors instead of the influence of any single gene. Therefore, additional studies about exploring the risk effects of this polymorphism in
suscep-tibility to PCa needed to be further validated in subsequent studies. What’s more, in the pres-ent meta-analysis, we did not have enough data for all studies to adjust estimates by other covariates, such as age, gender, life-style and so on. Thereby, a more precise analysis would have been performed if more detailed individu-al data were available. Additionindividu-ally, the majority studies used were investigated in Caucasian population, suggesting analysis result might exist some merits. Hence, to guaranty reliability of our meta-analysis, more researches should focus on the influence of different factors in the future.
Conclusion
The results of the present meta-analysis indi-cated that the rs10993994 gene polymor-phism is significantly associated with suscepti-bility to PCa. Meanwhile, the variant C allele may be a strong risk factor of PCa, especially in Caucasian populations. More importantly, our findings need to be further validated whether rs10993994 polymorphism might be a poten-tial etiology and detecting marker for the risk of PCa in the future.
Disclosure of conflict of interest None.
Address correspondence to: Yun Zhao and Bin Yu, Department of Urologic Surgery, The Affiliated Ca- ncer Hospital of Jiangsu Province of Nanjing Medi- cal University, Nanjing 210009, China. Tel: +086- 15380882853; E-mail: [email protected] (YZ); Tel: +08613376094957; E-mail: [email protected] (BY)
References
[1] Siegel RL, Miller KD, Jemal A. Cancer statistics, 2016. CA Cancer J Clin 2016; 66: 7-30. [2] Dianat SS, Margreiter M, Eckersberger E,
Fin-kelstein J, Kuehas F, Herwig R, Ayati M, Lepor H, Djavan B. Gene polymorphisms and pros-tate cancer: the evidence. BJU Int 2009; 104: 1560-72.
[3] Bostwick DG, Burke HB, Djakiew D, Euling S, Ho SM, Landolph J, Morrison H, Sonawane B, Shifflett T, Waters DJ, Timms B. Human pros-tate cancer risk factors. Cancer 2004; 101: 2371-490.
[5] Stark T, Livas L, Kyprianou N. Inflammation in prostate cancer progression and therapeutic targeting. Transl Androl Urol 2015; 4: 455-63. [6] Labbe DP, Zadra G, Ebot EM, Mucci LA, Kantoff
PW, Loda M, Brown M. Role of diet in prostate cancer: the epigenetic link. Oncogene 2015; 34: 4683-91.
[7] Froehner M, Koch R, Hubler M, Wirth MP. Vali-dation of an Age-adjusted Prostate Cancer-Specific Comorbidity Index. Eur Urol 2016; 69: 764-6.
[8] Whitington T, Gao P, Song W, Ross-Adams H, Lamb AD, Yang Y, Svezia I, Klevebring D, Mills IG, Karlsson R, Halim S, Dunning MJ, Egevad L, Warren AY, Neal DE, Grönberg H, Lindberg J, Wei GH, Wiklund F. Gene regulatory mecha-nisms underpinning prostate cancer suscepti-bility. Nat Genet 2016; 48: 387-97.
[9] Bova GS, Isaacs WB. Review of allelic loss and gain in prostate cancer. World J Urol 1996; 14: 338-46.
[10] Rybicki BA, Conti DV, Moreira A, Cicek M, Casey G, Witte JS. DNA repair gene XRCC1 and XPD polymorphisms and risk of prostate cancer. Cancer Epidemiol Biomarkers Prev 2004; 13: 23-9.
[11] Dhillon VS, Yeoh E, Fenech M. DNA repair gene polymorphisms and prostate cancer risk in South Australia--results of a pilot study. Urol Oncol 2011; 29: 641-6.
[12] Thomas G, Jacobs KB, Yeager M, Kraft P, Wa-cholder S, Orr N, Yu K, Chatterjee N, Welch R, Hutchinson A, Crenshaw A, Cancel-Tassin G, Staats BJ, Wang Z, Gonzalez-Bosquet J, Fang J, Deng X, Berndt SI, Calle EE, Feigelson HS, Thun MJ, Rodriguez C, Albanes D, Virtamo J, Weinstein S, Schumacher FR, Giovannucci E, Willett WC, Cussenot O, Valeri A, Andriole GL, Crawford ED, Tucker M, Gerhard DS, Fraumeni JF Jr, Hoover R, Hayes RB, Hunter DJ, Chanock SJ. Multiple loci identified in a genome-wide association study of prostate cancer. Nat Gen-et 2008; 40: 310-5.
[13] Eeles RA, Kote-Jarai Z, Giles GG, Olama AA, Guy M, Jugurnauth SK, Mulholland S, Leon-gamornlert DA, Edwards SM, Morrison J, Field HI, Southey MC, Severi G, Donovan JL, Hamdy FC, Dearnaley DP, Muir KR, Smith C, Bagnato M, Ardern-Jones AT, Hall AL, O’Brien LT, Gehr-Swain BN, Wilkinson RA, Cox A, Lewis S, Brown PM, Jhavar SG, Tymrakiewicz M, Lophatananon A, Bryant SL; UK Genetic Prostate Cancer Study Collaborators; British Association of Uro-logical Surgeons’ Section of Oncology; UK Pro-tecT Study Collaborators, Horwich A, Huddart RA, Khoo VS, Parker CC, Woodhouse CJ, Thompson A, Christmas T, Ogden C, Fisher C, Jamieson C, Cooper CS, English DR, Hopper JL, Neal DE, Easton DF. Multiple newly identified
loci associated with prostate cancer suscepti-bility. Nat Genet 2008; 40: 316-21.
[14] Nam RK, Reeves JR, Toi A, Dulude H, Trachten-berg J, Emami M, Daigneault L, Panchal C, Sugar L, Jewett MA, Narod SA. A novel serum marker, total prostate secretory protein of 94 amino acids, improves prostate cancer detec-tion and helps identify high grade cancers at diagnosis. J Urol 2006; 175: 1291-7.
[15] Waters KM, Stram DO, Le Marchand L, Klein RJ, Valtonen-André C, Peltola MT, Kolonel LN, Henderson BE, Lilja H, Haiman CA. A common prostate cancer risk variant 5’ of microsemino-protein-beta (MSMB) is a strong predictor of circulating beta-microseminoprotein (MSP) lev-els in multiple populations. Cancer Epidemiol Biomarkers Prev 2010; 19: 2639-46.
[16] Lou H, Yeager M, Li H, Bosquet JG, Hayes RB, Orr N, Yu K, Hutchinson A, Jacobs KB, Kraft P, Wacholder S, Chatterjee N, Feigelson HS, Thun MJ, Diver WR, Albanes D, Virtamo J, Weinstein S, Ma J, Gaziano JM, Stampfer M, Schumacher FR, Giovannucci E, Cancel-Tassin G, Cussenot O, Valeri A, Andriole GL, Crawford ED, Anderson SK, Tucker M, Hoover RN, Fraumeni JF Jr, Thomas G, Hunter DJ, Dean M, Chanock SJ. Fine mapping and functional analysis of a common variant in MSMB on chromosome 10q11.2 associated with prostate cancer sus-ceptibility. Proc Natl Acad Sci U S A 2009; 106: 7933-8.
[17] Chang BL, Cramer SD, Wiklund F, Isaacs SD, Stevens VL, Sun J, Smith S, Pruett K, Romero LM, Wiley KE, Kim ST, Zhu Y, Zhang Z, Hsu FC, Turner AR, Adolfsson J, Liu W, Kim JW, Duggan D, Carpten J, Zheng SL, Rodriguez C, Isaacs WB, Grönberg H, Xu J. Fine mapping associa-tion study and funcassocia-tional analysis implicate a SNP in MSMB at 10q11 as a causal variant for prostate cancer risk. Hum Mol Genet 2009; 18: 1368-75.
[18] Xu B, Wang J, Tong N, Mi Y, Min Z, Tao J, Li P, Cheng G, Li J, Wang M, Tang J, Song N, Zhang Z, Zhang W, Wu H, Hua L, Feng N. A functional polymorphism in MSMB gene promoter is as-sociated with prostate cancer risk and serum MSMB expression. Prostate 2010; 70: 1146-52.
[19] Ho CK, Halley L, Wei J, Habib FK. Analysis of prostate cancer association with four single-nucleotide polymorphisms from genome-wide studies and serum phyto-estrogen concentra-tions. Prostate Cancer Prostatic Dis 2012; 15: 365-8.
can-cer in multiple populations. J Natl Cancan-cer Inst 2013; 105: 237-43.
[21] FitzGerald LM, Zhang X, Kolb S, Kwon EM, Liew YC, Hurtado-Coll A, Knudsen BS, Ostrander EA, Stanford JL. Investigation of the relationship between prostate cancer and MSMB and NCOA4 genetic variants and protein expres-sion. Hum Mutat 2013; 34: 149-56.
[22] Stott-Miller M, Wright JL, Stanford JL. MSMB gene variant alters the association between prostate cancer and number of sexual part-ners. Prostate 2013; 73: 1803-9.
[23] Mhatre DR, Mahale SD, Khatkhatay MI, Achrekar SK, Desai SS, Jagtap DD, Dhabalia JV, Tongaonkar HB, Dandekar SP, Varadkar AM. The rs10993994 in the proximal MSMB promoter region is a functional polymorphism in Asian Indian subjects. Springerplus 2015; 4: 380.
[24] Sjoblom L, Saramaki O, Annala M, Leinonen K, Nättinen J, Tolonen T, Wahlfors T, Nykter M, Bova GS, Schleutker J, Tammela TL, Lilja H, Vi-sakorpi T. Microseminoprotein-Beta Expres-sion in Different Stages of Prostate Cancer. PLoS One 2016; 11: e150241.
[25] Guo SW, Thompson EA. Performing the exact test of Hardy-Weinberg proportion for multiple alleles. Biometrics 1992; 48: 361-72.
[26] DerSimonian R, Kacker R. Random-effects model for meta-analysis of clinical trials: an up-date. Contemp Clin Trials 2007; 28: 105-14. [27] Hayashino Y, Noguchi Y, Fukui T. Systematic
evaluation and comparison of statistical tests for publication bias. J Epidemiol 2005; 15: 235-43.
[28] Turner RM, Bird SM, Higgins JP. The impact of study size on meta-analyses: examination of underpowered studies in Cochrane reviews. PLoS One 2013; 8: e59202.
[29] Brok J, Thorlund K, Wetterslev J, Gluud C. Ap-parently conclusive meta-analyses may be in-conclusive--Trial sequential analysis adjust-ment of random error risk due to repetitive testing of accumulating data in apparently conclusive neonatal meta-analyses. Int J Epi-demiol 2009; 38: 287-98.
[30] Wetterslev J, Thorlund K, Brok J, Gluud C. Trial sequential analysis may establish when firm evidence is reached in cumulative meta-analy-sis. J Clin Epidemiol 2008; 61: 64-75. [31] Higgins JP, Whitehead A, Simmonds M.
Se-quential methods for random-effects meta-analysis. Stat Med 2011; 30: 903-21.
[32] Thorlund K, Imberger G, Walsh M, Chu R, Gluud C, Wetterslev J, Guyatt G, Devereaux PJ, Thabane L. The number of patients and events required to limit the risk of overestimation of intervention effects in meta-analysis--a simula-tion study. PLoS One 2011; 6: e25491. [33] Wetterslev J, Thorlund K, Brok J, Gluud C.
Esti-mating required information size by quantify-ing diversity in random-effects model meta-analyses. BMC Med Res Methodol 2009; 9: 86.
[34] Holst LB, Petersen MW, Haase N, Perner A, Wetterslev J. Restrictive versus liberal transfu-sion strategy for red blood cell transfutransfu-sion: sys-tematic review of randomised trials with meta-analysis and trial sequential meta-analysis. BMJ 2015; 350: h1354.
[35] Garde S, Sheth A, Porter AT, Pienta KJ. Effect of prostatic inhibin peptide (PIP) on prostate can-cer cell growth in vitro and in vivo. Prostate 1993; 22: 225-33.
[36] Garde SV, Basrur VS, Li L, Finkelman MA, Kris-han A, Wellham L, Ben-Josef E, Haddad M, Tay-lor JD, Porter AT, Tang DG. Prostate secretory protein (PSP94) suppresses the growth of an-drogen-independent prostate cancer cell line (PC3) and xenografts by inducing apoptosis. Prostate 1999; 38: 118-25.
[37] Shukeir N, Arakelian A, Kadhim S, Garde S, Rabbani SA. Prostate secretory protein PSP-94 decreases tumor growth and hypercalcemia of malignancy in a syngenic in vivo model of pros-tate cancer. Cancer Res 2003; 63: 2072-8. [38] Shukeir N, Garde S, Wu JJ, Panchal C, Rabbani
SA. Prostate secretory protein of 94 amino ac-ids (PSP-94) and its peptide (PCK3145) as po-tential therapeutic modalities for prostate can-cer. Anticancer Drugs 2005; 16: 1045-51. [39] Munafo MR, Flint J. Meta-analysis of genetic
association studies. Trends Genet 2004; 20: 439-44.
[40] Zhang S, Tang Q, Wu W, Yuan B, Lu C, Xia Y, Ding H, Hu L, Chen D, Sha J, Wang X. Associa-tion between DAZL polymorphisms and sus-ceptibility to male infertility: systematic review with meta-analysis and trial sequential analy-sis. Sci Rep 2014; 4: 4642.