RTM-DCU: Predicting Semantic Similarity with Referential Translation
Machines
Ergun Bic¸ici
ADAPT CNGL Centre for Global Intelligent Content School of Computing
Dublin City University, Dublin, Ireland.
Abstract
We use referential translation machines (RTMs) for predicting the semantic similarity of text. RTMs are a computational model effectively judging monolingual and bilingual similarity while identifying translation acts between any two data sets with respect to interpretants. RTMs pioneer a language independent approach to all similarity tasks and remove the need to access any task or domain specific information or resource. RTMs become the 2nd system out of 13 systems participating in Paraphrase and Semantic Similarity in Twitter, 6th out of 16 submissions in Semantic Textual Similarity Spanish, and 50th out of 73 submissions in Semantic Textual Similarity English.
1 Referential Translation Machine (RTM) We present positive results from a fully automated judge for semantic similarity based on Referential Translation Machines (Bic¸ici and Way, 2014b) in two semantic similarity tasks at SemEval-2015, Se-mantic Evaluation Exercises - International Work-shop on Semantic Evaluation (Nakov et al., 2015). Referential translation machine (RTM) is a compu-tational model for identifying the acts of translation for translating between any given two data sets with respect to a reference corpus selected in the same domain. An RTM model is based on the selection of interpretants, training data close to both the train-ing set and the test set, which allow shared seman-tics by providing context for similarity judgments. Each RTM model is a data translation and transla-tion predictransla-tion model between the instances in the
training set and the test set and translation acts are indicators of the data transformation and translation. RTMs present an accurate and language independent solution for making semantic similarity judgments.
RTMs pioneer a computational model for qual-ity and semantic similarqual-ity judgments in monolin-gual and bilinmonolin-gual settings using retrieval of relevant training data (Bic¸ici and Yuret, 2015) as interpre-tants for reaching shared semantics. RTMs achieve (i) top performance when predicting the quality of translations (Bic¸ici, 2013; Bic¸ici and Way, 2014a); (ii) top performance when predicting monolingual cross-level semantic similarity; (iii) second perfor-mance when predicting paraphrase and semantic similarity in Twitter (iv) good performance when judging the semantic similarity of sentences; (iv) good performance when evaluating the semantic re-latedness of sentences and their entailment (Bic¸ici and Way, 2014b).
RTMs use Machine Translation Performance Pre-diction (MTPP) System (Bic¸ici et al., 2013; Bic¸ici and Way, 2014b), which is a state-of-the-art (SoA) performance predictor of translation even without using the translation. MTPP system measures the coverage of individual test sentence features found in the training set and derives indicators of the close-ness of test sentences to the available training data, the difficulty of translating the sentence, and the presence of acts of translation for data transforma-tion. MTPP features for translation acts are provided in (Bic¸ici and Way, 2014b). RTMs become the 2nd system out of 13 systems participating in Paraphrase and Semantic Similarity in Twitter (Task 1) (Xu et al., 2015) and achieve good results in Semantic
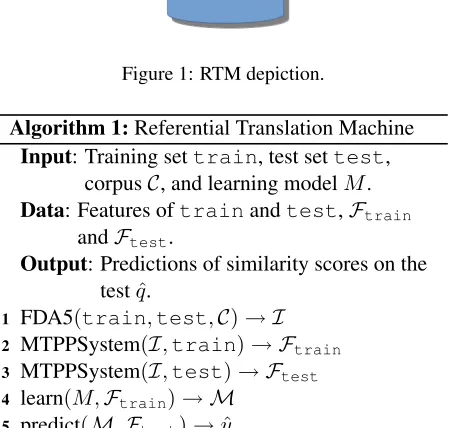
Figure 1: RTM depiction.
Algorithm 1:Referential Translation Machine
Input: Training settrain, test settest, corpusC, and learning modelM.
Data: Features oftrainandtest,Ftrain andFtest.
Output: Predictions of similarity scores on the testqˆ.
1 FDA5(train,test,C)→ I 2 MTPPSystem(I,train)→ Ftrain 3 MTPPSystem(I,test)→ Ftest 4 learn(M,Ftrain)→ M
5 predict(M,Ftest)→yˆ
tual Similarity (Task 2) (Agirre et al., 2015) becom-ing 6th out of 16 submissions in Spanish.
We use the Parallel FDA5 instance selection model for selecting the interpretants (Bic¸ici et al., 2014; Bic¸ici and Yuret, 2015), which allows efficient parameterization, optimization, and implementation of Feature Decay Algorithms (FDA), and build an MTPP model. We view that acts of translation are ubiquitously used during communication:
Every act of communication is an act of translation(Bliss, 2012).
Translation need not be between different languages and paraphrasing or communication also contain acts of translation. When creating sentences, we use our background knowledge and translate informa-tion content according to the current context.
Figure 1 depicts RTM and Algorithm 1 describes
Task Setting Train LM
[image:2.612.77.298.65.241.2]Task 1, ParSS English 313 7813 Task 2, STS English 441 6441 Task 2, STS English headlines 531 8031 Task 2, STS English images 411 6411 Task 2, STS Spanish 409 6409 Table 1: Number of sentences in I (in thousands) se-lected for each task.
the RTM algorithm. Our encouraging results in the semantic similarity tasks increase our understanding of the acts of translation we ubiquitously use when communicating and how they can be used to pre-dict semantic similarity. RTMs are powerful enough to be applicable in different domains and tasks with good performance. We describe the tasks we partic-ipated as follows:
ParSS Paraphrase and Semantic Similarity in Twitter (ParSS) (Xu et al., 2015):
Given two sentences S1 and S2 in the
same language, produce a similarity score indicating whether they express a similar meaning: a discrete real number in[0,1]. We model as sentence MTPP betweenS1toS2.
STS Semantic Textual Similarity (STS) (Agirre et al., 2015):
Given two sentencesS1andS2in the same
language, quantify the degree of similar-ity: a real number in[0,5].
STS is in English and Spanish (a real number in [0,4]). We model as sentence MTPP ofS1andS2.
2 SemEval-15 Results
We develop individual RTM models for each task and subtask that we participate at SemEval-2015 with the RTM-DCU team name. Interpretants are selected from the LM corpora distributed by the translation task of WMT14 (Bojar et al., 2014) and LDC for English (Parker et al., 2011) and Span-ish ( ˆAngelo Mendonc¸a et al., 2011)1. We use the
Stanford POS tagger (Toutanova et al., 2003) to ob-tain the lemmatized corpora for the ParSS task. The number of instances we select for the interpretants
[image:2.612.75.300.223.437.2]RTM-DCU results
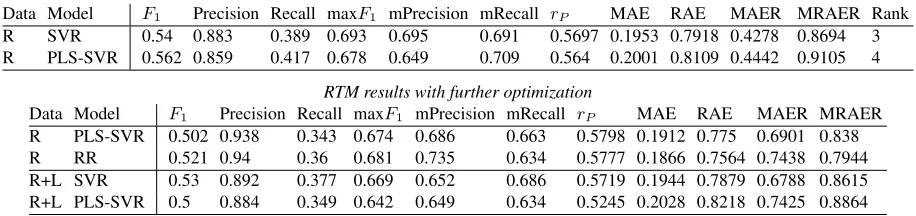
Data Model F1 Precision Recall maxF1 mPrecision mRecall rP MAE RAE MAER MRAER Rank
R SVR 0.54 0.883 0.389 0.693 0.695 0.691 0.5697 0.1953 0.7918 0.4278 0.8694 3 R PLS-SVR 0.562 0.859 0.417 0.678 0.649 0.709 0.564 0.2001 0.8109 0.4442 0.9105 4
RTM results with further optimization
Data Model F1 Precision Recall maxF1 mPrecision mRecall rP MAE RAE MAER MRAER
[image:3.612.77.535.70.178.2]R PLS-SVR 0.502 0.938 0.343 0.674 0.686 0.663 0.5798 0.1912 0.775 0.6901 0.838 R RR 0.521 0.94 0.36 0.681 0.735 0.634 0.5777 0.1866 0.7564 0.7438 0.7944 R+L SVR 0.53 0.892 0.377 0.669 0.652 0.686 0.5719 0.1944 0.7879 0.6788 0.8615 R+L PLS-SVR 0.5 0.884 0.349 0.642 0.649 0.634 0.5245 0.2028 0.8218 0.7425 0.8864
Table 2: ParSS test results.
in each task is given in Table 1.
We use ridge regression (RR), support vector re-gression (SVR), and extremely randomized trees (TREE) (Geurts et al., 2006) as the learning mod-els. These models learn a regression function using the features to estimate a numerical target value. We also use them after a dimensionality reduction and mapping step with partial least squares (PLS) (Spe-cia et al., 2009). We optimize the learning parame-ters, the number of dimensions used for PLS, and the parameters for parallel FDA5. More details about the optimization processes are in (Bic¸ici and Way, 2014b; Bic¸ici et al., 2014). We optimize the learning parameters by selectingεclose to the standard devi-ation of the noise in the training set (Bic¸ici, 2013) since the optimal value forεis shown to have lin-ear dependence to the noise level for different noise models (Smola et al., 1998). At testing time, the predictions are bounded to obtain scores in the cor-responding ranges.
We use Pearson’s correlation (rP), mean absolute
error (MAE), and relative absolute error (RAE) for evaluation:
MAE(ˆy,y) =
n
X
i=1
|yˆi−yi|
n RAE(ˆy,y) = n
X
i=1
|yˆi−yi| n
X
i=1
|y¯−yi|
(1)
We define MAER and MRAER for easier replica-tion and comparability with relative errors for each
instance:
MAER(ˆy,y) =
n X
i=1
|yˆi−yi| b|yi|c
n
MRAER(ˆy,y) =
n X
i=1
|yˆi−yi| b|y¯−yi|c
n
(2)
MAER is the mean absolute error relative to the magnitude of the target and MRAER is the mean absolute error relative to the absolute error of a pre-dictor always predicting the target mean assuming that target mean is known. MAER and MRAER are capped from below2 with=MAE(ˆy,y)/2, which
is the measurement error and it is estimated as half of the mean absolute error or deviation of the pre-dictions from target mean. represents half of the score step with which a decision about a change in measurement’s value can be made. is simi-lar to half of the standard deviation,σ, of the data but over absolute differences. For discrete target scores, = step size2 . A method for learning deci-sion thresholds for mimicking the human decideci-sion process when determining whether two translations are equivalent is described in (Bic¸ici, 2013).
MAER and MRAER are able to capture averaged fluctuations at the instance level and they may eval-uate the performance of a predictor at performance prediction tasks at the instance level (e.g. perfor-mance of the similarity of sentences, perforperfor-mance of translation of different translation instances) bet-ter. RAE compares sums of prediction errors and MRAER averages instance prediction error compar-isons.
2We useb.c
RTM-DCUrP results
Model answers-forums answers-students belief headlines images WeightedrP Rank
PLS-TREE 0.5484 0.5549 0.6223 0.7281 0.7189 0.6468 50
RTM top resultrP selected according to WeightedrP among top 3 results with further optimization
Model answers-forums answers-students belief headlines images WeightedrP
TREE 0.5517 0.6729 0.6750 0.7812 0.7830 0.7126
Rank 48 38 39 29 49 38
Table 4: STS English testrPresults for each domain.
Data Model F1 rP MAE RAE MAER MRAER
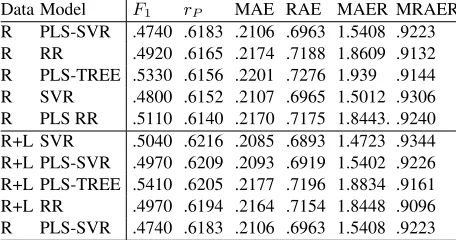
R PLS-SVR .4740 .6183 .2106 .6963 1.5408 .9223 R RR .4920 .6165 .2174 .7188 1.8609 .9132 R PLS-TREE .5330 .6156 .2201 .7276 1.939 .9144 R SVR .4800 .6152 .2107 .6965 1.5012 .9306 R PLS RR .5110 .6140 .2170 .7175 1.8443. .9240 R+L SVR .5040 .6216 .2085 .6893 1.4723 .9344 R+L PLS-SVR .4970 .6209 .2093 .6919 1.5402 .9226 R+L PLS-TREE .5410 .6205 .2177 .7196 1.8834 .9161 R+L RR .4970 .6194 .2164 .7154 1.8448 .9096 R PLS-SVR .4740 .6183 .2106 .6963 1.5408 .9223
Table 3: ParSS training results of top 5 RTM systems with further optimization.
2.1 Task 1: Paraphrase and Semantic Similarity in Twitter (ParSS)
ParSS contains sentences provided by Twitter3(Xu
et al., 2015). Official evaluation metric is Pearson’s correlation score, which we use to select the top systems on the training set. RTM-DCU results on the ParSS test set are given in Table 2. The set-ting R using SVR becomes 2nd out of 13 systems and 3rd out of 25 submissions. Looking at MAE and MAER allows us to obtain explanations to train and test performance differences for example with-out knowing their target distribution. Even though MAE of PLS-SVR is about%5smaller on the ParSS test set, MAER is%55smaller due to test set con-taining fewer zero entries (%16vs. %39on the train set). Lower test MAE than training MAE may be attributed to RTMs.
We obtained results with lemmatized datasets and further optimized the learning model parameters af-ter the challenge. We present the performance of the top 5 individual RTM models on the training set in Table 3. R uses the regular truecase (Koehn et al.,
3www.twitter.com
RTM-DCUrP results
Model Wikipedia News WeightedrP Rank
TREE 0.5823 0.5251 0.5443 6
RTM top resultrP selected according to Weighted
rP among top 3 results with further optimization
Model Wikipedia News WeightedrP Rank
TREE 0.6622 0.5833 0.6096 5
[image:4.612.74.302.208.328.2]Rank 4 5
Table 5: STS Spanish test results.
2007; Koehn, 2010) corpora and L uses the lemma-tized truecased corpora. R+L correspond to using the features from both R and L, which doubles the number of features.
2.2 Task 2: Semantic Textual Similarity (STS)
STS contains sentence pairs from different do-mains: answers-forums, answers-students, belief, headlines, and images for English and wikipedia and newswire for Spanish. Official evaluation met-ric in STS is the Pearson’s correlation score. We build separate RTM models for headlines and im-ages domains for STS English. Domain specific RTM models obtain improved performance in those domains (Bic¸ici and Way, 2014b). STS English test set contains 2000, 1500, 2000, 1500, and 1500 sen-tences respectively from the specified domains how-ever for evaluation, STS use a subset of the test set, 375, 750, 375, 750, and 750 instances respectively from the corresponding domains. This may lower the performance of RTMs by causing FDA5 to se-lect more domain specific data and less task specific since RTMs use the test set to select interpretants and build a task specific RTM prediction model.
along with their ranks out of 73 and 16 submissions respectively for English STS and Spanish STS.
RTM top test results selected according to WeightedrP among top 3 results on STS for each
subtask as well as top RTM-DCU results in STS 2014 (Bic¸ici and Way, 2014b) are presented in Ta-ble 6, where we have used the top results from do-main specific RTM models for headlines and images domains in the overall model results. Top 3 individ-ual RTM model performance on the training set with further optimized learning model parameters after the challenge are presented in Table 7. BetterrP,
RAE, and MRAER on the test set than on the train-ing set in STS 2015 English may be attributed to RTMs.
2.3 RTMs Across Tasks and Years
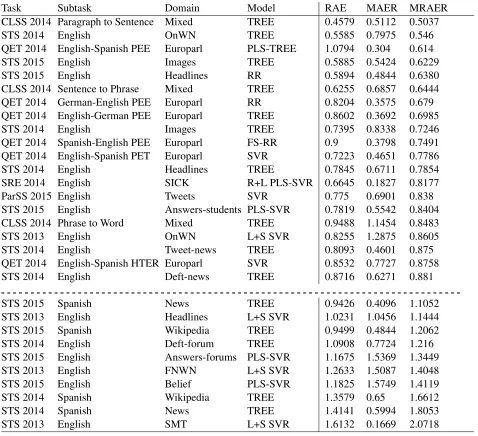
We compare the difficulty of tasks according to MRAER where the correlation of RAE and MRAER is 0.89. In Table 8, we list the RAE, MAER, and MRAER obtained for different tasks and sub-tasks, also listing RTM results from SemEval-2013 (Bic¸ici and van Genabith, SemEval-2013), from SemEval-2014 (Bic¸ici and Way, 2014b), and and from quality estimation task (QET) (Bic¸ici and Way, 2014a) of machine translation (Bojar et al., 2014). RTMs at SemEval-2013 contain results from STS. RTMs at SemEval-2014 contain results from STS, semantic relatedness and entailment (SRE) (Marelli et al., 2014), and cross-level semantic similarity (CLSS) tasks (Jurgens et al., 2014). RTMs at WMT2014 QET contain tasks involving the predic-tion of an integer in[1,3]representing post-editing effort (PEE), a real number in [0,1] represent-ing human-targeted translation edit rate (HTER), or an integer representing post-editing time (PET) of translations.
The best results are obtained for the CLSS para-graph to sentence subtask, which may be due to the larger contextual information that paragraphs can provide for the RTM models. For the ParSS task, we can only reduce the error with respect to know-ing and predictknow-ing the mean by about22.5%. Predic-tion of bilingual similarity as in quality estimaPredic-tion of translation can be expected to be harder and RTMs achieve SoA performance in this task as well (Bic¸ici and Way, 2014a). Table 8 can be used to evaluate the difficulty of various tasks and domains based on
our SoA predictor RTM. MRAER considers both the predictor’s error and the target scores’ fluctuations at the instance level. We separated the results hav-ing MRAER greater than1as in these tasks and sub-tasks RTM does not perform significantly better than mean predictor and fluctuations render these as tasks that may require more work.
3 Conclusion
Referential translation machines pioneer a clean and intuitive computational model for automatically measuring semantic similarity by measuring the acts of translation involved and achieve to become the 2nd system out of 13 systems participating in Para-phrase and Semantic Similarity in Twitter, 6th out of 16 submissions in Semantic Textual Similarity Spanish, and 50th out of 73 submissions in Semantic Textual Similarity English. RTMs make quality and semantic similarity judgments possible based on the retrieval of relevant training data as interpretants for reaching shared semantics. We define MAER, mean absolute error relative to the magnitude of the target, and MRAER, mean absolute error relative to the ab-solute error of a predictor always predicting the tar-get mean assuming that tartar-get mean is known. RTM test performance on various tasks sorted according to MRAER can identify which tasks and subtasks may require more work.
Acknowledgments
This work is supported in part by SFI (13/TIDA/I2740) for the project “Monolingual and Bilingual Text Quality Judgments with Translation Performance Prediction” (www.computing.dcu. ie/˜ebicici/Projects/TIDA_RTM.html) and in part by SFI (12/CE/I2267) as part of the ADAPT CNGL Centre for Global Intelligent Content (www.adaptcentre.ie) at Dublin City University. We also thank the SFI/HEA Irish Centre for High-End Computing (ICHEC) for the provision of computational facilities and support.
References
Domain Model rP MAE RAE MAER MRAER
STS
2015
English
answers-forums PLS-SVR 0.6215 1.2239 1.1675 1.5369 1.3449 answers-students PLS-SVR 0.6125 0.9635 0.7819 0.5542 0.8404 belief PLS-SVR 0.5879 1.3625 1.1825 1.5749 1.4119 headlines RR 0.7812 0.8318 0.5894 0.4844 0.6380 images TREE 0.7830 0.8502 0.5885 0.5424 0.6229 ALL PLS-SVR 0.6739 0.9847 0.7224 0.7379 0.7883
Spanish NewsWikipedia TREETREE 0.5303 0.6315 0.9426 0.4096 1.10520.5867 0.6448 0.9499 0.4844 1.2062 ALL TREE 0.5618 0.6360 0.9459 0.4348 1.1344
STS
2014
English
deft-forum TREE 0.4341 1.1609 1.0908 0.7724 1.216 deft-news TREE 0.6974 0.9032 0.8716 0.6271 0.881 headlines TREE 0.6199 0.9254 0.7845 0.6711 0.7854 images TREE 0.6995 0.9499 0.7395 0.8338 0.7246 OnWN TREE 0.8058 1.0028 0.5585 0.7975 0.546 tweet-news TREE 0.6882 0.831 0.8093 0.4601 0.875 ALL TREE 0.6473 0.9534 0.7449 0.7274 0.7566
Spanish NewsWikipedia TREETREE 0.70.4216 1.2981.351 1.4141 0.5994 1.80531.3579 0.65 1.6612
ALL TREE 0.62 1.3296 1.3823 0.6191 1.7719
STS
2013 English
headlines
L+S SVR
0.6552 1.2763 1.0231 1.0456 1.1444
OnWN 0.6943 1.3545 0.8255 1.2875 0.8605
SMT 0.3005 0.6886 1.6132 0.1669 2.0718
FNWN 0.2016 1.0604 1.2633 1.5087 1.4048
[image:6.612.98.522.58.399.2]ALL L+S SVR 0.5844 1.0818 0.7791 0.8494 0.77
Table 6: RTM top test results selected according to WeightedrPamong top 3 results on STS as well as top RTM-DCU
results in STS 2013 and STS 2014 (Bic¸ici and Way, 2014b). ALL presents results over all of the test set.
Lang Model rP MAE RAE MAER MRAER
English
PLS-SVR 0.7477 0.7679 0.6050 0.4444 0.6947 SVR 0.7452 0.7688 0.6058 0.4504 0.686 TREE 0.7265 0.8093 0.6377 0.504 0.6812
headlines
RR 0.7453 0.7559 0.6215 0.4389 0.6835 PLS-SVR 0.7411 0.7619 0.6265 0.4298 0.7087 TREE 0.7386 0.7710 0.6340 0.4726 0.6686
images
TREE 0.7600 0.8020 0.6248 0.5308 0.7013 PLS-SVR 0.7574 0.7839 0.6106 0.4898 0.724 RR 0.7564 0.7945 0.6189 0.5025 0.7161
Spanish
TREE 0.8390 0.5154 0.5115 0.4145 0.5931 RR 0.8260 0.5473 0.5431 0.4571 0.6208 PLS-SVR 0.8218 0.5363 0.5322 0.4171 0.635
Table 7: RTM training results of top 3 systems on STS English, English images, English headlines, and Spanish tasks.
2015. SemEval-2015 Task 2: Semantic textual sim-ilarity. In Proc. of the 9th International Workshop on Semantic Evaluation (SemEval 2015), Denver,
Col-orado, USA, June.
[image:6.612.156.458.444.622.2]edi-tion, Linguistic Data Consortium.
Ergun Bic¸ici and Josef van Genabith. 2013. CNGL-CORE: Referential translation machines for measuring semantic similarity. In*SEM 2013: The Second Joint Conference on Lexical and Computational Semantics, pages 234–240, Atlanta, Georgia, USA, 13-14 June. Ergun Bic¸ici and Andy Way. 2014a. Referential
trans-lation machines for predicting transtrans-lation quality. In Proc. of the Ninth Workshop on Statistical Machine Translation, pages 313–321, Baltimore, Maryland, USA, June.
Ergun Bic¸ici and Andy Way. 2014b. RTM-DCU: Ref-erential translation machines for semantic similarity. InProceedings of the 8th International Workshop on Semantic Evaluation (SemEval-2014), pages 487–496, Dublin, Ireland, 23-24 August.
Ergun Bic¸ici and Deniz Yuret. 2015. Optimizing in-stance selection for statistical machine translation with feature decay algorithms. IEEE/ACM Transactions On Audio, Speech, and Language Processing (TASLP), 23:339–350.
Ergun Bic¸ici, Declan Groves, and Josef van Genabith. 2013. Predicting sentence translation quality using ex-trinsic and language independent features. Machine Translation, 27:171–192, December.
Ergun Bic¸ici, Qun Liu, and Andy Way. 2014. Parallel FDA5 for fast deployment of accurate statistical ma-chine translation systems. InProc. of the Ninth Work-shop on Statistical Machine Translation, pages 59–65, Baltimore, USA, June.
Ergun Bic¸ici. 2013. Referential translation machines for quality estimation. InProc. of the Eighth Workshop on Statistical Machine Translation, pages 343–351, Sofia, Bulgaria, August.
Chris Bliss. 2012. Comedy is transla-tion, February. http://www.ted.com/talks/ chris bliss comedy is translation.html.
Ondrej Bojar, Christian Buck, Christian Federmann, Barry Haddow, Philipp Koehn, Johannes Leveling, Christof Monz, Pavel Pecina, Matt Post, Herve Saint-Amand, Radu Soricut, Lucia Specia, and Aleˇs Tam-chyna. 2014. Findings of the 2014 workshop on statis-tical machine translation. InProceedings of the Ninth Workshop on Statistical Machine Translation, pages 12–58, Baltimore, Maryland, USA, June.
Pierre Geurts, Damien Ernst, and Louis Wehenkel. 2006. Extremely randomized trees. Machine Learning, 63(1):3–42.
David Jurgens, Mohammad Taher Pilehvar, and Roberto Navigli. 2014. SemEval-2014 Task 3: Cross-level semantic similarity. InProc. of the 8th International Workshop on Semantic Evaluation (SemEval 2014), pages 17–26, Dublin, Ireland, August.
Philipp Koehn, Hieu Hoang, Alexandra Birch, Chris Callison-Burch, Marcello Federico, Nicola Bertoldi, Brooke Cowan, Wade Shen, Christine Moran, Richard Zens, Chris Dyer, Ondrej Bojar, Alexandra Con-stantin, and Evan Herbst. 2007. Moses: Open source toolkit for statistical machine translation. In ACL, pages 177–180, Prague, Czech Republic, June. Philipp Koehn. 2010. An experimental management
sys-tem.The Prague Bulletin of Mathematical Linguistics, 94:87–96.
Marco Marelli, Luisa Bentivogli, Marco Baroni, Raf-faella Bernardi, Stefano Menini, and Roberto Zam-parelli. 2014. SemEval-2014 Task 1: Evaluation of compositional distributional semantic models on full sentences through semantic relatedness and textual en-tailment. InProc. of the 8th International Workshop on Semantic Evaluation (SemEval 2014), pages 1–8, Dublin, Ireland, August.
Preslav Nakov, Torsten Zesch, Daniel Cer, and David Ju-rgens, editors. 2015. Proc. of the 9th International Workshop on Semantic Evaluation (SemEval 2015). Denver, Colorado, USA, 4-5 June.
Robert Parker, David Graff, Junbo Kong, Ke Chen, and Kazuaki Maeda. 2011. English Gigaword fifth edi-tion, Linguistic Data Consortium.
A. J. Smola, N. Murata, B. Sch¨olkopf, and K.-R. M¨uller. 1998. Asymptotically optimal choice ofε-loss for sup-port vector machines. In L. Niklasson, M. Boden, and T. Ziemke, editors,Proc. of the International Con-ference on Artificial Neural Networks, Perspectives in Neural Computing, pages 105–110, Berlin.
Lucia Specia, Nicola Cancedda, Marc Dymetman, Marco Turchi, and Nello Cristianini. 2009. Estimating the sentence-level quality of machine translation systems. In Proc. of the 13th Annual Conference of the Eu-ropean Association for Machine Translation (EAMT), pages 28–35, Barcelona, Spain, May.
Kristina Toutanova, Dan Klein, Christopher D. Manning, and Yoram Singer. 2003. Feature-rich part-of-speech tagging with a cyclic dependency network. InProc. of the 2003 Conference of the North American Chapter of the Association for Computational Linguistics on Hu-man Language Technology - Volume 1, NAACL ’03, pages 173–180, Stroudsburg, PA, USA.
Task Subtask Domain Model RAE MAER MRAER CLSS 2014 Paragraph to Sentence Mixed TREE 0.4579 0.5112 0.5037
STS 2014 English OnWN TREE 0.5585 0.7975 0.546
QET 2014 English-Spanish PEE Europarl PLS-TREE 1.0794 0.304 0.614
STS 2015 English Images TREE 0.5885 0.5424 0.6229
STS 2015 English Headlines RR 0.5894 0.4844 0.6380
CLSS 2014 Sentence to Phrase Mixed TREE 0.6255 0.6857 0.6444 QET 2014 German-English PEE Europarl RR 0.8204 0.3575 0.679 QET 2014 English-German PEE Europarl TREE 0.8602 0.3692 0.6985
STS 2014 English Images TREE 0.7395 0.8338 0.7246
QET 2014 Spanish-English PEE Europarl FS-RR 0.9 0.3798 0.7491 QET 2014 English-Spanish PET Europarl SVR 0.7223 0.4651 0.7786
STS 2014 English Headlines TREE 0.7845 0.6711 0.7854
SRE 2014 English SICK R+L PLS-SVR 0.6645 0.1827 0.8177
ParSS 2015 English Tweets SVR 0.775 0.6901 0.838
STS 2015 English Answers-students PLS-SVR 0.7819 0.5542 0.8404 CLSS 2014 Phrase to Word Mixed TREE 0.9488 1.1454 0.8483
STS 2013 English OnWN L+S SVR 0.8255 1.2875 0.8605
STS 2014 English Tweet-news TREE 0.8093 0.4601 0.875
QET 2014 English-Spanish HTER Europarl SVR 0.8532 0.7727 0.8758
STS 2014 English Deft-news TREE 0.8716 0.6271 0.881
STS 2015 Spanish News TREE 0.9426 0.4096 1.1052
STS 2013 English Headlines L+S SVR 1.0231 1.0456 1.1444
STS 2015 Spanish Wikipedia TREE 0.9499 0.4844 1.2062
STS 2014 English Deft-forum TREE 1.0908 0.7724 1.216
STS 2015 English Answers-forums PLS-SVR 1.1675 1.5369 1.3449
STS 2013 English FNWN L+S SVR 1.2633 1.5087 1.4048
STS 2015 English Belief PLS-SVR 1.1825 1.5749 1.4119
STS 2014 Spanish Wikipedia TREE 1.3579 0.65 1.6612
STS 2014 Spanish News TREE 1.4141 0.5994 1.8053
[image:8.612.73.551.153.589.2]STS 2013 English SMT L+S SVR 1.6132 0.1669 2.0718