doi:10.4236/wet.2010.11004 Published Online July 2010 (http://www.SciRP.org/journal/wet)
WiMAX System Simulation and Performance
Analysis under the Influence of Jamming
Rakesh Jha, Hardik Patel, Upena D. Dalal, Wankhede A. Vishal
Department of Electronics Engineering, Sardar Vallabhbhai National Institute of Technology, Surat, India. Email: {jharakesh.45, wankhedeva}@gmail.com, [email protected], [email protected]
Received May 15th, 2010; revised June 20th, 2010; accepted July 7th, 2010.
ABSTRACT
This paper presents simulation of WiMAX based system under jamming. The performance of the system was found out to greatly differ with the use of different jamming signals, allowing central areas to be identified, where system devel-opment should be focused on. In addition, from the basic theory point of view, rather surprising results were also found. This work should give a clear picture of how the studied WiMAX system performs under jamming as well as without jamming. The results show that some forms of interference degrade the performance of the system rapidly, thus the form of incoming jamming should be known and considered before deploying the system. Single carrier jamming and mul-ti–carrier jamming are discussed here. The issues related to jamming and jamming reduction techniques are also cov-ered. Jamming can destroy communication in the targeted area. Multi–carrier jamming is challenge in WiMAX because WiMAX is having OFDM based physical layer. Simulation is the main approach in this paper. OPNET MODELER 14.5
is the software used for the simulation purpose.
Keywords: Jamming, Multicarrier, WiMAX, OFDM
1. Introduction
IEEE 802.16 is the standard for WiMAX. WiMAX is also known as wireless broadband. IEEE 802.16d – 2004 is known as fixed WiMAX and IEEE 802.16e – 2005 is known as mobile WiMAX [1]. In wired networks physi-cal layer threats are not important but in wireless air is used as medium so physical layer threats comes into pic-ture [2]. In wireless jamming and scrambling are consid-ered as physical layer threats. Mac layer threats are diff- erent than physical layer threats. Here simulation approa- ch is used to see the performance of the IEEE 802.16e – 2005 fixed NLOS (Non line of sight) system in jamming environment. Jamming is achieved by introducing a sou- rce of noise strong enough to significantly reduce the ca- pacity of the WiMAX channel. The information and eq- uipment required to perform jamming are not difficult to acquire. Resilience to jamming can be augmented by inc- reasing the power of signals or increasing the bandwidth of signals via spreading techniques such as frequency hopping or direct sequence spread spectrum. The practi-cal options include a more powerful WiMAX transmitter, a high gain WiMAX transmission antenna, or a high gain WiMAX receiving antenna [3]. It is easy to detect jam-ming in WiMAX Communications as it can be heard by
the receiving equipment. Law enforcement can also be involved to stop jammers. Since jamming is fairly easy to detect and address, so it does not pose a significant im-pact on both the WIMAX users and systems. Single car-rier jamming and multi–carcar-rier jamming are considered here for simulation approach. Single carrier jamming is used to jam the particular band of frequencies. In single carrier jamming carrier frequency and bandwidth of the targeted system should be known. In multi–carrier jam-ming the frequencies of carriers of targeted system should be known. Simulation approach is easy compare to practical approach. The issues related to practical ap-proach will be described in the later part.
2. The Investigated Physical Layer
the system under investigation in this paper. Denial of service is very similar to jamming but it is MAC layer threat [5].
At the transmitter side, the information data first un-dergoes channel coding composed of randomization, for- ward error correction (FEC), and interleaving. Random-izer uses a Linear Feedback Shift Register (LFSR) to scatter long data strings of zeros or ones. FEC concaten- ates an outer Reed–Solomon encoder with an inner rate compatible convolutional encoder. FEC helps to correct the errors in subcarriers to a certain limit. The interleaver takes two permutations to rearrange the subcarriers so that the burst errors are distributed more uniformly at the demodulation input. After channel coding, data bits are mapped and modulated onto the allocated subcarriers by QPSK, 16–QAM and 64–QAM modulation. Subse-quently, data are transmitted by OFDM method. In the receiver side, all the procedures carried out in the trans-mitter side are implemented again but in a reverse direc-tion. One OFDM symbol can be divided into two parts in time domain: the cyclic prefix (CP) time and the useful symbol time [6,7]. The CP locates in the beginning of the symbol and is a duplication of the tail of the useful sym-bol, which is introduced to mitigate the effect of multi-path. In frequency domain, an OFDM symbol is compo- sed of a series of subcarriers. In Wireless MAN–OFDM PHY, the number of subcarriers is 256. As per Figure 1, three types of subcarriers can be categorized: 192 data subcarriers carrying payload, 8 pilot subcarriers mainly for channel estimation, and 56 null subcarriers for guard- ing purpose. The pilot subcarriers distribute evenly am- ong the data subcarriers. This is standard symbol in fre-quency domain.
Channel estimation is mandatory for the OFDM syst- ems employing coherent detection. Comb type pilot cha- nnel estimation is capable of collecting instant informat- ion of the channel and therefore used in this research. The channel estimation for the payload subcarriers is ac- hieved by interpolation, using the channel information obtained at the 8 pilot subcarriers. In this paper IEEE 802.16e–2005 is simulated under jamming. In Mobile WiMAX, the FFT size is scalable from 128 to 2,048. Here, when the available bandwidth increases, the FFT size is also increased such that the subcarrier spacing is always 10.94 kHz. This keeps the OFDM symbol dura-
Data subcarriers DC subcarrier Pilot subcarriers
[image:2.595.57.288.624.693.2]Guard band Channel Guard band
Figure 1. OFDM symbol frequency domain representation [7]
tion, which is the basic resource unit, fixed and therefore makes scaling have minimal impact on higher layers. A scalable design also keeps the costs low. The subcarrier spacing of 10.94 kHz was chosen as a good balance be-tween satisfying the delay spread and Doppler spread requirements for operating in fixed and mobile environ-ments. This subcarrier spacing can support delay–spread values up to 20 micro seconds and vehicular mobility up to 125 km per hour when operating in 3.5 GHz. A sub-carrier spacing of 10.94 kHz implies that 128, 512, 1,024, and 2,048 FFT are used when the channel bandwidth is 1.25 MHz, 5 MHz, 10 MHz, and 20 MHz, respectively. 2–11 GHz is used for Fixed NLOS and 2–6 GHz is used for mobile NLOS. It should, however, be noted that mo-bile WiMAX may also include additional bandwidth pro-files. For example, a profile compatible with WiBro will use an 8.75 MHz channel bandwidth and 1,024 FFT. This obviously will require different subcarrier spacing and hence will not have the same scalability properties. The number of subcarriers may be 512, 1024 and 2048. Data subcarriers, Null subcarriers and Pilot subcarriers are also given in next section for 512, 1024 and 2048 subcarriers.
3. Jamming in Detail
There are two types of jamming: single carrier jamming and multicarrier jamming.
3.1 Single Carrier Jamming
The goal of single carrier jamming is to insert an interfe- rence signal into the enemy communication system so that the wanted signal is completely submerged by the interference. This form of jamming is also known as de-nial of service attack or obscuration jamming. The opti-mal jamming waveform is intuitively white Gaussian noise (WGN), since from the information theory point of view, it has maximum entropy. This conclusion can also be drawn from the fact that the receiver can not distin-guish between jammer injected noise and its own [8-9]. Based on the relationship between jammer bandwidth and that of the equipment, single carrier jamming can be categorized into narrow– (spot) and wideband (barrage) jamming. The relationship is conveniently expressed as
J
VS
B Jammer_bandwidth
=
B Victim_system_bandwidth (1)
either 45 degrees slant polarized or circularly polarized jammer radiations. This causes a rather modest effective radiated power (ERP) drop of typically 3 dB, but more serious losses in the order of tens of dB occur as a result of bad noise quality and e.g. orthogonal polarization be-tween jammer and victim antennas. The easiest way of creating an effective noise jammer is to pass band–limited noise through an RF–amplifier and to the transmitting antenna. This method is also known as direct noise amplification (DINA).
3.2 Multicarrier Jamming
Multicarrier jamming differs from single carrier jamming by being suitable only for jamming the system it is desi- gned for. The general idea is to determine the most criti-cal vulnerability of the victim system in terms of the car-riers used and then inject a very narrowband signal, e.g. zero bandwidth sine signal, onto the those carriers. If da- ta subcarriers are destroyed by jamming then information is lost so throughput is reduced so bit error rate (BER) is increased. If pilot subcarriers are destroyed by jamming then channel estimation is very difficult. More informa-tion about the enemy’s equipment is required in multic- arrier jamming, because only some subcarriers are targ- eted. In simulation only fixed NLOS is considered. In OFDMA there are data subcarriers, pilot subcarriers, gu- ard subcarriers. The simulation parameters required for multicarrier jamming are described in next section.
4. Simulation Setup
4.1 Simulation Parameters for Single Carrier Jamming
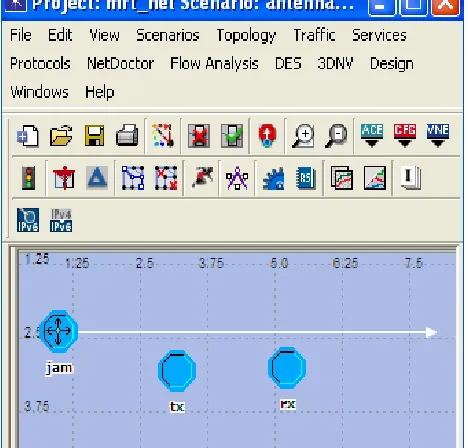
In this paper fixed NLOS WiMAX system is simulated under jamming. Single carrier jamming scenario is sho- wn in Figure 2.
The node model of jammer is given in Figure 3. Source parameters for the jammer are packet inter–arr- ival time, packet size, jammer start time, stop time and transmitter power. According to target system these pa-rameter are chosen.
Radio parameters are data rate, packet formats, freque- ncy and bandwidth. Frequency is chosen according to ca- rrier frequency of target system.
Antenna can be isotropic, WiMAX Omni and WiMAX sector antenna. Polarization is also much important in pr- actical case of jamming. If polarization of jamming sys-tem antenna is not proper then it results in wastage of power.
4.2 Simulation Parameters for Multicarrier Jamming
Multi carrier jamming is difficult to simulate. In this pa-per multi carrier jamming effect is modeled. Symbol du-ration is calculated by the following equation. In scalable
OFDMA the symbol duration and subcarrier spacing is
s b g
T T T (2) 1
_
b
T
delta f (3)
_ bandwidth
delta f n
subcarriers (4)
8
b
g
T
T (5)
where, n = sampling factor
delta_ f = tone spacing TS = symbol duration
Tg = guard time
Tb = useful symbol duration
[image:3.595.307.538.98.271.2]fixed. Number of sub-carriers and bandwidth is changed to keep symbol duration and subcarrier spacing fixed. Equation (4) shows number of subcarriers is proportional to bandwidth of channel for scalable OFDMA. It is mul-ticarrier scheme. Mulmul-ticarrier jamming scenario is shown in Figure 4.
Figure 2. Scenario used for single carrier jamming
[image:3.595.307.541.372.596.2]Figure 4. Scenario used to simulate multicarrier jamming
In this scenario fixed NLOS is considered. There are two subscriber stations. Application and profile node is used to create an application. WiMAX configuration node is used to configure WiMAX properties. IEEE 802.16e uses fixed and mobile NLOS. There are two subcarrier permutation modes FUSC (full usage subcarrier) and PUSC (partial usage subcarrier). Uplink and downlink both can use different permutation modes in single ap-plication [10,11].
In uplink PUSC subcarrier permutation is given in Table 1 [11]. Same way in Downlink PUSC subcarrier permutation is given in Table 2. In Simulation depending on number of subcarriers and permutation scheme used parameters are chosen from the given tables.
Table 1. PUSC permutation scheme for uplink [11]
512 1024
Number of sub channels 17 35
Data subcarriers used 272 560
Pilot subcarrier 136 280
Left–guard subcarriers 52 92
Right–guard subcarriers 51 91
Downlink PUSC permutation scheme is also used in simulation. Numbers of data, pilot and guard subcarriers required for scalable OFDMA are shown in the table.
Steps involved in multicarrier jamming simulation are described below.
1) Take the scenario as shown in Figure 4. Set the ap-plication which is to be examined under jamming effect. Select parameters for the same.
2) Now choose number of subscribers and base sta-tions. Set their attributes according to application.
3) Set WiMAX attributes of all subscribers and base station. Set the symbol duration according to standards.
4) Set permutation mode as per the simulation criteria. 5) Now simulate the scenario and see the throughput and delay.
6) Take new scenario as shown in Figure 4 and repeat step number 1 to 4. Reduce number of data or pilot or guard subcarriers in uplink or downlink as per simulation criteria but keep symbol duration, subcarrier spacing and bandwidth same as the first scenario.
7) Now simulate this scenario and compare the thro- ughput and delay result with previous result.
By following above steps multicarrier jamming effect can be simulated and results can be noted down.
5. Results
In first scenario two subscriber stations are there and jammer is moving towards subscriber stations and then moving away as show in Figure 2. This scenario is build to simulate single carrier jamming. The simulation time is taken by considering movement of jammer. The result shown in Figure 5 is BER performance under jamming for different modulation schemes.
Second result shown in Figure 6 is taken using the same scenario but the antennas used in subscriber stati- ons are changed to see the impact antennas under jam-ming.
Figure 6 shows the BER vs. simulation time for dif-ferent antenna used at receiver side under jamming effect. Jammer has isotropic antenna. Now new scenario is tak- en as shown in Figure 4 to simulate the effect of scalabi- lity property of OFDMA. In this scenario two subscriber stations and one base station are there. Any application
Table 2. PUSC permutation scheme for downlink [1]
128 512 1024 2048
Number of sub channels 3 15 30 60
Data subcarriers used 72 360 720 1440
Pilot subcarrier 12 60 120 240
Left–guard subcarriers 22 46 92 184
Figure 5. BER vs. simulation time
Figure 6. BER vs. simulation time
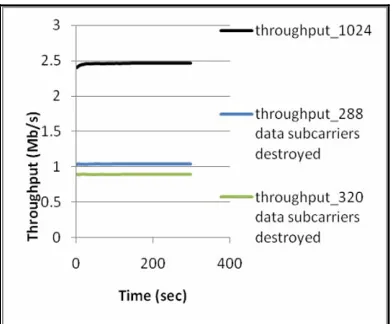
can be used to simulate multi carrier jamming. In this sc- enario Video conferencing application is chosen. Number of subcarriers chosen for this application is 512 and bandwidth is 5 MHz for this application. The symbol duration is 102.86 micro seconds and subcarrier spacing is 10.94 KHz. Uplink and downlink both is using PUSC. Take new scenario as shown in Figure 4 and keep all the parameters same except number of subcarriers and band- width. Now choose 1024 subcarriers and 10 MHz band-width. The results for scalability property are shown in Figure 7 and Figure 8. Simulation time is set to 300 seconds. Throughput and delay of whole system is con-sidered in the results. The system throughput is the sum of all data rates that are delivered to all terminals in a network. Delay is time taken by a packet to reach its des-tination starting from the time it leaves the source.
Now new scenario is taken as shown in Figure 4 to si- mulate multicarrier jamming effect. Sampling factor n is 28/25 and number of subcarriers are 1024. This scenario is run for 300 seconds. Bandwidth is 10 MHz, subcarrier spacing is 10.94 KHz same as second scenario. Data subcarriers in uplink PUSC and downlink PUSC are 560 and 720 respectively. Number of sub channels in uplink PUSC and downlink PUSC are 35 and 30 respectively.
Figure 7. Throughput vs. simulation time
Figure 8. Delay vs. simulation time
Now follow the steps that are already mentioned in simu-lation section to simulate multi carrier jamming. Proce-dure to simulate multicarrier jamming is already men-tioned. In uplink the effect of data subcarrier reduction is more compare to that in downlink. Results for uplink multicarrier jamming are shown in Figure 9 and Figure 10. Graph of throughput and delay vs. simulation time are shown.
Figure 9. Throughput vs. simulation time for uplink Figure 10. Delay vs. simulation time for uplink
Figure 11. Throughput vs. simulation time for downlink Figure 12. Delay vs. simulation time for downlink
6. Conclusions
The performance of BPSK and QPSK is better than other modulation scheme under single carrier jamming. WiM- AX sector antenna gives better performance than isotro- pic and WiMAX Omni antennas. Throughput is decree- ased when data subcarriers are destroyed in uplink and downlink. Throughput is reduced means BER is incr- eased. Delay is increased when data subcarriers are de-stroyed in uplink and downlink. Uplink is more sensitive to data subcarrier reduction compare to downlink. Single carrier jamming and multicarrier jamming both are destr- uctive in nature. Single carrier jamming can be detected easily compare to multicarrier jamming. The performa- nce of the downlink PUSC is better than uplink PUSC under the influence of the multicarrier jamming. Multi-carrier jamming effects are modeled in this paper by fol-lowing particular algorithm which is already mentioned earlier. In this paper only simulated results are shown. In practical multicarrier jamming effect on throughput and delay remains same as shown by the simulated results. In practical case of multicarrier jamming antenna
polariza-tion and its pattern have to be considered. The paper shows results for fixed NLOS only. Mobile NLOS can be considered with some additional simulation parameters related to mobility under jamming effect.
REFERENCES
[1] J. G. Andrews, A. Ghosh and R. Muhamed, “Fundamen-tals of WiMAX Understanding Broadband Wireless Networking,” Prentice-Hall, Upper Saddle River, 2007.
[2] S. Haykin and M. Moher, “Modern Wireless Communi-cation,” Prentice-Hall, Upper Saddle River, 2005. [3] S. Ahson, M. Ilyas, S. Ahson and M. Ilyas, “WiMAX
Standards and Security,” CRC Press, Boca Raton, 2008.
[4] T. Shon and W. Choi, “An Analysis of Mobile WiMAX security: Vulnerabilities and Solutions,” Lecture Notes in Computer Science, Springer Berlin, Vol. 4658, 2007, pp. 88-97.
[5] C. L. Luo, “A Simple Encryption Scheme Based on WiMAX,” Department of Electronics Jiangxi University of Finance and Economics Nanchang, China, 2009.
[image:6.595.319.526.84.243.2] [image:6.595.318.525.281.435.2] [image:6.595.66.281.282.437.2]WiMAX Mesh Network,” Communications Laboratory, Helsinki University of Technology, Helsinki, June 2006.
[7] J. Li and S.-G. Häggman, “Performance of IEEE 802.16 Based System in Jamming Enviornment and its Im-provement with Link Adaption,” The 17th Annual IEEE International Symposium on Personal, Indoor and Mobile
Radio Communications (PIMRC’06), 2006,Helsinki, pp.
1-5.
[8] M. Nasreldin, H. Aslan, M. El-Hennawy and A. El-Hen- nawy, “WiMAX Security,” 22nd International Confer-ence on Advanced Information Networking and
applica-tions, Ginowan, 2008,pp. 1335-1340.
[9] White Paper by Motorola, “WiMAX Security for Real–
World Network Service Provider Deployments,” 2007.
[10] IEEE 802.16 Working Group, “IEEE 802.16–2004 Local and Metropolitan Area Networks – Part 16: Air Interface for Fixed Broadband Wireless Access Systems IEEE Standard for Local and Metropolitan Area Networks,” IEEE Computer Society Press, 2004.
![Figure 1. OFDM symbol frequency domain representation [7]](https://thumb-us.123doks.com/thumbv2/123dok_us/8981679.393339/2.595.57.288.624.693/figure-ofdm-symbol-frequency-domain-representation.webp)