Multi-ion conduction bands in a simple model of calcium ion channels
I. Kaufman1, D.G. Luchinsky1,2, R. Tindjong1, P.V.E. McClintock1* and R.S. Eisenberg3 1
Department of Physics, Lancaster University, Lancaster, LA1 4YB, UK;
2
NASA Ames Research Center, MS 269-3, Moffett Field, CA, 94035, USA;
3
The Department of Molecular Biophysics and Physiology, Rush Medical College, IL 60612, USA
*E-mail: [email protected];
Published 12 September 2012 Online at arxiv.org/abs/1209.2381
We report self-consistent Brownian dynamics simulations of a simple electrostatic model of the selectivity filters (SF) of calcium ion channels. They reveal regular structure in the conductance and selectivity as functions of the fixed negative charge Qf at the SF. This structure comprises distinct regions of high conductance (conduction bands)
M0, M1, M2 separated by regions of zero-conductance (stop-bands). Two of these conduction bands, M1 and M2, are related to the saturated calcium occupancies of P=1 and P=2, respectively and demonstrate self-sustained conductivity. Despite the model’s limitations, its M1 and M2 bands show high calcium selectivity and prominent anomalous mole fraction effects and can be identified with the L-type and RyR calcium channels.
1.
Introduction
Voltage-gated calcium ion channels play an important role in stimulating muscle contraction, in neurotransmitter secretion, gene regulation and transmission of action potentials, based on their high selectivity for divalent calcium ions Ca2+ over monovalent sodium ions Na+. They exhibit the Anomalous Mole Fraction Effect (AMFE), an effective blockade of Na+ permeation by small concentrations of Ca2+, combined with measurable Ca2+ currents in the pA range [1].
The selectivity of calcium channels is defined by a narrow selectivity filter (SF) with a strong binding site formed by negatively-charged protein residues [1, 2]. Wild-type calcium channels and their mutants differ in the composition, structure (locus) and net fixed charge Qf of these protein residues at the SF. The
most-studied L-type calcium channel possesses an EEEE locus with an estimated Qf=3-4e [2, 3], where
e=-1.6x10⁻¹⁹C. The ligand-gated Ryanodine receptor (RyR) calcium channel has a DDDD locus with a larger Qf≈4.5e [4]. The L-type and RyR channels exhibit different threshold concentrations for blockage
of Na+ current by Ca2+ ions: [Ca]50≈1μM and [Ca]50≈1mM respectively [4].
Mutant studies show that Qf is crucial in determining the selectivity of the calcium channel. Usually,
mutations that influence Qf also destroy the channel’s selectivity and hence physiological functionality
[5]. However, an appropriate point mutation of the DEKA sodium channel (Qf ≈1e) converts it into a
calcium-selective channel with a DEEA locus and Qf ≈4e [6]. The essentially nonselective bacterial
OmpF porin (Qf ≈1e) can be also turned into a Ca-selective channel by introduction of two additional
glutamates in the constriction zone. The resultant mutant contains a DEEE-locus (Qf ≈4e) and
demonstrates a Na current with a strongly increased sensitivity to 1mM Ca [7].
Dynamic Monte-Carlo simulations of the flexible volume exclusion model of calcium and sodium channels [3, 8] show that the charge density at the SF is the first-order determinant of selectivity [3]; and the Na+ to Ca2+ occupancy ratio decreases monotonically as Qf increases from 1e (DEKA locus) to 4e
(DEEE locus), while the pore becomes more and more Ca2+ selective [9].
2
Although mutant studies [5-7] and simulations [2, 3, 9] have demonstrated very clearly the dominant influence of Qf on the selectivity of the calcium channel, it has remained unclear why particular values of Qf should be optimal for selectivity or how many such values may exist.
Selectivity and conductivity of calcium channel are connected with strong ion-ion repulsion and multi-ion occupancy of the SF [2, 8, 11]. The discreteness of the multi-ionic occupancy also plays a significant role in ion channels conductivity and is expected to manifest as discrete multi-ion steps/bands in the dependences of occupancy and conductance on concentration, time and other parameters [12-14]. These steps/bands are related to barrier-less knock-on conduction mechanism that has been suggested as being the underlying mechanism responsible for the conductivity and selectivity of ion channels [15].
In this article, we show that the Ca2+ conductance and selectivity of a simple model of calcium channels forms a regular structure of conduction/selectivity bands (regions) as a function of Qf, separated by
non-conduction bands, related to saturated, barrier-less, conductivity with different numbers of Ca2+ ions involved in the conduction. The conductance peak obtained in [2] is one part of this structure. We infer that all calcium-selective channels (both wild-type and mutants) should correspond to one of these bands.
2.
Methods
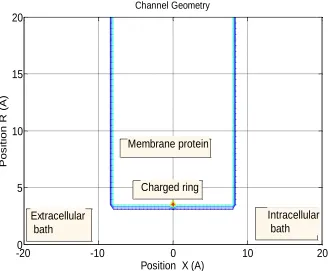
The reduced axis-symmetrical model (Figure 1) represents the selectivity filter (SF) of a calcium ion channel [2, 3]. Extracellular (left) and intracellular (right) baths are filled by ionic sodium-only, calcium-only or mixed sodium-calcium in-water solution. In this research we use an asymmetrical ionic concentration: CL>0, CR=0.
Channel Geometry
Position X (A)
Pos
it
ion
R
(A)
-200 -10 0 10 20
5 10 15 20
Extracellular bath
Charged ring Membrane protein
[image:2.612.144.473.367.638.2]Intracellular bath
Figure 1. Reduced axis-symmetrical model of the calcium ion channel. The selectivity filter of a calcium ion channel is modelled as a water-filled cylindrical hole of radius R=3Å and length L=16Å through the protein hub in a cellular membrane with a centrally-placed uniformly-charged rigid ring with negative charge Qf
=0-6.5e. The right-hand bath (modeling extracellular space) contains a non-zero concentrations of Ca2+ and Na+
3
The minimum possible radius R of the SF of an L-type calcium channel has been determined as being
R=2.8Å. We use the value of R=3.0Å. We choose the length L=16Å as being close to the parameter value used in [3] . Moving sodium and calcium ions are described as charged particles of radius Ri≈1Å
(matching both ions), with diffusion coefficients of DNa=1.17x10
-9
m2/s and DCa=0.79 x 10
-9
m2/s, respectively.
Negatively-charged protein residues are modelled as forming a single, thin, uniformly-charged, centrally-placed, rigid ring around the SF. This ring is located inside the wall and brings a net negative charge Qf of 0- 6.5e.
The electrostatic forces were derived self-consistently by numerical solution of Poisson’s equation with respect to the ion-ion interaction, channel geometry (Figure 1), self-potential barrier of the dielectric boundary force [16], value of Qfand value of applied potential V.
Our reduced model of the SF takes both water and protein to be homogenous continua with dielectric constants εw=80 and εp=2, respectively, together with a primitive model of ion hydration. The
self-consistent electrostatics of a narrow, water-filled, channel in the protein wall results in the axial quasi-1D behaviour of the electrostatic field, and hence in single-file movement of positive ions inside the channel [17]. Electrostatics also prohibits the entrance of any negatively charged ions [16]. Thus we simulate cations-only movement inside the SF and in its close vicinity as axial single-file movement.
The BD simulations are based on numerical solution of the 1D over-damped Langevin equation:
)
(
2
'
Du
D
t
x
x
(1)
where x stands for the ion’s position, D is its diffusion coefficient, u is the self-consistent potential in
kBT/e units, and ξ(t) is normalized white noise.
We use an injection scheme where moving ions are injected randomly close to the left vicinity of the SF with an arrival rate that simulates the diffusive ionic flux from the undisturbed bulk with concentration
C through the Smoluchowski diffusion rate Jarr=2πDRC. Simulations were performed with applied
voltage V=0mV corresponded to depolarised membrane.
The validity of continuum electrostatics and Langevin dynamics for narrow channels is roughly defined by the relationship between the channel radius R and the radius of the ion’s first hydration shell Rh [18];
Rh≈3.5Å for Na
+
and Ca2+ ions. The calcium channel with R≈ 3 Å [1] provides some room for Na+ and Ca2+ ions to pass water molecules [18], so that the continuum approximation still can be used inside the SF but with effective values of εw and diffusion coefficients DNa, DCa that are all dependent on R [18]. It is
shown in [18] that the effective εw saturates to its bulk value εw=80 for R≈3.5 Å (roughly corresponding to Rh) and still close to it (εw≈70) for R=3Å. The effective ionic diffusion coefficients also decreased with
decreasing R in comparison with bulk values [19].
In this investigation we use the bulk values of εw and D as their effective values throughout the whole
compatational domain including the SF. This reduced model represents a considerable simplification of the actual electrostatics and dynamics of moving ions and water molecules in single-file within the narrow SF [19, 20].
The BD simulations of ion current J and occupancy P were performed separately for CaCl2 and NaCl
solutions, and also for a mixed-salt configuration, with concentrations [Na]=30mM and 20μM ≤ [Ca] ≤ 80mM. The value of Qf was varied within the range 0-6.5e in order to cover the known variants of
4
3.
Results and discussion
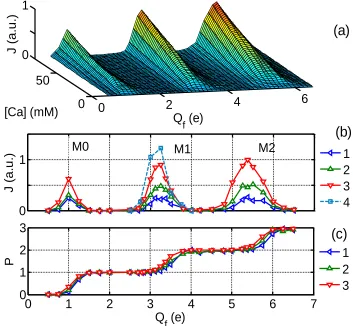
Fig. 1 (a) and (b) demonstrate our main result - the appearance of regular structure in the Ca2+ ion current J as a function of Qf, and [Ca] comprising areas of high conductance (conduction bands) M0,
M1, M2 separated by zero-conductance stop-bands. The peak separation ΔQ≈2e corresponds roughly to the charge on one Ca2+ ion. Band M1 coincides with the J peak from [2] .
The Ca2+ occupancy P exhibits step-wise growth with increasing Qf (Fig. 1 (c)). The flat steps
correspond to non-conducting saturated states with P=0,1,2… where the potential well at the binding site is too deep to allow escape of a Ca2+ ion and too shallow to allow the next Ca2+ ion to enter the SF and push the bound ion(s) out. The conduction bands M0, M1 and M2 correspond to transitions in P: 0→1,
1→2, and 2→3, respectively. This picture corresponds to the “knock-on” mechanism of Ca2+
conductance and selectivity [1, 2]. It has an obvious analogue in semiconductor physics, where conduction also occurs in partially filled bands [21].
0
1
(b)
J
(a
.u
.)
1
2
3
4
0
1
2
3
4
5
6
7
0
1
2
3
(c)
Q
f
(e)
P
1
2
3
0
2
4
6
0
50
0
1
(a)
Q
f
(e)
[Ca] (mM)
J
(a
.u
.)
M0
M1
M2
Figure 2. Multi-ion conduction bands of the calcium channel model. (a) A 3D plot of the calcium current J vs fixed charge Qf and concentration [Ca] exhibits regular band structure. (b) A plot of J as a function of Qf and
[Ca] shows the M0, M1, and M2 bands: plots 1,2,3 are J and P for [Ca]=20mM, 40mM and 80mM, respectively; and 4 is the J peak from [2], corresponding to M1. (c) The occupancy P shows stepwise growth as Qf
[image:4.612.126.479.171.497.2]5
The appearance of distinct conduction bands is caused by the discreteness of the multi-ion occupancy
P. Their existence just for Ca2+ in the calcium channel relates to the high Qf and double-valence of Ca
2+
, enhancing the electrostatic effects of valence selectivity [10].
Mixed salt simulations (Fig. 2 (a)) show that the M1 and M2 JCa peaks are decreased and shifted to the
beginning of the transition regions in P, as compared with the corresponding peaks for a pure Ca2+ bath, due to attenuation by Na+ ions [2]. Fig. 2 (b) shows that the selectivity ratio R=(JCa/JNa) peaks at M1 and
M2, with R≈150 for the M1 conduction band, and that there is no selectivity outside these bands. The J
vs P plots (Fig. 2 (c)) are each drawn as a Jvs[Ca] simulation at constant Qf. They show that, at P=1 for
the M1 mode, and P=2 for M2, P remains almost constant (saturated) while J increases very rapidly. The saturated conductance appears only for distinct values of Qf where the output barrier for the bound Ca
2+
ion falls close to zero due to Coulomb repulsion between the Ca2+ ions, leading to barrier-less conduction [14, 15]. The arriving ion instantly pushes out and replaces the bound ion, so that P remains constant [15]. The saturated conductance provides the highly selective self-sustained Ca2+ flux in a mixed salt bath with a permanently Ca2+-occupied channel that is blocked for Na+ ions [2].
Because the ion channels of living cells are designed to conduct particular ions selectively, we expect wild-type calcium channels to correspond to one of the high-selectivity bands M1 or M2. Nonselective channels with intermediate Qf might correspond to mutants. We now argue that, based on their Qf values
0
1
2
3
4
5
6
7
0
50
100
150
Q
f
(e)
R
(b)
R
0
0.5
1
1.5
2
2.5
3
0
0.5
1
P
J
(a
.u
.)
(c)
M1
M2
0
0.5
1
J
(a
.u
.)
(a)
1
2
3
M2
[image:5.612.122.490.133.437.2]M1
M2
Figure 3. Conduction and selectivity bands for a [Na]=30mM, [Ca]=40mM mixed salt bath. (a) Currents Jvs fixed charge Qf. Curves: 1 - Ca, 2 - Na, 3 – Ca for a pure bath (reference curve from Figure 1). (b) The
selectivity ratio R=JCa/JNa exhibits sharp peaks for the M1 and M2 bands. (c) JCa vs Ca2+ occupancy P. The
6
and AMFE properties, the M1 and M2 bands correspond respectively to the L-type and RyR calcium channels.
Fig. 3 presents the dependences of J and P on [Ca] for the M1 and M2 bands in a mixed salt configuration. As shown in (a), (b), the M1 band with Qf=3e shows a strong blockade of the current JNa of
Na+ ions with a blockade onset at [Ca]50≈ 30μM. The blockade occurs after the first Ca2+ ion has occupied the SF: PCa→1. The strong blockade with relatively low onset agrees qualitatively with the
observed properties of the L-type channel [1]. The value of Qf, and conduction mechanism for M1 also
correspond to the model [2] of the L-type channel (EEEE locus).
For the M2 band with Qf=5e (Fig. 2, (c), (d)) blockade onset occurs at [Ca]50≈ 0.2mM, corresponding
to double-occupancy of the SF. M2 also shows a larger calcium current than M1. These parameters of AMFE and the value of Qf can be matched to the RyR channel (DDDD locus) [4].
The effective parameter values in our model (R, L) can be varied within restricted ranges to fit experimental data for real channels [2, 3]. Our parametric study (see Appendix) shows that the simulated bands are only weakly sensitive to variations of R and L in the ranges: R=2.5-3.5Å, L=12-20 Å. Further decrease of L, or increase of R, leads to a weakening of the bands and to their eventual disappearance (at
10-6 10-5 10-4 10-3 10-2 10-1
[Ca] (M) (d)
(c)
0 1
J
(a.
u.
)
(a)
10-6 10-5 10-4 10-3 10-2 10-1
0 1 2 3
P
[Ca] (M) (b)
M2
M2
M1 M2
M2
M1
J for M2 P for M2
J for M1
P for M1J for M2
P:M2
J:M2
J:M1
P:M1
Figure 4. AMFE for a mixed salt bath. Sodium (blue, triangles) and calcium (red, squares) currents J and occupancies Pvs Ca2+ concentration [Ca] in highly-selective M1 and M2 channels for [Na]=30mM. (a),(b) M1
shows strong blockade and AMFE at PCa=1 with threshold [Ca]50≈ 30μM. (c),(d) M2 shows blockade and
[image:6.612.109.502.115.442.2]7
L=8Å for R=3Å). Their disappearance for shorter SFs may be related to the existence of a minimum L
needed to hold two Ca2+ ions in the SF against their mutual Coulomb repulsion.
4.
Conclusions
In conclusion, self-consistent BD simulations in a reduced model of a calcium channel SF have revealed distinct calcium-selective conduction bands M1 and M2 as a function of Qf related to integer
values of P. The M1 band appears at Qf=3e with P=1, and the M2 band at Qf=5e with P=2. The M1 and
M2 bands show saturated self-sustained conductivity with high calcium selectivity (R=JCa/JNa≈150 for the
M1 band) and prominent AMFE, and can be identified with the L-type (EEEE locus) and RyR (DDDD locus) calcium channels, respectively.
Finally, we speculate that gating, and drug-induced blockade, may correspond to switching between a conduction band and a stop-band [13].
Acknowledgements
This work was supported by Engineering and Physical Sciences Research Council (EPSRC) (grant No: EP/G070660/1).
Appendix: Parametric study
We have performed a parametric study of the stability and variability of the simulated band structure (see main paper) to changes of the effective model parameters: the length L and radius R of the SF, the length H of the charged ring, and the applied voltage V (see Figure A1 -Figure A4 below). We show that the simulation results are relatively insensitive to changes in the model parameters. Distinct conductivity bands and selectivity bands exist within a range of parameter values, as we now describe in more detail.
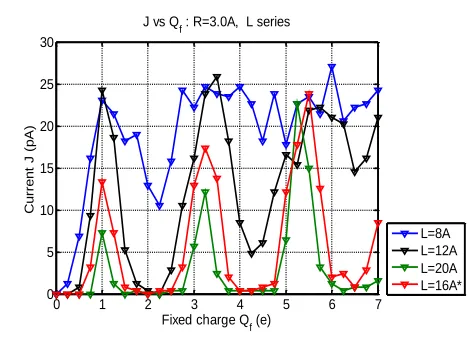
0 1 2 3 4 5 6 7
0 5 10 15 20 25 30
J vs Qf : R=3.0A, L series
Fixed charge Qf (e)
C
u
rre
n
t
J
(p
A)
L=8A L=12A L=20A L=16A*
0 1 2 3 4 5 6 7
0 5 10 15 20 25 30 35 40
J vs Qf : L=16A, R series
Fixed charge Q
f (e)
C
u
rre
n
t
J
(p
A)
R=4.5A R=4.0A R=3.0A* R=2.5A
Figure A1. Calcium current J vs fixed charge Qf,
showing how theband structure changes as the length
of the SF varies in the range L=8-20 Å. Increase of L leads to an increase of the contrast between conduction/non-conduction bands, combined with a decrease of J, and vice versa.
Figure A2. Calcium current J vs fixed charge Qf
[image:7.612.75.310.395.564.2] [image:7.612.324.545.396.563.2]8
The value of length L for the SF of calcium channels is usually estimated and modelled as being in the range L=5-15Å [2, 3] but the effective length could also depend from the geometry of SF vestibules. We have performed BD simulations with L varying from 8-20 Å to investigate the parametric dependence of the conductance bands on L, as shown in Figure A1. An increase in L leads to a sharpening of the band structure and to decreasing conductance. A decrease in L leads to a flattening and eventual disappearance of the band structure (at L<=10Å for R=3Å) combined with an increase of conductance.
We have performed parametric studies to see the effect of varying R. Figure A2 shows a significant decrease of selectivity with increasing R, and vice-versa. The band structure eventually disappears at
R=4.5Å.
We have performed a parametric study using varying lengths H=0-8Å of the charged ring. Figure A3 shows that the band structure is relatively insensitive to H. This finding agrees with the results of dynamic Monte-Carlo simulations [3, 9] for a flexible SF model, which showed that the selectivity is defined by the net charge rather than by a axial distribution of fixed charges.
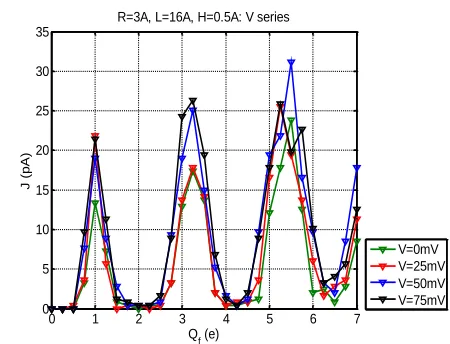
We have performed a parametric study using varying applied voltage V=0-75mV. Figure A4 shows that the band structure is relatively insensitive to V.
References
[1] Sather W A and McCleskey E W, Permeation and Selectivity in Calcium Channels. Annu. Rev. Physiol., 2003. 65. 133-169.
[2] Corry B, Allen T W, Kuyucak S, and Chung S-H, Mechanisms of Permeation and Selectivity in Calcium Channels.Biophys. J, 2001. 80. 195-214.
[3] Giri J, Fonseca J, Boda D, Henderson D, and Eisenberg B, Self-organized models of selectivity in calcium channels.Physical Biology, 2011. 8(2).
0 1 2 3 4 5 6 7
0 5 10 15 20 25 30
R=3A, L=16A: H series
Qf (e)
J
(p
A)
H=0.5A* H=4.0A H=8A
0 1 2 3 4 5 6 7
0 5 10 15 20 25 30 35
R=3A, L=16A, H=0.5A: V series
Qf (e)
J
(p
A)
V=0mV V=25mV V=50mV V=75mV
Figure A3. Calcium current J vs fixed charge Qf
showing how the band structure varies with the length of the charged cylindrical ring in the range H=0.5-8Å. The band structure is clearly not very sensitive to H.
Figure A4. Calcium current J vs fixed charge Qf
[image:8.612.319.544.320.492.2] [image:8.612.75.301.321.490.2]9
[4] Gillespie D, Giri J, and Fill M, Reinterpreting the Anomalous Mole Fraction Effect: The Ryanodine Receptor Case Study.Biophys. J, 2009. 97(8). 2212-2221.
[5] Burgess D L and Noebels J L, Voltage-Dependent Calcium Channel Mutations in Neurological Disease.Annals of the New York Academy of Sciences, 1999. 868(1). 199-212.
[6] Heinemann S H, Terlau H, Stuhmer W, Imoto K, and Numa S, Calcium channel characteristics conferred on the sodium channel by single mutations.Nature, 1992. 356(6368). 441-443.
[7] Miedema H, Meter-Arkema A, Wierenga J, Tang J, Eisenberg B, Nonner W, Hektor H, Gillespie D, and Meijberg W, Permeation Properties of an Engineered Bacterial OmpF Porin Containing the EEEE-Locus of Ca2+ Channels.Biophys. J, 2004. 87(5). 3137-3147.
[8] Boda D, Nonner W, Henderson D, Eisenberg B, and Gillespie D, Volume exclusion in calcium selective channels.Biophys. J, 2008. 94(9). 3486-3496.
[9] Csanyi E, Boda D, Gillespie D, and Kristof T, Current and selectivity in a model sodium channel under physiological conditions: Dynamic Monte Carlo simulations. BBA - Biomembranes, 2012. 1818(3). 592-600.
[10] Corry B, Vora T, and Chung S-H, Electrostatic basis of valence selectivity in cationic channels.
BBA- Biomembranes, 2005. 1711. 72-86.
[11] Hess P and Tsien R W, Mechanism of ion permeation through calcium channels. Nature, 1984. 309(5967). 453-456.
[12] Hille B and Schwarz W, Potassium Channels as Multi-Ion Single-file Pores.J. Gen. Physiol., 1978. 72. 409-442.
[13] Eisenberg R S, Atomic Biology, Electrostatics and Ionic Channels, in New Developments and
Theoretical Studies of Proteins, R. Elber, Editor 1996, World Scientific: Philadelphia. p. 269-357.
[14] Kharkyanen V N and Yesylevskyy S O, Theory of single-file multiparticle diffusion in narrow pores.Phys. Rev. E., 2009. 80(3). 031118.
[15] Yesylevskyy S O and Kharkyanen V N, Barrier-less knock-on conduction in ion channels: peculiarity or general mechanism? Chemical Physics, 2005. 312(1–3). 127-133.
[16] Nadler B, Hollerbach U, and Eisenberg R S, Dielectric boundary force and its crucial role in gramicidin.Phys. Rev. E., 2003. 68. 021905.
[17] Zhang J, Kamenev A, and Shklovskii B I, Conductance of Ion Channels and Nanopores with Charged Walls: A Toy Model.Phys. Rev. Lett., 2005. 95(14). 148101.
[18] Laio A and Torre V, Physical Origin of Selectivity in Ionic Channels of Biological Membranes. Biophys. J, 1999. 76(1). 129-148.
[19] Tieleman D P, C. Biggin P, R. Smith G, and S. P. Sansom M, Simulation approaches to ion channel structure–function relationships.QRB, 2001. 34(04). 473-561.
[20] Nelissen K, Misko V R, and Peeters F M, Single-file diffusion of interacting particles in a one-dimensional channel.EPL (Europhysics Letters), 2007. 80(5). 56004.
![Figure 3. Conduction and selectivity bands for a [Na]=30mM, [Ca]=40mM mixed salt bath](https://thumb-us.123doks.com/thumbv2/123dok_us/8109004.235839/5.612.122.490.133.437/figure-conduction-selectivity-bands-na-mixed-salt-bath.webp)
![Figure 4. AMFE for a mixed salt bath. Sodium (blue, triangles) and calcium (red, squares) currents J and occupancies P vs Ca2+ concentration [Ca] in highly-selective M1 and M2 channels for [Na]=30mM](https://thumb-us.123doks.com/thumbv2/123dok_us/8109004.235839/6.612.109.502.115.442/figure-triangles-squares-currents-occupancies-concentration-selective-channels.webp)