Z
Z C~ © o~
-r o o
K1
E
Mark Morgan and Joel W. Grube
THE ECONOMIC & SOCIAL RESEARCH INSTITUTE
THE ECONOMIC AND SOCIAL RESEARCH INSTITUTE
COUNCIL.
* TOM/\S F. 6 COFAIGH, I’reside77t of the hTstitTtte. * EUGENE McCARTHY, Chairman of the Cou~lcil.
KE\;IN BONNER, Seoetary Department of Entelpl~se & Emplc3~ment. JAMES CAWLEY, Managq’ng Partner; Cazoley & Compan); Solicitors.
HAM CONNELL.AN, Vice-President, Royal Dublin Sodety. * SEAN CROMIEN, Formc~" 8eoetar); DqmrtmeT~t of Finance.
WILLIAM B. DILLON, Chitf lZ.xecutive, Amdahl h’eland Limited. * MARGARET DOWNES, Deputy Governor; Bank of Ireland. * MAURICE E DOYLE, Former GovernoT; Central Bank ofh’eland.
* CONNELL FANNING, Professor; Department of Economia~, University College,
Co~h.
IAN GPo\FIAM, Consultant Cardiologqst, The Charlemont Clinic, Dublin. G RAH AM G U DG I N, Directol, Northe~m heland Economic Re~earch. Centre. JOSEPH HARFORD, Chief Execlttive, Yamanouchi Ireland Compa~y Limited. JOHN I-IURLES; Secretary Department of Health.
KE\q N J. KELLY, Gm~tp Fi’nancial Director; A IB Group plc. * KIEI,~\N A. KENNEDY; Director of the Institute.
PAT RICK LYNC H, Chairman of the Institute, 1983-1988.
EDWARD F. McCUMISKEY, Sem’etary, Department of Social Welfare. FERGUS McGOVERN, Fo~wtm Chief Fxemttive, Telecom Eh’eann. AI~kN ~’b\TTHEWS, Dq)artment of Economics, 7)inity College Dublin. JOSEPH MORAN, Chitf Executive, l"2lectTqdty Su]zply Board.
PATRICK M ULLARKEV, Secretary, Department of Fina~zce. DONAL MURPHY, Director; Central Statistim Office.
* DONAL NE\qN, Folwtm" General Secretary, h4sh CongT"ess of Trade Unions. MAURICE O’CONNELL, Govm’not; Central Bank of h’eland.
JOYCE O’CONNOR, President, The National College of h~dust~ial Relation.s’. PATRICK O’REILLY, Chief ExecTttive, EBS BuiMing Society.
* W.G.H. QU[GLEY, Chabwtan, UIstm Bank Limited.
* NOEL SHEEI-t’~; Professor; Department ofl>s3,chology, Queen’s University of
Belfast.
MICHAEL J. SOMERS, Chief Exemttiw;, National 7)’r;asury Management
Ageng’.
T.K. WHITAKER, President of the h~stitute 1971-196’7.
* PADIL’klC A. WHITE, Director; Dresdnm" Inter’national Finance plc.
DRINKING AMONG
POST-PRIMARY SCHOOL PU PILS
Copies of this paptn" may be obtained fi’om The Economic and Social Research Instil,re
(Limited Company No. 18269). Regqst~n’ed Office: 4 Burlington Road, Dublin 4.
Price IR£12.00
I)r Mark Morgan is a Lecturer ill Eclucation and Psycholog), al St. Palrick’s College, Dublin. I)r Joel W. Gt-ube is a Senior Research Scientist with Ihe
Prevention Research Center, Berkeley, Calilornia. Iqe was a Senior Research Officer with The Economic and Social Research Institute during 1981/85. The paper has been accepted for publication by the Institute which is not resl~onsible for either the content or the views expressed
DRINKING AMONG
POST-PRIMAR Y SCHOOL PUPILS
© THE ECONOMIC AND SOCIAL RESEARCH INSTITUTE DUBLIN, 1994
ISBN 0 7070 0152 8
Acknowledgements
Since this pul)lication has come about as a resuh of tile collaboration of three institutions spanning six thousand miles, a great debl of gratitude
is owing to several people.
At the ESR[, we are indebted to Phil Browne for her outstanding contribution to this project and indeed to all our reports. We are also grateful to Tony Fahey, Christopher Whelan and Kieran Kennedy For comments on earlier drafts. Thanks are due Io Brendan Whelan, Maura Cagney and the stafl’of tile Survey Unit for their management of tile field operation and For the coding and preparation of the dala. We owe ;i debt of gratitude to tMary tMcEIhone for editorial assistance and to Pat Hopkins lbr helping with printing the questionnaires as well as to.John Rouglmn for assisting in tile planning of the project. Thanks are due to personnel fi’om the Department of Health (Heahh Promotion Unit), tile Office of tile Revenue Commissioners, Otfinness Ireland, and h’ish Distillers its well as tile external referee tbr valual)le commenl.s.
The first author would like to acknowledge the Stl])])Ol’l O[" St. Pat|’ick’s College, especially the Educational Research Centre. At a personal level, a special acknowledgement is due to Nancy Morgan few her support over the last two decades as well as to l~thryn, Rachel and Marc for their insightftd comments on this [ifea.
The second attthor acknowledges tile stipport of the ])l’eventiotl Research Center, Berkeley, and especially Patricia Madden, Meng-linn Chen, and Bettina Friese who worked hard developing instrunlent.s, co-ordinating data collection in tile US as well as numerous other tasks. A special thanks to Kathy Kearney Ibr professional advice and personal support over all tile years.
CONTENTS
A chnowledgements General Summary
Page iv xi
INTRODUCTION AND OVERVIEW The ESRI 198’1-85 Substance Use Survey The 1991-1993 Longitudinal Sludy ot: Drinking
Among American ancl h’ish Aclolescents Organisation of this Report
I 3 3
PRI~.\:AI.ENCI~ OF DRINKING AMONG
YOUNG PEOPLE AND ASSOCIATEI) FACTORS 5
Measures and Chlssification 5
Prevalence of Drinking 6
Factors Affecting Alcohol Use by Youth I ’I
Summary and Conclusions 21
METHODOLOGY 23
Pilot Studies 23
Samples 23
Survey Instrument 27
Pavenlal Permission 29
Su r vey Ad ministration 29
Issues of Reliability 30
Issues of V;didity ,’41
I)REVALENCE AND TRENDS IN ALCOHOl. CONSUMH’ION
Prevalence of Drinking
P, ackground Characteristics and Ddnking
Sunanaary and Conclttsions
2
Chapl~" 5
6
7
DRINKING AMONG I~OST-PRIMARY SCI-IOOI., PUPILS
NORMATIVE INFLUENCES AND BELIEFS ABOUT CONSEQUENCES: A UNIV’ARIATE AND
M U LTD/ARIATE ANALYSIS
Univariate AJaalysis
Normative Inl]uences
Perceived Parental ;rod Peer Approval Exlgectancy-Vahm Beliefs
Problem Behaviour
Conclusion of Univariate Analyses
Multivariate Analyses
Commonality Analysis of Domains of Predictors Moderating Influences of Age: Frequency of Drinking Moderating Influences of Age: Quantity Consumed
Peer Influences Access
Conclusion of Multivariate Analysis
INCREASE IN DRINKING PREVALENCE: AN EXAMINATION OF SOME HYPOTHESES
Summary and Conclusions
CONCLUSIONS AND RECOMMENDATIONS FOR
PREVENTION
Education for a Changing World Alcohol Control Policies
Recent Developments in Alcohol Educalion Substance Abuse Prevention Progrmnnm
Potential for Mass Media/Community Interventions Green Paper Proposals
Page 49 49 49 51 54 56 59 60 60 61 64 66 68 71 72 88 89 90 90 92 96 97 100 t~ef ey~llces
Appendix A: FACTOR ANALYSIS OF I?,ELIEFS,
NI-FITUDES AND VALUES
Appendix I1". QUESTIONNAI RE
108 Ill
7hble
3.1
4.1
4.2 4.3
4.,I
4.5 4.6
4.7 4.8
4.9
4.10
4.11 4.12
5.1 5.2
5.3
LI.$7" OF 7"4 BLES
Page
Conlparison Between h’ish and h’ish-Anlerican
Adolescents 25
Lifetime Prewdence o1: Drinking 32
Prevalence Rales for Specific Alcoholic Beverages 34
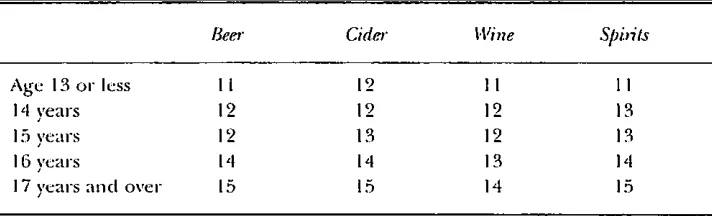
Median Age of First Consumption of Various Drinks 35 Frequency of Having Felt l)runk l)uring Previous Year 36
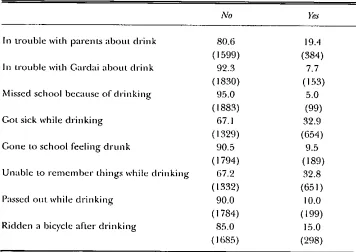
Numbers Experiencing Consequences of Alcohol Misuse 38
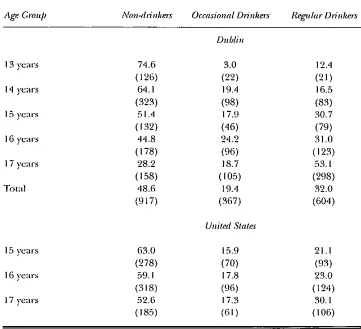
Current Drinking by Age Group 39
Lifetime Drinking Prevalence For Males and Females 40
Frequency of Having Feh Drunk During Previous Year
by Age and Gencler 42
l..iliztime Prevalence Rates Ibr Specific Alcoholic
Beverages by Gender 43
Current Drinking b)’ Age and Gender ,I,I
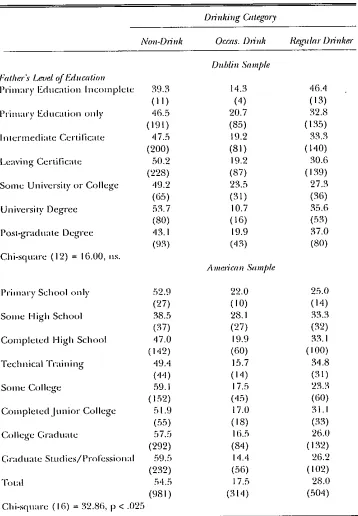
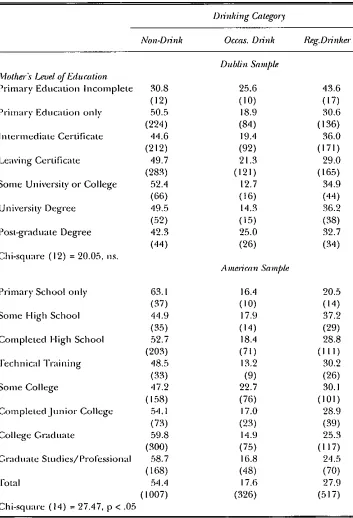
Current Drinking b)’ Father’s Level of Education 45 Current Drinking by Mother’s Level of Eclucation 47
Current Drinking by Perceived Parental Drinking 49
Current Drinking by Perceived Peer Drinking 50
Current Drinking I)), Perceived Parental Approval 52
Table
5.’t 5.5
5.6
5.7 5.8 5.9 5.10
5.11
5.12
5.13
5.14
5.15 5.16
5.17 5.18
DRINKING AMONG Pos’r-PRIMARYSCHOOL PUPILS
Page
Current Drinking by Perceived Peer Approval 53
Mean Rating of Drinkers and Non-drinkers in Perceived
Likelihood of Consequences of Drinking 5,1
Mean Rating of Drinkers and Non-drinkers on Likelihood
of Consequences of Drinking 55
Problem Behaviour aim Drinking 56
Sell=Image ;and Drinking Category n/
Bonding to Religion anti Drinking Behaviour 59
Total Association an Unique Contribution of Each
Categor)’ of Predictors at Each Age 62
Correlations of Influences with Drinking Frequency
at Each Age 63
Interaction of Age and Influences Relating to
Frequency of l)rinking 64
Correlations of hlfluences with Quantit), Consunled
at Each Age 65
Interaction of Age and lnlluences Relating to Quantity
Consumed on An)’ Occasion 65
Correlations Between Peer Influences and Drinking 67 Increment in Prediction of Specific Peer hlfluences Over
Other Peer hlfiuences 68
Perceived Access and Drinking 69
lncrenlent in Prediction of Perceived Access Over
Social Influence Factors 70
7hb&
6.1 6.2 6.3 6.4 6.5 6.6
6.7
6.8
6.9 6.10
Page
IAfetime Prevalence of Illegal Drugs 75
Current Prevalence of Illegal Drugs 75
Lifetime Smoking Rales by Age in 198’1 and 1991 77
Current Smoking in 1984 and 1991 77
I:’requency of Problena l?,elaaviours in 198,1 and 1991 79
I:)arenl:d and F’eer Disapl.woval of l)rinking in 198’:1
and 1991 80
Perceived Drinking of P;arellLS and Peers in 1984
and 1.991 82
Perception of Likelih()od of Consequences of Drinking
in 198,t and 1991 83
Perceived Ease of Access to Alcoholic Drinks 85
GIi’NFRAL SUMMARY
Previous Research
While nearly all countries have minimtnn drinking ages (either 16, ]8 oz" 21 years) Ibr consumption of alcohol, the vast majority of young people in every country experiment with alcohol long I)efore they reach the legal age limit. On the basis of earlier work, it seemecl that rates of prevalence of drinking among hish youth were I)etween those of high consuml)tion countries (like France) and low consumption countries (like Israel). This earlier work had also suggested that there was a sizeable minority of young hish people who were total abstainers, and given that a great many of those who ch-ank have been drunk at least once, the prol)lem in h’eland was as much the pattern of drinking as opposed to actual numl)ers who drink. There were also indications that the age at which young people I)egin to drink had clecreased somewhat over the last few years. Finally, there was no inclication that any one drink is especially popular with young people as opposccl to adults.
The Present Study
Since the i)rincipal source of inlbrmation on underage drinking and other substance use has been the ESRI 1984 survey cztrriecl out I)y the autlaors, the i)resent work sought to extend tiffs in a number of respects. A major interest was in finding out what changes, if any had occurrecl since then in the prevalence ancl pattern of clrinking behaviour. In acldition, a number of additional asl)ecls of I:aclors associatecl with alcohol use were aclded, particularly matters relating to access and location of drinking. Also, a sample of nearly 2,000 young l)eople in High School in California was surveyed at the same time. Information was sought on ethnic origin anti religion in this sample so that comparison could be made across countries.
The schools selected from the Dul)lin area were the same as those in the 1984-85 ESRI survey. Tim Californian saml)le consisted of eight i)ul)lic and three parochial schools in three counties in the San Francisco Bay area. An examination of details of the age, gender and social background suggested that the samples were representative of young people of this age
in post-i)rimary schools.
The survey instrument was designed to measure a wide range of varial)les relating to clrinking. Inch<led were measures of age of first
xii I)RINKING AMONC; Pos’r-PRIMARY SCHOOl. PUI’II.S
drinking, frequency of drinking during tile past year, t),pe of beverage consumecl, frecluency of having t~:11 drunk, as well as perceptions of consequences that follow drinking. In addition, 01et’e was a range of questions on normative beliefs, ease of access Io various kinds of drinks as well as items designed to measure self-esteem, deviant I~elmviour and bonding to school and religion.
In the Dublin sample, onl)’ two children were omitted because of parental refusal. The questionnaire was aclministered in students’ regular classroom settings, and students were assured of conlidenlialit), and anonymity.
Prtma&~zce of Drip,king,"
Nearly Ibur-Iifths of the students in post-primar), schools in r)ublin had consumed alcohol at some tinle in their lives. This is a very substantial increase since 1984, particularly among 17 year olds and over. The number of)’oung people who do not drink betbre age 18 (eviden| even in 1984) has declinecl precipitously.
There are also striking increases in the nunaber of drinks consumed on ;m), given occ;~sion and an even greater il’icrease in lhe number who reported gelting drunk. For example, in 1984, 38.7 per cent of the studenLs reported being drunk al some time in their lives, while the present tigurcs show that half of the students had felt drunk during the previous year. FtH’lhernlore, Ihere are increases .7it ever), age grotl]] and especially at the high levels of fi’equene), of having felt drunk. Thus, in 198’t, less than 29 per cent of the 17 year olcls said that the), been drunk six times or more. In the presen! study, 44 per cent said that the)’ had been oh’trek Ihis frecltientl),.
ha comparison to an American sample, Ille level ofclrinking was higher among the Dublin sample with regard to ever), measure of drinking that was usecl. This p;illern represents a striking reversal of what obtained until a decacle ago. An h’ish-Anterican subsample tended to be mid-way between the l)ublin silmple and the remaining American sample, on most of the ine~lStll-eS of fl-eC[%lellcy ~llld consumption.
GENEtb\I. SUMMARY xiii
Consislcnt wil.h i.I1(2 earlier findings, Ihere was no nssociat.ion between socio-cconomic I~,lcIot’s lind the drinking of their ol’l~pring among the
Dtd)lin s:tmple. These findin~’s arc consistenl wifll the i~rcl)onclcrance of
research showing the relative tmimporlance of such factors for drinking and indeed lot other kinds of siibsl;ltact~ ilse.
I’,fluena:s on Drinki~g
The normative intluences on respondents’ drinking were shown to be quite slrong. BoHa parcmal drinking and perceived parental approval were related to reporled current drinking. Similarly, peer drinking and peer a[:)l)roval were shown LO bI2 ~lssoci~lled wil.h alcohol Constlnll)l.ion. Ftwlhez’morc, this relal.ionshil) was CSl)Ccially u’tl(: for clos,c friends as opposed to other friends or ),otmg people oF Ihc same age.
As i’cg;ll’ds beliefs ;IbOlll conseqnences, I.hel’t: was a significanl
association bcuvecn drinking and bclicl~ in the likelihood of consequences rt~lated to drinking. This wz~s true Ibr both positive const:(:lUCnC(:s (e.g.,. "being popular with friends" ;md "having a good time") as well as negative consequences (e.g., "getting a hangover" and "becoming an alcoholic"). There w~ls also an associalion wifi~ cv~dtl;ll.iot/ Of (h+dsc consequences, that is thc perception oF the importance of each of these consequences, but this associaliOn was Hot as COllSlstcnl as the I)CFCCpliOn of I.h(: likelihood of lhese same Consequences.
h was :llso shown thai bonding Io religion w:ls I’t:lalt:d IO Clll’FOnl drinking, l-lowcvcb onl), some aspects of sellZestcem were related I.o drinking. In iht: c:lsc ot:l)roblclll bch:lvioiir, il seemed Ih~+lt while there were signit]cant differences for all i)roblem behavioulq the grealest differences were tbtmd Ibr I)chaviour oFa rclallvcl), less scricms type. Thus, Ihez’c were m:~jor differences for "lying to parents and teachers" as well as "cutting classes". On the other hand, belmviour like vandalism (ah.hongh being statistically difl~rent :~cross drinking categories) did not show dil]+crenccs of the same magnitude, possibly due to the Fact th:tt these arc low-frequency I)chaviomz
The nmltiwH’iatc an:dysis oF inlluences suggested that while various domains of inlluence :ire relaled to the Prediction ol’adolcsccnl, drinking,
xiv DRINKING AMONG POST-PRIMARY SCHOOL PUPILS
drinking. When other factors are controlled the effect of perceived access is much weaker, I)ut it still has significant effects. Adolescents who perceive alcohol as easier to obtain, drink more fi’equently and consume greater al’llOtlllLS per occasion.
Fxplanations of Increases in Drinking
Given that tile main outcome of tile present study was quite unexpected, tile prol)lems in explaining these are all the more difficult.
Our general strateg3, in attenapting to account for the increase ill
prevalence rates was to consider a number of hypotheses for which some data were awdlal)[e either in the present study or fi’om some other source. In general, we have simply tried to eliminate some of the possibilities and say whether the data are more or less consistent with various explanations. ~q~ile the account we have given of the increase is not fully satisfactory nevertheless we can eliminate some explanations, while for other the data offer some support.
Is the increase due to a greater per capita consumption of alcohol in tile country? One reason for tile dramatic increase in alcohol consun~ption in tile country would be that there was a great increase in drinking in the overall consumption in the country, i.e., among adults. Howevel, there is no indication fi’om the information on per capita consumption that such an increase took place (Conniffe and McCoy, 1993).
Is the increase part of a greater increase in stlbslance use I)%, young While it may be the case that there was no major increase in alcohol consumption in the country, there nlay have I)een an increase in tile use of other substances by young people. This might be tile case especially for illegal sul)stances and for cigarettes. Tile evidence from the present research does not support such a contention. For one thing, there was evidence of a small but consistent decline over all age groups ill the uptake of cigarette smoking. In addition, the numbers who indicated that they were smoking regularly had dropped somewhat.
The picture aboltl the use of illegal substances is somewhat less clear. The major point emerging fi’om the comparison of the two surveys was that
there was an increase in the number of young people who used marijuana. However, some featul’es of tile results suggest that this was not a factor ill I)ringing about the greater increase in drinking. First, tile median age for
tile beginning use of mar!juana was 15 years while the corresponding age tbr alcohol was lower than this.
GENERAL SUMMARY xv
HOW inlportant are normative itlfluellces like disapproval of parents and .peers? Over the years since tile first survey there wotlld seem to have been a major change in nornlative support for adolescent drinking. What is particularly of interest is that the percentage of parents and peers who are perceived as strongly disapproving has dropped during this time. In relative terrns the change for peers was sonlewhat nlore dramatic than for parents. In fact, there was a drop of about one-third in the nunlber of "best friends" and "fi’iends" who were perceived as strongly disapproving of drinkir~g by the respondents in this survey. Thus, the conclusion seems warranted that the change in normative support over the years is likely to
have been one of the factors that influenced the increase in drinking.
What was the effect of changing beliefs about consequences? Another faclor that may have had an influence on tile changing pattern of consumption were the changes that may have occurred ill the beliefs that young people hekl regarding the consequences that may happen to them
personally as a result of clrinking excessively. There was evidence for fairly dramatic changes in relation to such beliefs. Specifically, there were major declines in the numbers who thought that negative consequences would occur to them as a result of drinking. Similarly, students were now nlore likely to believe that "positive" consequences would occur to thenl like "feeling good". As in the case of normative influences, the changes in beliefs about consequences seem to have been an important factor in tile pattern of underage drinking.
How important was perceived availability of alcohol? While the earlier survey had not included items on perceived access to alcohol, the information fi’om the present work gives an interesting picture of awtilability. In an absolute sense it would seem that many of the young people thought that they could get alcohol without too much difficulty. However, it was also true that the Anlericml group indicated for them that it would be even easier to obtain alcohol. "[’he other complicating factor is that the outlek~ for obtaining alcohol were many and varied as were the locations for its consumption. This pattern suggests that when particular avenues of access are closed ofF, then others will be used. V~qlile tile role (if an),) played by greater perceived access is hard to pinpoint, the data suggest that it !nay be one of many factors.
Implications for Prevention
DRINKING AMONG I~OST-I’RIMARY SCHOOl- PUIqLS
a con/nluniL)’ and farnil), base as well as dimensions targeting the suppl), of alcohol, it was suggested tlmt 11ew school initiatives could pla)’ an important role in preventing the onset of early clrinking and/or ch’inking i)roblems. Sollle oF Ihc i’cccnt and l’t~ledvalll, l’est~ql’ch Ol1 the various school n~odels were examined. It. was concluded that there was some merit in each of the approaches.
Chal)ter I
h\:TI{ODUCTIOAI AND OVER VIEW
Misuse of alcohol has important social and personal consequences. Tll(:rc is a considerable an/oHnt oF evidence Hilt drinking is involved in a great Ill[Uly automobile accidcnls, hi [’;imily violence and in youlhl-tll Cl’inlC.
While it is dill/cult to quanlify thc exacI contribution oF alcohol illiSllSrg [O C[|l" Cl’;JS]l{~S, it is ’WOl’t]l noting that there is a relatively greater number of [hlal accideriLs during the hours associated with drinking (9.00 p.m. - 2.00 it.Ill). All awal’ellCSS O1" th]s pl’oblelll h;Jd prompte(I a s(:ries of mc:lsllrcs to deter drunken driving, l,argely because oF tim inu’oduction oF objective I11casurcs oJ" drinking (I)lood and tlrhlc tests), tlic prosecutions and convictions lot drunken clriving rose sharply during the 1980s. The niunb(:r o£ prosecutions doubled during the 1980s, while the number o1" conviclions trebled (GSrcla Sioch:ma, 1990). There are also Ill’ill indicauons thai alcohol misuse is a significant conuibutory fimmr in a large proportion of aduh pedestrian acciclcms (Clark, 19"71; Clayton, Booth and McCarthy, 1977).
There is also evidence that excessive alcohol intake is a contributory fitctor hi a great many incidents oF donl(:StiC violence. Again, the precise nature o[ I.I1(: rclationsllip is hard m sp(:cit~,. A study of a sanlple of incidents of domestic violence suggesled that alcohol was a I’HCtOl" in over 70 per cem of flmsc incidents (Morgan and Filzgeral¢l, 1992).
While dmre is only limited evidence on the association between youthful alcohol consumption and similar negative conseqtmnc(:s, the international literature pllOvldcs evidence relating Io tim association between excessive drinking :ind yoIHhful Cl’]lllC, being ;i victim of a crime,
2 DRINKING AMONG POST-I’RIMARYSCHOOI. PUPIl.S
The ESIU 1984-85 &tbstance Use SuT-v9,
Ill 198’t., the ESRI, with funding fi’om the Commission of the European Communities, undertook a study of the social psychological factors related to sul)stance use among Dublin post-primary schools. There were two main objectives of this study. First, it was intended to ol)tain estimates of the prevalence of smoking, drinking and other drug use. Secondly, it was intended to gain an understanding of the variables and processes related to the acqtfisition and maintenance of these behaviours.
The sample consisted of 24 randomly selected schools in the greater Dul)lin area. There were almost 3,000 students in the survey which was carried oul in the three phases I)etween April 1984 and May 1985. The
main findings of the survey were published in uvo ESRI reports, Smoking,
Dt~nhing and Other Drug Use Among Dubli’n Post-15~ma~y School Pupils, by
Grube and Morgan (1986) and The Development and Maintenance of Smoking,
D~4nhing a’nd Other Drug Use, by the same authors (1990). These reports
focused on tile prevalence rates and on tile factors associated with initiation to, anti maintenance of, sul)stanee use.
:Ls regards alcohol use, the survey showed that almost two-thirds of the students had consumed an alcoholic beverage at some time in their lives,
nearly half had done so within the previous month anti over one-third were regular drinkers. Furthermore, about two-thirds of those who ever drank ]lad been drunk at least once. These results indicated that ill coInpal’iSOll with other countries, there was a relatively higher percentage of lifetime abstainers in that sample. However, tile number of current drinkers is
between the rates for high consumption countries and those for low consumption counu’ies.
This research also showed that drinking among adolescents, while heavier among males, was relatively independent ofsocio-economie factors. There was a moderately strong relationshiI) between parental drinking and reported drinking and a mucla stronger relationship with peer drinking. Perceived parental disal)proval was modestly related to drinking, and peer disal)proval was somewhat more strongly related Io such I)ehaviour.
Students who drank were more likely to believe thai such behaviour was more likely to lead to positive personal consequences and less likely to lead to negative personal consequences. Drinkers also valued tile positive consequences of these I)ehaviours more than did other students and daey also raled the negative consequences less. A related finding was that there was an association I)etween attitude (or overall evaluation of drinkilag) and
INTRODUCTION ANI) OVERVIEW .’4
Bonding to family was related to lower ~llnOUil[.S o1: drinking, and studenLs who rated school as iml)ortant and indicated a commitment Io doing well were also less likely to be regular drinkers. Furthermore, I)onding to religion was associated with lower rates of substance use. In line with previous studies, it was shown that young people who drink hacl I)een invoh,ed in a range of other problena behaviours including lying, having clamaged prol)erly, anti stealing.
The 1991-1993 Longitudi~al Sturdy of DHnking Amo~g Amm~ca’, and IHsh Adolescetzls
The present rel)ort draws on the first phase of the results of a Iongittlclinal stucly of drinking and other sul)stance use among a sample of Irish and American youth. This stud); which is descril)ed in detail in Chapter 3, is concerned with broad questions about the factors associated with influences on drinking. From Ihe l)Oilal of view of the present report, it is of i)articular significance I.hat I.he Irish coral)orient of the survey was carried out in the same schools as I.he ] 98,t survey. Given th;tl, a great man)’ items were the same, the resuhs allowed for an ex[|nlin[ition of SeVel’~II questions rela0ng to changes in drinking pattcrHs aHiong young people over the years.
Thus, the comparison with the prevalence tales tor 198’t as well as a comparison with the same-age American adolescents comprises the main features oF the present report. In addition, a number of additional qtlestiolls are ex~lminc(l: ~’VII~IL ~lccotlnts [o1" Ihe ch:lnges Ih~ll have occm’red in drinking patterns anlong aclolescents since 1984? Whal is the relat.iollshiI) between i)erceived access to alcohol and drinking bchaviour? How do influences change over the years of adolescence (early vs. later years)? Howclo peers intluellcc drinking, andwhich group of the variotls reference groups are esl)ecially important?
Orga~fisation of this I{eport
The remainder of this report is concerned with descril)ing the background and resuhs oFa survey which (i) compares drinking I)¢haviours among post-primary studer~ts wiLh those of students h-ore the same schools, meastwed seven years earlier, (ii) examilles the I~aCtOl’S associated with alcohol use, especially the changes that have occurred in patterns of drinking and (iii) coral)ares results with an American sample of High-School students, inch~ding a subsample of h’ish Americans.
4 DRINKING AMONG POS’I’-PRIMARY SCHOOI~ PUPII~%
Chaplet 2
I’I¢I:’VAIf-NCF OF DlCh\q(hVG AMONG VOUNG PEOPId-AND AS:~’OCL’VI’I~I) FACTOI?S
The present chapter will examine the prewdence of drinking by h’ish youth as evldcnt hi earlier sl.ucli,ds. The issue of how prevalence is measured is first considered ~’llld COllll)arisoIlS ;.ll’C nlade between estimales of youthful drinking emerging from Irish studies and Ihose fi’om sludies in the United
Kingdom, other EU countries as well as from the United States and Canada. The relationship belween Ihe estimates emerging [’l-oln SLII’VCyS Of youthful drinking and those from other sources (estimates of national consumption) is also examined.
This chapter will also focus Ol/ the ]ileriltUl’e Oll ~t variety of faclors associated with drinking among young people. These will include demographic factors, with parl.icu]ar attention to gender and social background iniluences as well as the findings relating to social influences, including parental and peer inlluences. The el:fects ol:a variety of other influences including attitude, beliefs about consequences, aspects of pevsonaliLv and perceived availabiliW are also considered.
Mea.~ltres and Cla.~sification
Because the many studies in this area have used different questions, samples, aud ages, il is often difficuh to make firm judgements as to whether a problenl of drinking among youth is more serious or less so in one C0111111"y or I.inle, :is opposed to anothel’. In particular, many sl.udics fail Io provide vilal inlbrmation on question wording and on the age-structure ol: the sample, thus making comparisons problematic.
"[’hel’e are a i][llllber of con]nlol]ly used nleasures [h;.[[ pl-o’¢ide
worthwhile guidelines in making such comparisons. The []I’sl o1: these is
lifetimepr~nJalencemte, i.e., the percentage ofyoung people who have ever had
a drink. This relatively simple measure is one of the best indicators of trends and has the aclvttnlage of being strongly related to ol.her measures
(]ohllslon, O’Malley and Baclaman, 1990).
The second valuable indicator is currmzl prevalence rate, i.E., 1he percentage who have had :l drink wilhin an interval specitied in Ihe survey
(usually oue month). ’,’early prevalence rate is also a valuable nleastJre, i.E., the numbers who have had a drink within the lasl. year. On the other hand, lypical levels of consumption (anlo’clnl.s consulned, frequency of drinking) are ¢lllile clifficllh to coral)are across Sludies.
6 DRINKING AMONG POST-PRIMARYSCHOOI. PUPILS
With regard to abuse/prol)lem drinking, the percentage who report
havingfi,dt d~’ztnk is another valuable point of comparison. As in the case of
other measures, comparisons are made easier if the time-interval is also specified, e.g., lifetime, one yeah or one month. Finally, Ilae age at which young people have their first drink (or have felt drunk) also provides a useful basis for comparison across populations. Obviously, age of beginning is especially significant in tile context of the regulation of drinking through minimum age laws.
Prtnmlence of Drinking
Ireland. One of the earliest studies was conducted in [970 by O’Rourke, et
al. (1971). This study involved a large sample of post-primary schools
students in the Dublin area. TILe results indicated that about three-quarters of the students had a drink at somelime in their lives, hi addition to this item, the O’Rourke, et al., survey enquired as to whether students were currendy drinkers. Just over half of the respondents identified tllemselves as cHrrenl drinkers and of these about one-qtl,TWtel" COllSidered lhelllSelves
to be regular drinkers.
The survey by O’Connor (1978) featured a sample of 18 to 21 year olds fi’om the Dublin area. These young people were compared with matched samples of English and Anglo-Irish living in England. Her resuhs indicated that 82 pet" cent of the Dublin sample had drunk at some time in their lives. However, her data also indicated thai there were J~’wer current drinkers in the Dublin sample and also that drinking was initiated at a much later stage among this group.
PRI’ZV±\IJ~NCE OF DRINKING AND ASSOCIATED FACTORS 7
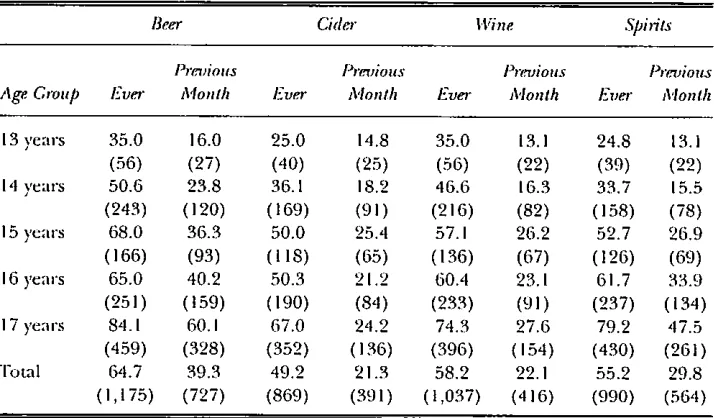
nlost i)Ol)ular, wine and spirits were somewhal, less popular and cider was considerably less popular. Interestingly, however, a sul)stantial maiorit), of those who drank had tried out more than one kind ofl)everage.
These studies also enqtfired on the fi’equency of having felt drunk. A relatively large numl)er (38.7 per cent) reported that the), had felt drunk at least once, while a minority (1’1.7 per cent) reported that they had felt drunk at least six times. Again, the fi’equenc), of reporting having felt drunk increased with age and this was especially so for those reporting having felt drunk six times or more. In fact, 28.9 per cent of the 17 )’eat"
olds fell into this latter category.
Studies by Johnson (1987) andJohnson, el aL (1990) provide extensive information on drinking in the earl), tee~a years in the G~tlway area. The resuhs of the 1990 study showed that 31.1 per cent of 13 year old boys and I 1.2 per cent of girls had drunk alcohol at some time in their lives. The corresponding percentages for age 14 years were 31.6 and 2’1.4 for boys and girls, respectively. When respondents were asked about age of first drinking, it emerged that the mean age of first drinking was 11.96 years.
Interestingly, this age is lower than in the previousJohnson stucly and lower than that found in the ESRI stucly.
As regarcls current drinking, the Johnson study showecl that ;~d)Otll 10 i)er cent of those who had ever lake~z a drit~h now drink several times a month anclT. I per cent drink ever), weekend. It also emerged that almost half of
those who had ever taken a drink have experieneecl some effect, ranging from feeling moclerately high to having memor,v losses. About one-thircl of those who ch’ank obtained the alcohol without their parents’ knowleclge anti a slightly smaller percentage bought the alcohol themselves. Another interesting feature of the results relatecl to the actual drinks that were most popular. The most i)optdar oh’ink was bder (i.e., lagen stout, ale) which was triecl out I)}, about three<lUarters of those who had ever ch’unk. Next most i)optdar was wine (al)out 40 per cent) anti spirits (roughly ’10 per cent as well). Finally, about one-quarter of those who hacl ever drunk, had triecl cider, lnterestingl},, this orcler of preference is exactly the same as that emerging in the ESRI study. Johnson (1991) also reports on a survey of 827 second ),ear students in September 1990, based on a country-wide sample of post-primary school students. Essentially, this work confirmed the picture emerging fi’om the earlier studies in Galway.
DRINKING AMONC; I’OS’I’-PRIMARVSCHOOI. PUI’IILq
(1990) fOtllld that 78 per cent had drunk alcohol at some time. Furthernlore, :d~ottt half of the Salnple reported feeling drunk on at least one occltsion.
Northern h’eland is different from many other cotmtries in that a signific~un minority of adults do not drink alcohol at all. For example, in 1986, one-third of the adults in Northern IrelaHd were total abstainers. kloweve~, there are inclic~ttions that dais minority is I)ecoming smaller. The study by Sweeney, Gillan and Orr (1989) found tirol nearly 70 per cent of the population drink fl-om time to time. These researchers also found that the likelihood of being a drinker decreased with age. While +tl)ottt 80 per cent of those under 30 years were drinkers, only half of those over 65 indicated Ih.qt they drink, hlterestingl)’, Catholics and Protestants were abotll equally likely to be drinkers or abstainers. Two relatively recet+t studies give ;t comprehensive pictnre of itdolescent drinking in Northern h’eland. The DHSS report on Dri++hing Amo*+g School Ih+[)il.+ i+z AtorthmP~
Ireland (1989) was conducted in a sample of rural anti urban areas
throughotlt Northern Ireland, while a study by MeAteer (1991) focused on the n:tture of drinking anlong 19 IO 17 yeltr olds in Bclf~tst. The DHSS study reports i~ lifetime prevalence t’ztte of 60 per cent while the MeAteer st.ttcly found a 19t-evalence rztte of 137.5 per cent. As mighl be expected, there wits a strong +Lssoeiation beu~,een age and drinking prevalence. The I)HSS study was bTised on a randoln silfnl)le of the Sttldents all over the provillee, while Ihe MeALeer study is I)~tse£1 on il sample froth West l?,ellast. This m:ty
lye the main reason (itl:):4rt from question wording) why the previdelaee rittes are higher in McAl.eer’s work.
The DI-ISS study ill Northern Ireland was sinfilar in design and phrasing to those carried out in England, Wales and Scotland. A comparison with other parLs of Great Britain suggests that young people in Northern Ireland were less likely to have tasted alcohol. I-Iowevel, it also emerged that when the), do drink they are more likely than their cotmterp;trts in Great Britain to be frequent drinkers, h is noteworthy that there is still a significant minority of ),oung people in N<-wthern Ireland who have never had a tidl drink of alcohol. The question on lifetime prevztlence is somewhat difli:rent to that used in earlier studies cited above (it refers to ever hztving a "proper drink of alcohol"). If th:~t can be taken as being equiv+dent to a full drink of an alcoholic bever;tge, then the conclusion is warranted that 16 per cent of the boys at age 17 ),ears and 26 per cen l of the girls have never had a litll drink. This would suggest that Northern
PI/EVAI.I!~NC.F. OF DP, INKINC AND ASSOCIATI’D I:AC’, I’ORS 9
indeed with the Republic of Irehmd where Ibis minorily is declining. The Belfasl sludy also enquired about sources for alcohol. The respondems were given a list o1" sources and asked to state iF they bought alcohol [l’Olll thelll "alwa)’s", "ol’len", "sometimes", or "l’lever". It enlerged
that the m~ljorily o1" the adolescenls bought alcohol fi’om ofl-licences. In I’acl, one-lhird of the overall sample and one-third of current drinkers said thai they always boughl alcohol from off-licences. In conmlsl, only 3 per cenl of the sample said they I~ought alcohol in a pub.
Both Northern h’eland sludies enquired abou! clmice of drinks. Overall, beer tended to be most populm, li~llowed by eider and spirits.
Wine lenclecl to be less fl’equently collsunmcl. The DHSS study touncl Ihat spirit drinking among gMs in Northern h’eland was at a nmch higher level
than among yolmg people of bolh sexes in I[.ngland, Scotl;md and Wales. The McAteer and the I)HSS sludies i)rovide iIlformalIiOll oil llsual location for drinking. A i)ublic place (e.g., street or park) was the most li~voured location, with nearly hall" of Ihe regular drinkers sa),ing that the}, drink Ihere "always" or "often". There was also a tendenc), ti:)r younger drinkers Io selecl "public place" as their mosl favoured venue, while the 16 and 17 year olds tended Io select olher localions. Inmrestingly, Ihe least
likely place was "at home" or at "home of relatives". Thus, it was clear Ihat tile inilial socialisation to alcohol took place outside parental or aduh controls. It is interesting that these studies have found that in comparison
Io similar questions put to young people ill England, Scotland and Wales, tile Norlhern h’elancl adolescents were mttch naol’c likely Io inclicate Ihal Ihe), drank in locations away From parenlal (or aduh) controls such as in parks and derelict buildings.
l0 DRINKING AMONG I’OS’I:I’RIMfiRYSCHOOI~ I’UI’ILq
Great Britain. The study by Marsh, Dol)l)s and White (1987) was aimed at providing national estimates in Great Britain on the numbers of young people aged 13 to 17 years who drink alcohol, how much they drink, and some of tim circumstances oF their drinking. The resuhs showed that in England and Wales over 80 per cent of 13 year olcl boys and 75 per cent of
13 year old girls have had a drink at some time in their lives. These figures increase to 88 and 87 per cent for boys and girls, respectively, at 14 years of age. At age 15 years, 92 per cent of the boys and 91 per cent of the girls have had an alcoholic drink.
In Scotland the pattern is somewhat different. It seems that Scottish adolescents start drinking laI.cr than do their i)eers in l~ngland and Wales. At age 13 years, 71 per cent of the Scottish boys and 57 per cenl of the Scottish girls have drunk alcohol. By age 14 years the difference l)etween Scotland and the rest of Britain is significantly less: 87 per cent of the boys and 79 per cent of the girls had drunk alcohol. By age 15 the corresponding percentages were 91 and 88 for boys and girls, respectively. Interestingly, a minority of Scottish young people at age 16 and 17 remain Iol:ll absl:lilaers.
The second World Health Organisation (WHO) study (Mendoza, et aL, 1991) reports somewhat higher figures for Scodand and Wales. This latter study indicated that 93 per cent of Welsh boys and 95 per cent of Welsh girls had tried an alcoholic drink at age 13 years, while among 15 year olds the corresponding percentages were 98 and 97 for boys and girls, respectively. This same study reports figures of 90 and 87 per cent for Scottish boys and girls respectively at age 13, and 97 and 98 per cent, respectively, at age 15 years. These figures al’c IDtlCh higher than those reported in the Marsh, el aL, study and may reflect the particular question that was posed. The WHO
study seems to have asked i[" the respondenks had "tried" alcohol. Such a question would allow st.udenks who had a tiny sip to answer in the affirmative, thus increasing the numbers substantially. Most other sludies have specifically excluded a "tasle" or a "sip" and have only inchlded those who have drunk a full drink of alcohol.
The survey by Marsh, et aL, was also concerned with current drinking. Again, the fl’equency of drinking increased sharl)ly as they grew olclm: In England and Wales, over half of the 13 year olds ruho ~Jer dra~*h, drank only
a few times in the ),eat’: 50 per cent of the boys and 63 per cent of the girls
PREVAI.ENCE OF I)RINKING AND ASSOCIATEI) FA(_TI’ORS I I
ever drank) and I I per cent of tile girls said tile), ch’ank at least every week. At age 14. Ihe girls had caught up somewhat, with 24 per cet’lt of them drinking weekly compared to 34 per cenl of the boys. At age 17, drinking at least weekly seemed to be ahnost the norm: 5,1 per cent of the girls and
61 per cent of the boys tended to drink weekly. Finall)q 9 per cent of the 17 year old boys al-e drinking ahnost every clay (in the England and Wales sample).
The survey by Marsh, el aL, provides information on regular drinking in Scotland, England and Wales. The resulLs indicatetl that tim Scottish youngsters drink less than do their peers in England and Wales. Thus, among 13 year oltls in Scotland, 14 per cent of the boys and 7 per eenl of the girls drink weekly compared to 9-9 per cent and I I per cent in England and Wales. Among the 17 year olds the gap is just as wide: ,17 per cent of the boys :.llld 36 per cent of the girls drink weekly in Scotland compared with 61 per cent and 5,1 per cent in Fmgland and Wales.
About two-thircls of the Marsh, et al., sample reported that they had fch a "little drunk" at least once tluring the past year (England, Sco0and anti Wales combined). A smaller number reporled having felt "very clrunk", but about half of the oldest boys fell into this category. Interestingly girls I’epOl’l. incidents oF drunkenness that were only a little less I’requent than 0aose reported by boys. [furthermore, a coi/lp:ll’ison oFthe figm’es reporled by Marsh, el al., with those reported by Hawker (1978) suggesls that the picture in the mid-1980s was very similar to 01at obtaining 10 years earlim: Mainland Europe. The first World Health Organlsation collaborative study (Aaro, et aL, 198’t) provides lifetime and monthly prevalence rates for adolescenls aged I 1.5, 13.5 and 15.5 years in Auslria, Irinland and Norwa)< Among the Austrian sample, 6,1 per cent, 83 per cent :.rod 93 per cent had dnmk sometime at each oF tile sampled ages. The corresponding monthly figures were 10 per cent, 20 per cent and 94 per cent, respectively. In Finland the lifetime rates were 35 per cenl, 54 per cent and 74 per eenl Ibr the 11.5, 13.5 and 15.5 yearolds, respeclively. For monthly prevalence, the Finnish adolesceuls repot-led tales of 6 per cenl, 16 per cent and 3_9 per cent at the 0tree age-groul)s. Finally, in Not’way 48 per cent of tim 13.5 year olds and 75 per cent o1" the 15 year olds had n’ied an alcoholic drink at some stage in their lives :rod 19 per cent and 37 per cent, respectively, had drunk wilhin the past 111011111. (No ligures are available Ibr the 11.5 year-old Norwegian saml)le.)
DRINKING AMONG I’OS’I’-PRIMARY SCI-IOOI. PUIqI.S
country. There were considerable differences belween tile countries. In Belgium, 89 per cent of boys and 87 per cent of girls reported having tried alcohol al age I I years, while at age 13 tile percentages were 90 and 92 per cent for boys and girls. Among the Belgian 15 year olds, the percentages were 91 and 94 per cent for boys and girls, respectively.
The figures Ibr Spain are slightly lower on ~werage, according to the WHO study. Among the I I ),ear olds, Ihe lifetime rates were 78 per cent and 67 per cent for boys and girls, respectively, while the corresponding figures tot 13 ye~u- olds wcre 91 and 87 per cent. No figures were given for Ihe Spanish 15 ),car olds. As regards I-hmgar),, complete inlbrmation is provided Ibr each sample of both boys and girls. At age I I, 61 per cent of boys and 5:3 per cent ofgirls had tried alcohol, while at 13 years, 82 per cent of both boys and girls had tried out :1 drink. By agc 15 ),ears, the lilt:time prevalence rates were 93 and 94 per cem for bo),s and girls, respectivel),.
Just over 82 per cent of Israeli boys ;rod 66 per cent of Isl~eli girls had tried alcohol at age I I ),ears. B), age 13 the corresponding pcrccntagcs were 84 and 7B, respectivel)q while among thc 15 ),ear olds, 93 per cent of boys and 86 per cent of girls hacl sampled alcohol. The figures for Sweden are somewhat lower, especially at the younger ages. For I I ),eat" olds, just over 66 per ccm of tile boys and nearly 51 per cem of tlae girls had tried alcohol, while ;lt age I.’4 years, the corresponding figures were 79 and 75 per cent for boys :rod girls, respectively. At age 15 re;u-s, the figures indicated that 92 per celat O1: bolh boys and girls had tried alcohol.
The figures for Switzerland arc somewhat lower. At age I I years, 51 per cent of the Swiss boys and 41 per cent of tlae girls had tried :llcohol, and ztt age 13 )’e~u’s, 75 and 60 per cent lot boys and girls rcspectivcl),. At age 15 years, the lifetilne prevalence rates were 85 mad 79 per cent for bo),s and girls.
As mentioned above, it must be I)orne in mind that the question posed in the WHO slud), is somewhut different IYom what is comn~only regurded as Ihe apl)ropriate i)hrasing, viz., the question specified "tr),ing" alcohol -an expression thal ii1:1y have caused those responclcnLs who h;td merely t;iken a taste or ;i sip to zlllswer
in
the affirmalive. This m;ly ~lCCOlllll for I.hcfacl that the lifetime rutes are substantially higher th:m those reported in other studies in these countries.
PRIr.VAI.F.NCE OF DRINKING AND ASSOCIATED FA(.TroI/S 13
Ibr bee~; 79 per cent Ibr wine and 75 per cent for spirits, rrhe previous nlonth’s drinking rates were 35 per cent, 5,t per cent, 5,1 per cent and 48 per cent for the four beverages, respeclively. Although clueslions concerning cider were not askecl of Liar: Israeli adolescents, tile), had liretime r;lies of 70 per cent ror beer, 63 per cem for wine, and 52 per cenl for spirits. The corresponding rates for the previous months were 27 per cent, 27 per cent mid 22 per cent.
United States. The ongoing surveys of substance use (including drinking)
among high school seniors (e.g.,Johnston, el aL, 1984, 1985, 199(I) provide excellent estimates or adolescent drinking in Ihc United Stales. The prevalence figures obtained in these studies have been quite stable over Ihe last decade in suggesting that on average, 92 per cent of high school seniors in Ilial country have taken an alcoholic drink at sortie time in their lives. Similarly, current oh’inking rates have been quile slable, ahhougla there has been a small ch’op since 198B (fronl 69 per cluring the previous lllOlal.la to 6,1 percent). Furthernlore, these surveys indicate that man),ol’lhe high school seniors who did drink, claimed thai tile), did so to the point of inloxication..lust over ,15 per cent of those who did drink said Ihal they usuallvgol "very high"or "nloderatel), high" when drinking. Irurlhernlore, there are inclicalions Ill:at An/ericala youths sl:.ll’l ch’inking ala relalively young age. About halforlhe high school students hacl their lit’st drink belore age 14 ),ears.
For olher age-groups, the National Ho~tsehold S~trv~9, on Dru. Ab~se (US l)ept of Health and l-hllnan Services, 1990) provides information on rales or use of various subslances, including alcohol. The lllOSt recenl of these surveys h[Is shown lh~ll lit;re.tree rates of alcohol use were ,t I per cent for the I-9-17 )’ear old age group. Furtherinore, there was evidence of a sul)stantial drop in this l’igtlre since 1982. The percentages for 1989, 1985, and Iq88 were 52, 51 and 45 per cent, respectively. The same surveys have shown a simila," drop in etlrrent (previous monlh’s) use of alcohol, li’ol/i 30.~ per
cent in 1982 to 24.5 per cent ill 1990.
Canada, h/J’ornlatiola on tile situalion regm-ding yotllh and alcohol in Cal]:.ld;I is available in 11112 several studies b), tile Addiction Research Fc)undation of Olll;ll’iO 7tlld ill tile reporl of varioliS Slll-ve),s lay Ellan), (1{)89). A OalluI) poll in 19813 showed Ihai 45 per eenl of )’otlng people between 12-14 years had drunk alcohol in tile last },eTil-, while the eorreslaondilag I]gllre I})r those aged 15 io 17 ),ears wils 8~ per (;elil. This
14 DRINKING AMONG I’OST-PRIMAR’,’ SCHOOI~ I’UPILS
fiequent use for the two groul)s were 4 and 22 per cent, respectively. Surveys reported by Eliany (1989) indicate relatively high levels of clrunkenness among young people in Canada. In national samples aged between I_9 and 18 years, 1_9 per cent reported having felt drunk at least once a month. I)ata from New Brunswick anti Onlario suggest that among tile same age group about 22 per cent admitted to having 5 to 6 drinks on at least one occasion during Ihe previous month.
There are some indications of trends relating to youthful alcohol eonsumptiota and in general there is a suggestion that in Ontario, at least, there was a small decline in the proportion of heavy drinkers and problena drinkers over the years. For example, alnong youth age 1_9 to 17 years, there was a decline from .55 per cent (in 1981) to ,I.5 per cent (in 1986) in Ihose having three drinks or more on a given occasion.
Attstralia. A study hy Homel, el aL (198,1) provides exlensive data on adolescent drinking in Australia. In that country lifetime prevalence rates were 70 per cent, 82 per cent, 87 per cent, 89 per cent and 91 per cent Ibr the 13 to 17 year olds, respectively. These rates are relatively high by interllational standards. Rates for the previous nlonth were 39 per cent, 53 per cent, 63 per cent 7..’3 per cent and 7’I per cent for the corresponding age groups. Similarly, relatively high percentages ofyoung Auslralians reported having felt drunk at some time.
Factors Affecting Alcohol Use by Youth
Dem()~a/)hic Factors
Gender. In the extant literature a consistent picture emerges regarding
gender differences. Overall, Ihe indications are Ihat tile greatest differences are at the highest levels of consumption. Thus, it would seem that there are minimal differences hetween hoys and girls as regards lifetime prevalence, greater differences as regards current drinking and major differences in relation to heavy consuml~tion of alcohol.
I>REVALENCI- OF I)P, INKING AND ASSOCINI’F.D FACYFORS I.x,
years. The difl’erence belween file sexes was especially pronouncecl for die nmnlyer who feh drunk oil six occasions or" more. A sinlilar pattern of gender differences has been found ill the work of O’CollllOF (1978) in Ireland, in that of Johnston, el al., (1984, 1985) in the United States and in the work of Honlel, el al. (1984) in Australia.
Socio-economic and Related Factors. As regards socio-eeonomie factors, there is a remarkably small relationship lyetween such factors and drinking behaviour among youth. The Gcube and Morgan (1986) stuclv Ibund no association between various measures of drinking and father’s or mother’s OCCIApatioDa] StalllS. [Ft oLhec studies sinai] negative associaLions have beetl found (e.g.,Johnston, et al., 1985), indicating a greater tendencv for those voung people of lower soeio-economic SlaLtlS LO drink somewhat nlore, while in some others no association has been found (e.g., Keyes and 13lock, 198’t). Finally, few studies have found a small positive association between socio--economic factors and drinking. The recentAmerican studv by MarLin and I~rilch;trd (1991) found that iunong while males there was a tendencv for those of higher socio-economic slattlS to drink rather fi’equelitlv and to consume a larger qu:mtitv per drinking episode.
Social I nJluences
16 DRINKING AMONG I’OST-I’RIMARY SCHOOl. I’UI’I I ~q
level) but not in the Unil.ed States and Norway.
There is considerable evidence that parental disapproval tends to be associated with level of alcohol use. The Grube and Morgan (1986) study
found dlat in general, perceived disapproval ofdrinking by parenLs tended to be related Io lower levels of drinking. There was a suggestion in the study by Akers, el al. (1979) dial a curvilinear relationship existed between paternal au.ilude mid adolescent drinking, with higher levels of drinking being associated with both indifference and with exu’eme disapproval. In other words, the besl outcome (in ternls of low consuml)tion of alcohol) was brought ~l)otll W]lere p~|relltS tended to ]l~lve moderate, rather than exu’eme, attitudes towards children’s drinking.
In II~e context of the effects of parental disapproval on adolescenl au.itudc use, a study by AIkin and Atkin (1986) is of particular inteFest. This study found that teenagers tend to underestimate the extent of parental disapproval of their use of alcohol. In a survey of 1,700 Michigan high school students and their parents, it was found th~tt 85 per cent of I)arenls su’ongly disapproved of their teenager gelling drunk, 81 per cent su’ongly disapproved of party-going and 68 per cent strongly disapproved of their leenager having a few drinks wida friends. In contrasl, 49 per cent, 39 per cent and 29 per cent of teenagers perceived their strong parental disapproval of these activities. Similarly, this study showed that parents eonsistendy underestimated the fi-cquency of drinking and driving with a drinking driver by Iheir teenager. Irurthermore, parents reported thai they had a high frequency of communication about alcohol-relaled matters with Ihcir leenagcr and th[It tlae), closely monitored Lhe activities of children at weekends. In comrast, the m;~jority of teenagers reported a low fi’equency of communication about their drinking and perceived little or no chance that tl~eir parents could detect their drinking. Thus, parental expectations, disapproval and overall attitudes frequently IIl;.[y IIOt be coFnmunicate([ to their offsl)ring.
Peer influences. Of all the factors that have been thought to be related Io
PREVA|_ENCE O1: DRINKING AND ASSOCIATED F’ACI’ORS 17
drinkers, only 22 per cem were non-drinkers. Olher studies like thin. of Bank, el aL (1985) found that peer drinking was a strong predictor of reported drinking in the United States, Fi-ance, Norway and Ausu’alia.
While these smclies have established a strong association between peer behaviour (drinking) and reported drinking, there are a number of problerns of interprelation of such findings. For one thing, there ma,v be an element of misperception in the ]’eporL4 of the yotli’lg drinkel’s resuhing in their seeing greater SUl:~l)Ort For their own behaviour among their fi-iends Ihan aCtllaliy exists. Another possibility is that some Of the al)l)acent peer hailuence is due to selectiwsfi~endships. It may be thai young people may become friends "Vilril each olhel" on the basis of theil" COllllllOn I)ehaviouc. In other words, the frie~dships may result fi’om drinking as opposed Io causing it. The sludy by Morgan and Grubc (1991) atlempled Io disentangle these intluences. The results suggest thai i)arl of the appacent influence of fl-iends may be due to selective fifiendship. Howevm, peer example is still a factor in illil.iation to drinking. Anothec intel’esLillg point tO emerge fi’om this latter study is th:.lt peer disap[)l’oval iS I10[ ~l nlajov inllueuce, relative to Ihe other pare,at and peer []lClOl-S discussed here.
Some other recent studies have also addressed the question of how peer influence is actua]ly mediated. The ’,vot’k o[- 8ellel’s and Winfi-ee
(l~.).c}0) was designed to lest the exlent to which the acquisition of
favoural:)le or unfavotn’able definitions underlie peer inl]uellces. They argue that an individual lem’ns, il~ close imimate i~~tel’actiol~s, evaluations of I]ehaviottJ" as either al)propriate or inapl]l’opriale, good or bad. l)rinking is more likely to occur when people develop a grealer balance of Ihvom’able to unfavourable definitions of that behaviour. The results of the Sellers and Winfi’ee study among American high school students were largel,v supportive of the view that all exposure to :In excess Of definitions that l)wour drinking ave likely to increase the chances of alcohol use.
Attitudes and Beliefs about Consequences
18 DRINKING AMONG POS’I:PRIMAR’g SCHOOL PUI’II.S
Beliefs about Consequences. An important question concerns Ihe extent to which attitudes to drinking (and indeed drinking behaviom’) are (letermined by beliefs abotu tile consequences of drinking. Such beliefs
consist of two componenLs. On tile one hand, there may be differences in the likelihood that drinking will lead to particular consequences (expectancy), and secondly there may be differences in how such consequences are evaluated. The general finding in this research is that
drinkers are more likely to believe that positive consequences (e.g., feeling relaxed) are likely to come about as a result of drinking, and furthermore, drinkers are more likely to judge such positive consequences as being of greater importance daan do non-drinkers (Grul)e and Morgan, 1986).
Conversely, as regards negative consequences (e.g., getting into troul)le with parents or police), drinkers are inclined to believe that such outcomes are less likely to occur to them than are non-drinkers. In addition, tile)’ are also less inclined to believe that such consequences are important. This pattern of beliefs has been found to predict drinking in a number of countries in I)oth cross-sectional (Akers, et aL, 1979) and in longitudinal
research (Bamnan, et al., 1985).
It has also been shown that among aehflks, expectancies are better predictors of quantity-related drinking variables (inchtding usual quantity consumed per occasion) than of fi’equency of drinking occasions (Leigh,
1989). This outcome ma)’ be due to the fact that tile et’fecLs of drinking are feh only after a certain nunaber of drinks. Thus, initiating a drinking episode nlay be infhtenced by other factors, while tile amount drutlk II"lay
be heavil,v influenced by tile individual’s desire to experience particular subjective effects, which may in turn be influenced I)y beliefs abottt tile consequences of drinking.
It is important to realise that there is an iml)ortant difference between
pet~’onal beliefs regarding alcohol consequences and general beliefs
regarding consequences. The significant beliefs are those that relate to what may happen to "me" as a resuh of "my" drinking, rather than the consequences of alcohol for others. "Fhis point is illustrated in a recent study I)), Oei, Hokin and Young (1990). This sttld), examined tile relative ell’ectiveness of general statement5 regarding alcohol consequences and personal-related beliel~ in predicting drinking among 283 drinkers. "SelF’ statements predicted drinking I)ehaviour accurately as measured by consumption while other statements did so less effectively.
IJehaviou r a~id Personality, Factm:~
PRI~VAI.I’2NCE OF DRINI~.ING AND ASSOCIA’rED FACTORS 19
behaviotu’. For example, several studies have shown that young people who drink tend to 13e involved in olher deviant kinds oF behaviour like illicit drug use anti truancy (lessor and Jessoh 1977). In addition, in those studies that have examined attitlldes tow,71rds deviance, it has been shown that acceptance of deviant behaviour tends to relate strongly to drinking behaviour (Brook, e.t al., 1984).
The recent study by McAleer ( 1991 ) examined tile association beuvecn alcohol and "joy-riding". She found that joy-riding was more than lwiee as likely to occur among regular drinkers than among tile non-drinkers. However, there is a partieulm" problem with this comparison since it asked respondents if they went joy-riding r~er drinhi~Tg and such behaviour was obviously more likely to occur among regular drinkers. More relevant is the analysis ofthe association ofalcohol and joy-riding among drinkers. A comparison oF occasions when drinking vs. occasions when not drinking indicated that joy-riding was about twice as likely to occur on those occasions when the yotmg person had been drinking.
It has often been suggested that adolescent problenl behaviours (smoking, drinking, stealing, etc.) form a single dimension that reflect a general underlying tendency to non-conformity or deviance. In support of this general deviance hypothesis, it has been shown lllat there is a positive correlation between a wide range of prol~lem I~ehaviours and Ihat such behaviours appear to be inlhtenced in a similar fashion 133, tile same variables (Donovan and
.lessoh
19783. These latter researchers have clenlonstrated by nleans o1: factor analysis that there is a single conlnlon factor unclerlying problem behaviours, inclucling being clrunk, illegal clrug use, shoplifting anti vanclalism. Moreover, conventionality Ioacled on this faelor but in a negalive clircction. Furlhermore, Osgoocl, et aL (1988) fi:mncl that a single climension of general deviance accounts for tile m~jority of tile corm’lance among specilic problem behaviours and that this factor is predictive oF invoh,emcnt in these behaviours at a later point in lime.Grube and Morgan (1990b) noted dmt tile awtilable evidence for tile general deviance hypothesis is based ahnost exclusively on research with samples of aclolescents and young adulc~ in tile Unitecl States and that tile findings may, therel’ore, be specific to certain cuhural contexls. This hypothesis was examined in the context of the data fl’onl tile earlier subslmlCe use survey wJlh Dublin adolescenls. A series of maximum likelihood, contirmatory factor analyses, showed that three specific factors were ilecessal’y to accotlnt for tile covariation ~llnong problenl behaviotll" measures. These factors corresponded to: (i) substance use (drinking, smoking and illegal drug use), (ii) relatively minor problem 13ehaviours
20 DRINKING AMONG I’OS’I’-I’RIMARYSCHOOL PUI’ILS
vanclalism). Conmu’y to the general cleviance laypothesis, a seconcl order factor representing general deviance accounlecl fox" only 14 per cent of the vat’iance iua substance rise as olgposecl to 74 per cent of the variance in minor and serious behaviour problems. Grube and Mongan interpreted these tqndings as indicating that substance use among Irish adolescents was relatively independent of a general lendency towards deviance.
Restraining Factors. If an individual has a commitment to a conventional social institution, then they are less likely to engage in behavioun-s that are deviant and rebellious. In the context of drinking, this idea has been explon’ed in relation to commitment to family, school, church and religion. The basic idea is that to the extent that an individual wdues memberslail9 of those institutions, he or she will be less likely to be involved in various kinds ot" antisocial behaviour. While drinking per se is not illegal, under-age du’inking is illegal and is therefi)re likely to be influenced by adherence to the tmrms of such institutions.
The available literature strongly supports the finding that commitment to school, whether measut’ed by academic aspiration, self-reported grade on" fi’equency of absences I]’om school, is consistently and negatively related to drinking behaviout: In addition, Akers, a aL (1979) found that actual school grades related stn-ongly and negatively to alcohol consumption. Tim studies in France and Israel point to a similar conclusion. The ESRI study found that studenl.s n’ated importance of school and their vallng of own academic achievement were both negatively related to drinking (Grube and Morgan, 1986).
In line with this viewpoint, there is eviclence that college graduates show a drinking pattern that is different ti’om that of non-graduate dropouts. A n’ecent study by Crowley (1991) showed that college graduates were more frequent drinkers of alcohol but tended to drink less quantity
per drinking day than tim others of the same age. Furthermore, sex differences were smaller among college graduates. In addition to supporting the social bonding view, this study had implications for generalising 11"Oill resuhs oblainlcd on limited samples.
I’REVAIJ~NCE OF DRINKING AND ASSOCD\TED FAC, I’ORS 21
(1977) reports a negative relationship between comnlitnlerlt to religion
and frequency of drunkenness among adolescents.
There is also an indication that a strong commitment to family can bring about a lendenc), to drink rather less. The recent study by Martin anti Pritchard ( 1991 ) found thai those ),orang adults who had a relativel), greater commitment to their families tended to drink less frequently and also to drink lesser amounus.
Perceived Availability
The concept of perceived availability is defined as the extent to which an individtml believes that he or she has (i) access to alcohol, and (ii) the resources with which to obtain iL Perceived access simply reff:rs to the difficulty or ease fllat an inclivichml thinks there wotdd be in obtaining alcohol. Perceived access wilt vary depending on a variety of social circumstances. In general, adolescents tend to believe that access to legal drugs (alcohol and cigareHes) is eas)q while they perceived access to illegal stll)st~mces wits less Cel’12til]. However, even when access is perceived as easy, availabilii), ma), be limited by lack of resources.
A small latlml)er of studies have examined tile availability of alcohol in h’eland. The recenl work o f Johnson, et el. (1990) suggests daat many of the 13-15 year olds in that study bottght alcohol themselves, eilher in the supermarkets, pubs, or ofl:-Iicenees. Another group (roughly one-third) reported raking alcohol fi’Oln home without their parents’ knowledge. The studies by Johnson, et al., and Grube and Morgan (1986) examined the extent to which young people had the resources (pocket molaey) Io obtain alcohol. Both studies are in agreement in suggesting tlae vast m:~ori/y hacl tile i’eSOkll’Ccs to allow ill [eilSt fof ~l nlodest consullaption of alcohol. Furthermore, the Grube ancl Morgan study Found that having the resources (i.e., pocket money) was indeed related to freqtlenc), of oh’inking. This outcome ties in with tile results of the work byJolmston, el aL (1985) who Ibund Ihat perceived availabilit), is an importanl, predictor of alcohol use b)’ American adolescellls.
Summary and Conclusions
2 2 I) RI N KIN G AM O NG F’OST-P RI MARY SCH OO I. P U F’I I-S
studies seem to have used the same measures of: drit’~king across a mxml)er of years. Thirdl),, on the basis of previous studies, it would seem that in com[)al’ison with other counuies, tile nunlber of cul’rent drinkers among hish youth is between the rates ol: high consumption countries (like France) and low cotasumption counuies (like Israel). Fourthl); given that (at least up the end of the 1980s) there was a sizeable minority of),oung h-ish people who are total abstainers, and given that a great many of those who drank have been drunk at least once, tile prol)lenl in h’eland is as much the paltm’n of drinking as opposed to actual nunlbers who drink. Fifthl),, the age at which },oung people begin to drink has decreased somewhat over the last few )’ears. Finall),, there is no indication that an), one drink is especially popular with young people as opposed to aclults.
Chapter 3
METHODOLOGY
Tile present chapter describes tile research methodolog’), used in this study ancl consiclers some general issues relating to research on alcohol use in cross-national sltlclies. The following nreas are considered: (i) pilot tests of tile (luestionmdre and instructions; (ii) characteristics of the samples; (iii) tile final survey instrument; and (iv) tile administration of tile survey. Finally, solne general matters relating to reliability and validity of self-reports of drinking are considered ~s well as some m:lllel’S rel;tting to I)roblems with cross-national studies.
Pilot Studies
A series of pilol tests were unclertaken i,, tile eight nlonths before tile
survey in Ol-der to devclop ~:ll~ld i’e~lle tile S[ll’Ve}, iDstrtlll]el]LS ~:|lld data collection procedures and to provide initial tesus of the cross-ctdtural
eqttivalence of the meastlres. These pilol studies were conclucled in two Dublin schools and in two schools in the San Francisco Bay Area of California, in the winter of 1990 and in the earl,v months of 1991.
Prior to the pilot work, oh’aft queslionnaires were cleveloped on the basis oF.- (i) the theoreticzd lbcus of the presem work, (ii) the Ibrmat of the questionnaires used b)’ the autlaors in the previous study (e.g., Grube anti Morgan, 1986; 1990a), (iii) the partieul:u needs of the present stttdy, especially the reqttirement IO have items that woulcl be equally well unclerstoocl by h+ish anti American ehilch’en.
During these pilot studies, tile original draft questionnaires went through considerable change. Among the moclilqeations were the following: (i) the most contmon positive :rod negative consecluences Ihal the students associated with clrinking were identified, (ii) the format of the questionnaire was siml)lifiecl so that all age groups were likely to be able to understancl the items, (iii) the questionnaire was shortened so that its coml)letion would nol. take any longer than a cklss i)eriod.
.S’rl,~/es