Abstract— Concrete quality can be assessed by its ability to withstand its design life without failing, which is a function of its strength and durability. The effect of fly ash (FA)-β-cyclodextrin (β-CD) composite on concrete’s durability indexes was investigated in this paper. Two durability index tests (oxygen permeability and sorptivity) were used for the assessment. FA (30% and 50% by mass of cement), β-CD (0.025%, 0.05% and 0.1%) and FA-β-CD composite were incorporated in the concrete mix. Twenty four different concrete mixes were investigated at 0.5 water-binder ratio (W/B) and 0.4 W/B. The tests were performed on the concrete samples after being cured for 28 and 90 days. The results showed that β-CD and FA-β-CD composite decrease oxygen permeability and sorptivity of concrete when used at optimum percentages.
Index Terms— Composite, Cyclodextrin, Fly ash, Oxygen permeability, Sorptivity
I. INTRODUCTION
NE of the industrial wastes that are abundant in South Africa is Fly ash (FA). The disposal of FA on the landfill results to environmental pollution. According to an ESKOM (the South African power utility) report [1], FA is presently being re-used minimally. Hence, there is a need to investigate the possibility of increasing the utilisation of FA in concrete production. A composite, comprised of FA and β-cyclodextrin (an enzymatic modification of starch) has been previously reported by the authors [2, 3, 4] to have a tendency of enhancing FA properties when used in concrete. Some of the properties that were enhanced are the early strength of FA concrete. FA has the attribute of delaying hydration and as a result reduces early strength. With the incorporation of β-cyclodextrin, early compressive strength of FA concrete was enhanced [4] when β-cyclodextrin was used at the optimum percentage of 0.05% replacement of cement. To further buttress the previous report, the effect of FA, fly ash (FA), β-cyclodextrin (β-CD) and fly ash-β-cyclodextrin (FA-β-CD) composite on concrete durability was investigated and is reported in this article. Cyclodextrins (CDs), an oligosaccharides derived from the enzymatic modification of starch [4]. The material has been shown
Manuscript received January 30, 2018; revised March 04, 2018. This work was supported by the University of South Africa and the University of Johannesburg, South Africa.
B.D Ikotun is with the University of South Africa, Department of Civil and Chemical Engineering (phone: +27114712145; e-mail: [email protected]).
G.C Fanourakis is with the University of Johannesburg, Department of Civil Engineering Technology (e-mail: [email protected]).
S.B Mishra is with the University of South Africa, Nanotechnology and water Sustainability unit. (e-mail: [email protected]).
previously to form a compatible composite with FA, which has resulted to increased compressive strength of concrete [4]. Concrete of good durability will maintain its engineering properties in the midst of aggressive environmental conditions [5]. The agent of concrete deterioration, which is responsible for both physical and chemical processes of concrete degradation, is water. A durable concrete should be dense enough to limit the ingress of water or chemicals, which could enter the concrete through permeation, absorption and diffusion. According to Heede et al [6], the best way to study concrete durability is to study the parameters that influence the deterioration process. These parameters are the ones related to the transportation mechanisms. The durability index tests used in this study are based on two transportation mechanisms; permeation for oxygen permeability, and absorption for water sorptivity.
The movement of an aggressive chemical within the concrete is guided by the permeability of the concrete. The permeability is however influenced by the intensity of the microcracks as well as the volume and the size of the capillary pores in the cement paste [7]. The volume of open pores accessible to water by capillary suction is measured by sorptivity [8]. Diffusion is the movement of liquid, gas or ion through a porous material from the region of higher concentration to the region of lower concentration [9, 10], which is measured by chloride conductivity. Two (permeability and sorptivity) out of these three durability index tests developed by Alexander and co-researchers [9, 11, 12] were used.
II. MATERIALSANDMETHODS
A. Materials
The materials that are considered to be binding materials in this study were Portland cement (CEM I 52.5 N) and Fly ash (FA). CEM I 52.5N cement type was obtained from Pretoria Portland Cement Company (PPC), South Africa. The FA obtained from ESKOM power station, South Africa was used. β-cyclodextrin (β-CD) was obtained from Industrial Urethanes (Pty) Ltd, South Africa. The fine aggregate and coarse aggregate were obtained from Afrisam, South Africa. Granite crusher sand was used as fine aggregate; while granite nominal size of 22 mm was used as coarse aggregate. The compositions of the FA and the cement used as reported previously are presented in Table 1. The sum of the SiO2, Al2O3, and Fe2O3 contents in the FA used is greater than 70% by mass, therefore it is classified as “Class F” FA as specified in ASTM C 618 [13].
Investigation of the Fly Ash - β Cyclodextrin
Composite on Concrete’s Durability Indexes
Bolanle D. Ikotun,
Member, IAENG George C. Fanourakis
, and Shivani B. Mishra
β-CD-FA composites were produced by a physical mixture of a pre-weighed amount of the individual material (FA and β-CD). 0.025%, 0.05% and 0.1% (by mass of cement) proportions of β-CD were used, while 30% and 50% (by mass of cement) proportions of FA were incorporated in the mix. Samples are described according to Table 2, the same description as the previous study by the authors was used [14]. The mixes were prepared using approximately 0.5 and 0.4 water/binder ratio (W/B’s) respectively. Twenty-four mixtures in total were produced, which consist of twelve mixes for each W/B. The concrete was mixed according to SANS 5861-1:2006 [15]. Slump test was performed according to SANS 5862-1:2006 [16] immediately after the mixing. The mixture proportions as previously reported [4] are used. Four 100 mm cubes were produced for each mixture resulting in a total of 96 cubes for the durability index tests. Samples were prepared according to SANS 3001-C03-1:2015 [17]. A total of 8 discs, each having a diameter of 68 mm and thickness of 30 ± 2 mm, were core drilled from the four cubes for each mixture after being cured for 28 and 90 days (8 discs per curing period). These eight discs per mixture were used for permeability and sorptivity tests. Four discs for permeability/sorptivity were tested at each curing age per mixture; the disc samples were preconditioned in an oven at 50 0C for 7 days before testing.
B. Methods
C. Permeability tests
The disc samples were allowed to cool down for 2 hours in a room maintained at 23oC, after being preconditioned in an oven at 50 0C for 7 days. The procedure described in SANS 3001-CO3-2:2015 [18] was followed. The test setup is shown in Figs 1. The same disc samples were used for the sorptivity test after the permeability test was done.
Fig. 1. Oxygen permeability apparatus setup used
The coefficient of permeability (m/s) was calculated using the Equation
(1): K= P P In t d RA WVg o .
(1)
where:
K = coefficient of permeability in m/s
W = molecular mass of oxygen, 32 g/mol
V = volume of oxygen under pressure in permeameter (m3)
g = acceleration due to gravity, 9.81 m/s2
R = universal gas constant, 8.313 Nm/Kmol
A = superficial cross-sectional area of sample (m3)
d = average sample thickness (m)
θ = absolute temperature (K)
t = time (s) for pressure to decrease from Po to P
Po = pressure at the beginning of test (kPa)
P = pressure at the end of test
The result recorded for each test was the average of the results of the four
discs.
D. Sorptivity tests
After the permeability test, a tape was used to cover 5mm depth above the test face of the curved surface of the disc samples. This will allow only one directional flow of water. A test tray was prepared that contained a tissue layer soaked with lime-saturated water and the test face of the sample was placed in the test tray such that the edge of the sample has contact with the saturated lime-water. The mass of these samples was determined for a period of up to 25 minutes at regular intervals of 3, 5, 7, 9, 12, 16, 20 and 25 minutes. The
TABLE2
DESCRIPTION OF SAMPLES USED *[14]
SAMPLE COMPOSITION DESCRIPTION
A Control (100% C) only cement
B C30FA cement 30% FA
C C50FA cement 50% FA
D C0.025CD cement 0.025% β-CD
E C0.05CD cement 0.05% β-CD
F C0.1CD cement 0.1% β-CD
G C30FA0.025CD cement 30% FA-0.025% β-CD H C30FA0.05CD cement 30% FA -0.05% β-CD I C30FA0.1CD cement 30% FA -0.1% β-CD J C50FA0.025CD cement 50% FA -0.025% β-CD K C50FA0.05CD cement 50% FA -0.05% β-CD L C50FA0.1CD cement 50% FA -0.1% β-CD
*Owned by the authors.
TABLEI
CHEMICAL COMPOSITIONS OF THE FLY ASH AND CEMENT USED *[4]
Content in oxide form. % mass FA % mass Cement SiO2
Al2O3
Fe2O3
MgO CaO Na2O
K2O
TiO2
SO3
LOI SiO2/Al2O3
samples were then vacuum saturated by applying -75 kPa suction for 3 hours in an empty desiccator. Thereafter, the samples were subjected to vacuum suction in Ca(OH)2 saturated water for 5 hours. The samples were allowed to soak for 18 hours after the vacuum suction and weighed. Sorptivity was calculated following Equations (2) to (3). The mass of the water absorbed at each weighing period was calculated using:
Mwt=
M
st
M
so(2)
where:
Mst = mass to the nearest 0.01 g of the sample at time t Mso = initial mass of the specimen to the nearest 0.01 g The slope of graph of water absorbed (Mwt) versus the square root of time (in hr) was used to calculate sorptivity.
S=
so sv
M
M
d
F
.
(3)
WHERE:
F = the slope of the best fit line obtained by plotting Mwt against t½
S = sorptivity
Msv = vacuum saturated mass of the samples to the nearest 0.01 g
The result recorded for each test was the average of the results of the four discs.
III. RESULTSANDDISCUSSION
A. Permeability results for 0.5-W/B samples
The permeability behaviour of concrete samples is related to the pore connectivity of the samples [16]. The OPI can be used to predict the long-term performance of concrete against corrosion through carbonation, the values generally range from 8 to 11.
The higher the OPI, the less permeable the concrete, therefore higher OPI will give lower coefficient of permeability (k).
The OPI values of the 0.5-W/B samples are presented in Table 3. It is evident that the samples had a good to excellent permeability at both curing ages except in the case of the samples with 0.1% CD. The sample’s (with 0.1% β-CD) OPI and coefficient of permeability showed invalid, meaning that some of the discs did not give interpretable results, therefore the average of the results could not be recorded, rendering the overall results invalid. The samples with 0.1% β-CD will further be excluded in the permeability discussion. In Table 6, the samples with FA showed a better (lower) permeability than the control sample.
An increased better permeability indication, in relation to the samples with FA, was noticed for composite samples with 0.025% β-CD.
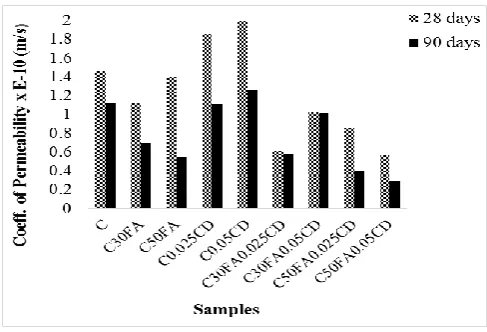
[image:3.595.304.548.418.584.2]The coefficient of permeability results of the 0.5-W/B samples, as shown in Fig. 2, revealed a decrease in permeability with increased curing age for all the samples. This is an indication that as hydration progressed the concrete became denser and reduced the amount of continuous pores, where most of the flow would occur. As indicated in the OPI results, FA and FA-β-CD composite samples showed decreased permeability at both curing ages in relation to the control sample. The presence of FA in C30FA and C50FA mixtures reduces the permeability in comparison with the reference control sample. The presence of β-CD in plain concrete (excluding FA) increased the permeability in relation to the control sample.
Fig. 2. Coefficient of permeability of 0.5-W/B samples
TABLE3
OXYGEN PERMEABILITY INDEX (OPI) VALUES FOR 0.5-W/B SAMPLES
28 days Variability check 90 days Variability check
C 9.84 Good 9.95 Good
C30FA 9.95 Good 10.16 Excellent
C50FA 9.85 Good 10.26 Excellent
C0.025CD 9.73 Good 9.96 Good
C0.05CD 9.84 Good 9.90 Good
C0.1CD Invalid Invalid Invalid Invalid
C30FA0.025CD 10.21 Excellent 10.24 Excellent
C30FA0.05CD 9.99 Good 9.99 Good
C30FA0.1CD Invalid Invalid Invalid Invalid
C50FA0.025CD 10.07 Excellent 10.40 Excellent
C50FA0.05CD 10.25 Excellent 10.53 Excellent
[image:3.595.95.495.643.789.2]It was noticed that at the 28 days curing period, the C30FA sample had a greater decrease in permeability in relation to the C50FA sample (in comparison to the control sample), but at the 90 days curing period, the C50FA decreased permeability (52 % decrease) was better than the C30FA (38 % decrease), in comparison with the control sample. An increased permeability was noticed for the samples with β-CD (up to 36 % increase for C0.05CD at 28 days curing). The FA-β-CD composite samples containing 30% FA showed a decreased permeability at both curing ages (up to 58 % for C30FA0.025CD at 28 days curing and 29 % for C30FA0.05CD at 28 days curing).
The FA-β-CD composite samples containing 50% FA revealed a decrease in permeability at both curing ages (up to 65 % for C50FA0.025CD at 90 days curing and up to 74 % for C50FA0.05CD at 90 days curing), in comparison with the control sample. The better influence of FA on the permeability of concrete at 90 days curing age, in relation to the 28 days curing age, can be linked to the pozzolanic reaction, which is slower than hydration reaction. The pozzolanic reaction only had a visible effect on the concrete properties after the 28 days curing age as revealed in the X-ray diffraction (XRD), Fourier transform infrared spectroscopy (FT-IR) and Scanning electron microscope (SEM) results reported previously [14].
FA-β-CD composite samples improved the permeability of their comparative C30FA and C50FA samples by decreasing the coefficient of their permeabilities at both curing ages, except for C30FA0.05CD sample, where an increase in permeability was noticed at the 90 days curing age, in comparison with the comparative C30FA sample. This positive effect of the FA-β-CD composite samples on the permeability of their comparative C30FA and C50FA samples can be attributed to the improved denser morphology of the FA-β-CD composite samples when observed on SEM [14] from the 28 days hydration period.
B. Permeability results for 0.4W/B samples
Table 4 presents the OPI values of the 0.4-W/B samples. The trend observed for 0.5-W/B samples was also noticed for the 0.4-W/B samples.
The durability indication of all the samples ranged between good and excellent except in the case of the samples with 0.1% β-CD, which revealed invalid OPI values, as seen in the 0.5-W/B samples. As stated for 0.5-W/B samples, the samples with 0.1% β-CD will further be excluded in the permeability discussion because of their invalid results. The samples with FA and 0.025% β-CD revealed a better permeability indication than the control samples. Generally, the 0.4-W/B samples showed a better permeability than the 0.5-W/B samples except for a few exceptions.
The FA-β-CD composite samples containing 50% FA for 0.4-W/B revealed a lower permeability than the samples with the 0.5-W/B at both curing ages; also, the control sample and the C0.05CD sample for 0.4-W/B had a lower permeability than their corresponding samples with 0.5-W/B at 90 days curing age.
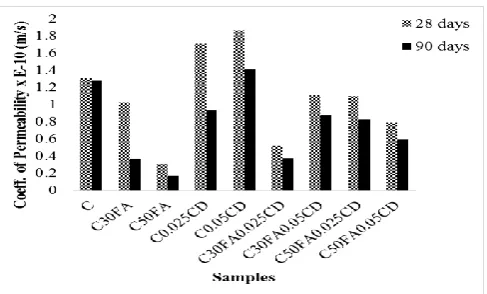
A decrease in permeability at increased curing age was noticed for all the 0.4-W/B samples as shown in Fig. 3. The FA and FA-β-CD composite samples had a positive effect on permeability; decreased permeability was noticed for these samples at both curing ages, in comparison with the control sample. The C50FA sample showed a greater decrease in permeability than C30FA sample. As observed for the 0.5-W/B samples, increased permeability was noticed for sample containing 0.05 % β-CD in plain concrete at both curing ages. The sample with 0.025% β-CD in plain concrete (excluding FA) showed an increase in permeability at the 28 days curing age and lower permeability at 90 days curing age in comparison with the control sample.
Fig. 3. Coefficient of permeability of 0.4-W/B samples
TABLE4
OXYGEN PERMEABILITY INDEX (OPI) VALUES FOR 0.4-W/B SAMPLES
28 days Variability check 90 days Variability check
C 9.88 Good 9.89 Good
C30FA 9.99 Good 10.43 Excellent
C50FA 10.51 Excellent 10.76 Excellent
C0.025CD 9.77 Good 10.03 Excellent
C0.05CD 9.73 Good 9.85 Good
C0.1CD Invalid Invalid Invalid Invalid
C30FA0.025CD 10.28 Excellent 10.42 Excellent
C30FA0.05CD 9.95 Good 10.06 Excellent
C30FA0.1CD Invalid Invalid Invalid Invalid
C50FA0.025CD 9.96 Good 10.08 Excellent
C50FA0.05CD 10.15 Excellent 10.23 Excellent
[image:4.595.306.550.443.590.2]The FA and FA-β-CD composite samples decreased permeability at both curing ages, in comparison with the control sample (C) for 0.4-W/B. This trend was also noticed for 0.5-W/B (Fig. 2). However, the FA and FA-β-CD composite samples (with 30% FA) generally had a greater influence in decreasing the permeability of the 0.4-W/B control sample than the 0.5-W/B control sample. The C50FA sample showed a greater decrease in permeability at both curing ages than the C30FA sample, in comparison with the control sample (for 0.4-W/B). The FA-β-CD composite samples with 50% FA showed a decrease in permeability at both curing ages (up to 36 % for C50FA0.025CD at 90 days curing and up to 54 % for C50FA0.05CD at 90 days curing), in comparison with the control sample. The influence of 0.025CD on permeability was better for the 0.4-W/B than for 0.5-W/B (Fig. 2), as decreased permeability was noticed for C0.025CD sample at the 90 days curing age in comparison with the control sample (for 0.4-W/B), and this was not the case for 0.5-W/B sample.
Generally, the FA and FA-β-CD composite samples had a better influence on concrete permeability at the 90 days curing age than at the 28 days curing age; this is attributed to slower pozzolanic reaction in these samples. The positive effect of FA and FA-β-CD composite samples on concrete permeability, as in relation with the control sample, is also linked to their improved surface morphologies as revealed in the SEM results previously discussed [14].
It was also noticed that the FA-β-CD composite samples had a lower influence on the permeability in 0.4-W/B samples than in the 0.5-W/B samples. For the composite samples containing 30% FA, for the 0.4-W/B, a decrease in permeability was only noticed for C30FA0.025CD sample at the 28 days curing age in comparison to their comparative C30FA samples. A slight increase in permeability was noticed for this sample (C30FA0.025CD) at the 90 days curing age and the C30FA0.05CD sample showed a permeability increase at both 28 and 90 days curing ages. A greater increase in permeability was noticed for the C30FA0.05CD sample at 90 days in the 0.4-W/B samples than in the 0.5-W/B samples, in comparison to their comparative C30FA sample. The FA-β-CD composite samples containing 50% FA showed increased permeability at both curing ages in relation to the C50FA samples (for 0.4-W/B). This is contrary to the observed trend for 0.5-W/B samples, where permeability reduced for the FA-β-CD composite samples containing 50% FA in relation to the C50FA samples (Fig. 2). This might be an indication of a better effect of C50FA on concrete permeability in the 0.4-W/B samples (Fig. 3) than in the 0.5-0.4-W/B samples (Fig. 2).
C. Sorptivity results for 0.5-W/B samples
Sorptivity measures the volume of pores that are accessible to water by capillary action [8]; it is not related to the pore connectivity as is the case with permeability. Fig. 4 shows the sorptivity results of samples with a 0.5-W/B. As expected, a decrease in sorptivity was noticed for all the samples as curing age increased. This is an indication of
improved hydration and pozzolanic reactions resulting in denser concrete at higher curing age with reduced volume of capillary pores. The FA and FA-β-CD composite samples showed reduced sorptivity at both curing ages in comparison with the control sample. The β-CD in plain concretes showed reduced sorptivity at a lower percentage (0.025%) in relation to the control sample at both curing ages. Samples with 0.05% β-CD had approximately the same sorptivity as the control sample. However, an increase in sorptivity was noticed for the sample containing 0.1% β-CD at both curing ages, in comparison to the control sample. The lower the β-CD content, the more favourable the sorptivity observed. The C50FA samples showed a further reduced sorptivity than the C30FA sample at the 90 days curing age when, in relation with the control sample (0.5-W/B).
The results revealed the positive effect of FA and FA-β-CD composite samples in reducing concrete sorptivity. The FA-β-CD composite samples generally showed reduced sorptivity in relation to their comparative C30FA and C50FA samples at lower percentages of β-CD, in comparison to the control sample. A reduction in sorptivity was noticed for the C50FA0.025CD (up to 40 % decrease at 90 days curing), 50FA0.05CD (up to 42 % decrease at 90 days curing) and C50FA0.1CD (up to 22 % decreases at 28 days curing) samples at both 28 and 90 days curing ages. In general, it was noticed that, the lower the amount of β-CD in plain and composite samples, the better the influence they had in reducing sorptivity.
Fig. 4. Sorptivity of 0.5-W/B samples
The FA-β-CD composite samples decreased sorptivity of the comparative C30FA sample at 28 days curing age while an increase in sorptivity was noticed at 90 days curing age. The composite sample with 0.025% β-CD showed a better influenced on sorptivity than the samples with 0.05% and 0.1% β-CD, in comparison with their comparative C30FA sample. The FA-β-CD composite samples with 50 %FA showed decreased sorptivity at both curing ages for the C50FA0.025CD and C50FA0.05CD samples, also, decreased sorptivity was noticed for C50FA0.1CD at 28 days curing age (Fig. 4). This further showed better influence of 0.025% β-CD on sorptivity than the samples with 0.05% and 0.1% β-CD.
D. Sorptivity results for 0.4-W/B samples
The sorptivity results of the 0.4-W/B samples are shown in Fig. 5. The control, C30FA, C0.05CD, C0.1CD and C30FA0.05CD samples with 0.4-W/B had a reduced sorptivity in comparison with their comparative 0.5-W/B samples at both curing ages (Fig. 4). The C0.025CD sample with 0.4-W/B showed a higher sorptivity at 90 days curing age than C0.025CD sample with 0.5-W/B (Fig. 4), while C30FA0.025CD sample with 0.4-W/B showed higher sorptivity at 28 days than its comparative 0.5-W/B sample (Fig. 4). The 0.4-W/B samples were expected to be denser than the 0.5-W/B samples, therefore, exhibiting lower sorptivity, but on the contrary for all composite samples containing 50% FA, higher sorptivity at both curing ages was exhibited for 0.4-W/B samples than for the 0.5-W/B samples. Fig. 5 revealed a decreased sorptivity at higher curing age for all samples, as also shown for 0.5-W/B samples (Fig. 4).
Fig. 5. Sorptivity of 0.4-W/B samples
The results showed reduced sorptivity for the FA samples at both curing ages, in comparison with the control sample. The C30FA sample revealed a greater reduction (up to 26 % decrease at 90 days curing) in sorptivity than the C50FA sample, in comparison with the control sample. The effect of the β-CD on the sorptivity of plain concrete with 0.4-W/B was negligible at lower contents of β-CD, at 0.025% β-CD, a similar sorptivity was noticed at both curing ages in comparison with the control sample. For the C0.05CD
sample, a slightly increased sorptivity was noticed at both curing ages in relation to the control sample, while for the C0.1CD sample, increased sorptivity was noticed at both curing ages, in comparison with the control sample. Generally, the composite samples showed a decrease in sorptivity at lower contents of β-CD at 90 days curing age in relation to the control sample, while the composite samples with 0.1% β-CD increased in sorptivity at both curing ages relative to the control sample. In general, the lower the β-CD content in both plain and composite samples, the better the influence it had on the sorptivity. This can be attributed to the observation made by Ikotun et al [14] that, the samples with 0.025% and 0.05% β-CD revealed a more improved surface from SEM than samples with 0.1% β-CD for both 28 and 90 days hydration periods, which may have resulted to the reduction in the volume of pores accessible to water.
IV. CONCLUSIONS
The results of the investigation of FA-β-CD composite on concrete durability indexes were presented and discussed. A decrease in permeability and sorptivity was noticed for all the samples as curing age increased. The FA and FA-β-CD composite samples with 0.025% and 0.05% β-CD reduced the permeability and sorptivity in comparison to the control samples for both the 0.5-W/B and 0.4-W/B at both curing ages. The 0.4-W/B samples showed a better influence on the permeability (maximum 86.56% reduction for C50FA) in relation to the 0.5-W/B (maximum 73.89% reduction for C50FA0.05CD) samples, while a better influence on sorptivity was noticed for 0.5-W/B samples (maximum 41.56% reduction for C50FA0.05CD) in relation to the 0.4-W/B (maximum 25.76% reduction for C30FA) samples. The positive effect of FA and FA-β-CD composite samples on concrete permeability and sorptivity, in relation with the control samples is linked to their surface morphologies. The FA-β-CD composites reduced permeability and sorptivity properties of the 0.5-W/B pozzolanic concrete relative to the 0.4-W/B pozzolanic concrete.
ACKNOWLEDGMENT
We thank the support of the University of South Africa and the University of Johannesburg, South Africa and for making this research possible.
REFERENCES [1] ESKOM 2014. ESKOM integrated report 2014,
http://integratedreport.ESKOM.co.za/pdf/full-integrated.pdf (CITED: 28/11/2014).
[2] Ikotun B. D., Mishra S., Fanourakis G. C.: Structural Characterisation of four South African fly ashes and their structural changes with β-cyclodextrin. Parti. Sci. and Tech 2014; (32):360-365. [3] Ikotun B.D., Mishra S., Fanourakis G.C.: Study on the synthesis,
morphology and structural analysis of fly ash–cyclodextrin composite. J of Incl Phenom and Macro Chem 2014; (79):311-317. [4] Ikotun B. D., Fanourakis G. C., Mishra S.: The effect of Fly ash, Beta-cyclodextrin and Fly ash-Beta-cyclodextrin composites on concrete workability and strength. Cem and Concr Comp 2017; (78): 1-12.
[6] Heede P.V., Gruyaert E., Belie N.D.: Transport properties of high-volume fly ash concrete: Capillary water sorption, water sorption under vacuum and gas permeability. Cem and Concr Comp 2010; (32): 749–756.
[7] Guneyisi E., Gesoglu M., Ozturan T., Ozbay E.: Estimation of chloride permeability of concretes by empirical Character: Considering effects of cement type, curing condition and age. Constr and Building Mat 2009; (23) 469–481.
[8] Soroka I.: Portland cement paste and concrete, Published by the Macmillan Press Limited, ISBN 0-333-24231-9, pp. 30-34 (1979). [9] Alexander M.G., Mackechnie J.R., Ballim Y.: Guide to the use of
durability indexes for achieving durability in concrete structures, Research monograph no 2, published by the Department of Civil Engineering, University of Cape Town in collaboration of University of the Witwatersrand, pp. 5-25 (2001).
[10] Olorunsogo F.T., Padayachee N.: Performance of recycled aggregate concrete monitored by durability indexes. Cem and Concr Res 2002; (32): 179–185.
[11] Alexander M.G., Ballim Y., Mackechnie J.M.: Concrete durability index testing manual, Research monograph no. 4, Departments of Civil Engineering, University of Cape Town and University of the Witwatersrand (1999).
[12] Alexander M. G.: Durability indexes and their use in concrete engineering, International RILEM Symposium on Concrete Science and Engineering: A Tribute to Arnon Bentur. Print-ISBN: 2-912143-46-2, e-ISBN: 2912143586, Publisher: RILEM Publications SARL, 9 – 22 (2004).
[13] ASTM C 618: 2012 Standard Specification for Coal Fly Ash and Raw or Calcined Natural Pozzolan for Use in Concrete.
[14] Ikotun B.D., Mishra S., Fanourakis G. C.: Modification Of the Hydration Products Of Hydrated Cement Paste by Fly ash, β-cyclodextrin and Fly ash-β-β-cyclodextrin Composite. J of Incl Phenom and Macro Chem 2017; Imprint: Springer Volume 87, pages 219-237.
[15] SANS 5861-1: 2006: South African national standard. Concrete tests, Part 1: Mixing fresh concrete in the laboratory, ISBN 978-0-626-27128-2. Edition 2.1.
[16] SANS 5862-1:2006, Concrete tests-consistence of freshly mixed concrete – slump test, Pretoria: South Africa Bureau of Standards. [17] SANS 3001-C03-1:2015, Concrete durability index testing -
Preparation of test specimens.