Proceedings of the 2019 Conference on Empirical Methods in Natural Language Processing 3143
Table-to-Text Generation with Effective Hierarchical Encoder
on Three Dimensions (Row, Column and Time)
Heng Gong, Xiaocheng Feng, Bing Qin∗, Ting Liu
Harbin Institute of Technology, China
{hgong, xcfeng, qinb, tliu}@ir.hit.edu.cn
Abstract
Although Seq2Seq models for table-to-text generation have achieved remarkable progress, modeling table representation in one dimen-sion is inadequate. This is because (1) the table consists of multiple rows and columns, which means that encoding a table should not de-pend only on one dimensional sequence or set of records and (2) most of the tables are time series data (e.g. NBA game data, stock mar-ket data), which means that the description of the current table may be affected by its histori-cal data. To address aforementioned problems, not only do we model each table cell consid-ering other records in the same row, we also enrich table’s representation by modeling each table cell in context of other cells in the same column or with historical (time dimension) data respectively. In addition, we develop a ta-ble cell fusion gate to combine representations from row, column and time dimension into one dense vector according to the saliency of each dimension’s representation. We evaluated our methods on ROTOWIRE, a benchmark dataset of NBA basketball games. Both automatic and human evaluation results demonstrate the ef-fectiveness of our model with improvement of 2.66 in BLEU over the strong baseline and out-performance of state-of-the-art model.
1 Introduction
Table-to-text generation is an important and chal-lenging task in natural language processing, which aims to produce the summarization of
numeri-cal table (Reiter and Dale,2000;Gkatzia,2016).
The related methods can be empirically divided into two categories, pipeline model and end-to-end model. The former consists of content selec-tion, document planning and realisaselec-tion, mainly for early industrial applications, such as weather
∗
Email corresponding.
Player PTS AST REB …
Wizards
Paul Pierce 11 1 3 …
Nene 8 1 7 …
Bradley Beal 18 1 11 …
John Wall 16 10 1 …
… … … … …
Kris Humphries 13 1 5 …
Hornets
Michael Kidd-Gilchrist 13 3 13 …
Al Jefferson 18 1 12 …
Gerald Henderson 17 5 2 …
Brian Roberts 18 3 1 …
… … … … …
Gary Neal 12 1 0 …
The Charlotte Hornets ( 21 - 27 ) defeated the Washington Wizards ( 31 - 18 ) 92 - 88 on Wednesday … The Hornets wereledby the duo ofJohn WallandBradley Beal. Wall went 4 -for - 14 from the field and 1 - -for - 4 from the three - point line to score agame - highof 16
point … Gerald Henderson had a solid
showing as well , finishing with 17 points ( 6 -13 FG , 1 - 2 3Pt , 4 - 4 FT ) and five assists . It was hisseconddouble - double in a row…
Tables
Baseline result (CC)
Team POINTS WINS LOSSES …
Wizards 88 31 18 …
Hornets 92 21 27
The Charlotte Hornets ( 21 - 27 ) defeated the Washington Wizards ( 31 - 18 ) 92 - 88 on
Monday …The Hornets were led by Al
Jeffersonin this game , who went 9 - for - 19 from the floor to score 18 points ... It was the
second timein the last three games he ’s posted a double - double , while the two steals matched a season - high for the center …Beal
has turned it on over his last two games , combining for 44 points and 14 rebounds ... This double - double marked thesecond in a rowforWall, who 's combined for 44 points and 22 asssists over his last two games …
Gold
Figure 1: Generated example on ROTOWIRE by us-ing Conditional Copy (CC) as baseline (Wiseman et al.,
2017). Text that accurately reflects records in the table is in red, and text that contradicts the records is in blue.
forecasting and medical monitoring, etc. The lat-ter generates text directly from the table through a standard neural encoder-decoder framework to avoid error propagation and has achieved remark-able progress. In this paper, we particularly focus on exploring how to improve the performance of neural methods on table-to-text generation.
Recently, ROTOWIRE, which provides tables of NBA players’ and teams’ statistics with a de-scriptive summary, has drawn increasing attention
from academic community. Figure1shows an
ex-ample of parts of a game’s statistics and its corre-sponding computer generated summary. We can see that the tables has a formal structure includ-ing table row header, table column header and
ta-ble cells. “Al Jefferson” is a table row header
by a standard Seq2Seq decoder with some
mod-ifications. Wiseman et al. (2017) explored two
types of copy mechanism and found conditional
copy model (Gulcehre et al.,2016) perform better
. Puduppully et al. (2019) enhanced content se-lection ability by explicitly selecting and planning
relevant records.Li and Wan(2018) improved the
precision of describing data records in the gen-erated texts by generating a template at first and
filling in slots via copy mechanism. Nie et al.
(2018) utilized results from pre-executed
opera-tions to improve the fidelity of generated texts. However, we claim that their encoding of tables as sets of records or a long sequence is not suitable. Because (1) the table consists of multiple play-ers and different types of information as shown in
Figure 1. The earlier encoding approaches only
considered the table as sets of records or one di-mensional sequence, which would lose the infor-mation of other (column) dimension. (2) the ta-ble cell consists of time-series data which change over time. That is to say, sometimes historical data can help the model select content. Moreover, when a human writes a basketball report, he will not only focus on the players’ outstanding per-formance in the current match, but also summa-rize players’ performance in recent matches. Lets
take Figure 1 again. Not only do the gold texts
mention Al Jefferson’s great performance in this match, it also states that “It was the second time in the last three games he’s posted a double-double”. Also gold texts summarize John Wall’s “double-double” performance in the similar way. Summa-rizing a player’s performance in recent matches re-quires the modeling of table cell with respect to its historical data (time dimension) which is ab-sent in baseline model. Although baseline model Conditional Copy (CC) tries to summarize it for Gerald Henderson, it clearly produce wrong state-ments since he didn’t get “double-double” in this match.
To address the aforementioned problems, we present a hierarchical encoder to simultaneously model row, column and time dimension informa-tion. In detail, our model is divided into three lay-ers. The first layer is used to learn the represen-tation of the table cell. Specifically, we employ three self-attention models to obtain three repre-sentations of the table cell in its row, column and time dimension. Then, in the second layer, we design a record fusion gate to identify the more
important representation from those three dimen-sion and combine them into a dense vector. In the third layer, we use mean pooling method to merge the previously obtained table cell representations in the same row into the representation of the ta-ble’s row. Then, we use self-attention with content
selection gate (Puduppully et al., 2019) to filter
unimportant rows’ information. To the best of our knowledge, this is the first work on neural table-to-text generation via modeling column and time dimension information so far. We conducted ex-periments on ROTOWIRE. Results show that our model outperforms existing systems, improving
baseline BLEU from 14.19 to 16.85 (+18.75%),
P% of relation generation (RG) from 74.80 to
91.46 (+22.27%), F1% of content selection (CS)
from 32.49 to 41.21 (+26.84%) and content
order-ing (CO) from 15.42 to 20.86 (+35.28%) on test
set. It also exceeds the state-of-the-art model in terms of those metrics.
2 Preliminaries
2.1 Notations
The input to the model are tablesS ={s1, s2, s3}.
s1,s2, ands3 contain records about players’
per-formance in home team, players’ perper-formance in visiting team and team’s overall performance re-spectively. We regard each cell in the table as
record. Each recordrconsists of four types of
in-formation including valuer.v (e.g. 18), entityr.e
(e.g. Al Jefferson), typer.c(e.g. POINTS) and a
featurer.f (e.g. visiting) which indicate whether
a player or a team compete in home court or not. Each player or team takes one row in the table and each column contains a type of record such as points, assists, etc. Also, tables contain the date
when the match happened and we letkdenote the
date of the record. We also create timelines for records. The details of timeline construction is
de-scribed in Section2.2. For simplicity, we omit
ta-ble idland record datekin the following sections
and letri,jdenotes a record ofithrow andjth
col-umn in the table. We assume the records come
from the same table andkis the date of the
men-tioned record. Given those information, the model
is expected to generate texty = (y1, ..., yt, ..., yT)
describing these tables. T denotes the length of
PTS_18 AST_1 REB_12 Row Dimension Column Dimension Time Dimension Self Attention Self Attention Self Attention PTS_14 PTS_17 PTS_18 Al Jefferson Position Embedding 2015_01_28 2015_01_31 2015_02_02 Timeline … PTS_18 AST_1 REB_12 BLK_0 Al Jefferson … PTS_13 PTS_18 PTS_17 PTS_12 Michael Kidd-Gilchrist Al Jefferson Gerald Henderson Gary Neal … … Record Fusion Gate Mean Pooling PTS_17 AST_5 REB_2 … Al Jefferson Gerald Henderson Al Jefferson … Gerald Henderson Brian Roberts Gary Neal Table Cell Representation Table Row Representation Co nte nt Se le cti on G ate Self Attention Dual Attention
The Charlotte Hornets … Al Jefferson… Row Attention
Cell Attention
Decoding
Player PTS AST REB …
Michael Kidd-Gilchrist 13 3 13 …
Al Jefferson 18 1 12 …
Gerald Henderson 17 5 2 …
Brian Roberts 18 3 1 …
… … … … …
Gary Neal 12 1 0 … Hornets Date PTS_18 Al Jefferson 2015_02_02 2015_01_31 2015_01_28 PTS_14 PTS_17 Mean Pooling … Mean Pooling Hierarchical Encoding
Layer 1: record encoders Layer 2 Layer 3: row-level encoder
Figure 2: The architecture of our proposed model.
2.2 Record Timeline Constrcution
In this paper, we construct timelines tl =
{tle,c}E,Ce=1,c=1 for records. E denotes the
num-ber of distinct record entities and C denotes the
number of record types. For each timeline tle,c,
we first extract records with the same entityeand
typecfrom dataset. Then we sort them into a
se-quence according to the record’s date from old to
new. This sequence is considered as timelinetle,c.
For example, in Figure 2, the “Timeline” part in
the lower-left corner represents a timeline for en-tity Al Jefferson and type PTS (points).
2.3 Baseline Model
We use Seq2Seq model with attention (Luong
et al.,2015) and conditional copy (Gulcehre et al.,
2016) as the base model. During training, given
tablesSand their corresponding reference textsy,
the model maximized the conditional probability P(y|S) =QT
t=1P(yt|y<t, S).tis the timestep of
decoder. First, for each record of theith row and
jthcolumn in the table, we utilize 1-layer MLP to
encode the embeddings of each record’s four types
of information into a dense vector ri,j, ri,j =
ReLU(Wa[ri,j.e;ri,j.c;ri,j.v;ri,j.f] + ba).
Wa and ba are trainable parameters. The word
embeddings for each type of information are train-able and randomly initialized before training
fol-lowing Wiseman et al. (2017). [; ] denotes the
vector concatenation. Then, we use a LSTM de-coder with attention and conditional copy to model
the conditional probabilityP(yt|y<t, S). The base
model first use attention mechanism (Luong et al.,
2015) to find relevant records from the input tables
and represent them as context vector. Please note that the base model doesn’t utilize the structure
of three tables and normalize the attention weight
αt,i0,j0across every records in every tables. Then it
combines the context vector with decoder’s hidden
state dt and form a new attentional hidden state
˜
dt which is used to generate words from
vocab-ularyPgen(yt|y<t, S) = sof tmax(Wdd˜t +bd) Also the conditional copy mechanism is adopted
in base model. It introduces a variablezt to
de-cide whether to copy from tables or generate from vocabulary. The probability to copy from table is P(zt= 1|y<t, S) =sigmoid(we·dt+be). Then
it decomposes the conditional probability of
gen-eratingtth word P(yt|y<t, S), given the tablesS
and previously generated wordsy<t, as follows.
P(yt, zt|y<t, S) =
(
P(zt= 1|y<t, S)Pyt←ri0,j0αt,i
0,j0 zt= 1
P(zt= 0|y<t, S)Pgen(yt|y<t, S) zt= 0
(1)
3 Approach
In this section, we propose an effective hierarchi-cal encoder to utilize three dimensional structure of input data in order to improve table represen-tation. Those three dimensions include row,
col-umn and time. As shown in Figure2, during
en-coding, our model consists of three layers includ-ing record encoders, record fusion gate and
row-level encoder. Given tablesS as described in
Sec-tion 2.1, we first encode each record in each
can first find important row then attend to impor-tant record when generating texts. We describe model’s details in following parts.
3.1 Layer 1: Record Encoders
3.1.1 Row Dimension Encoder
Based on our observation, when someone’s points is mentioned in texts, some related records such as “field goals made” (FGM) and “field goals at-tempted” (FGA) will also be included in texts.
Taken gold texts in Figure1as example, when Al
Jefferson’s point 18 is mentioned, his FGM 9 and FGA 19 are also mentioned. Thus, when modeling a record, other records in the same row can be use-ful. Since the record in the row is not sequential, we use a self-attention network which is similar to
Liu and Lapata(2018) to model records in the
con-text of other records in the same row. Letri,jrowbe
the row dimension representation of the record of
ithrow andjthcolumn. Then, we obtain the
con-text vector in row dimensioncrowi,j by attending to
other records in the same row as follows. Please note that αrowi,j,j0 ∝ exp(ri,jT Wori,j0) is
normal-ized across records in the same row i. Wo is a
trainable parameter.
crowi,j = X
j0,j06=j
αrowi,j,j0ri,j0 (2)
Then, we combine record’s representation with
ci,j and obtain the row dimension record
repre-sentationrrow
i,j =tanh(Wf[ri,j;crowi,j ]). Wf is a trainable parameter.
3.1.2 Column Dimension Encoder
Each input table consists of multiple rows and columns. Each column in the table covers one type of information such as points. Only few of the row may have high points or other type of information and thus become the important one. For
exam-ple, in “Column Dimension” part of Figure2, “Al
Jefferson” is more important than “Gary Neal” be-cause the former one have more impressive points. Therefore, when encoding a record, it is helpful to compare it with other records in the same column in order to understand the performance level re-flected by the record among his teammates (rows). We employ self-attention similar to the one used
in Section3.1.1in column dimension to compare
between records. We letrcoli,j be the column
rep-resentation of the record of ith row and jth
col-umn. We obtain context vector in column
dimen-sionccoli,j as follows. Please note thatαj,i,i0is
nor-malized across records from different rows i0 but
of the same columnj. The column dimension
rep-resentationrcoli,j is obtained similar to row
dimen-sion.
ccoli,j = X
i0,i06=i
αcolj,i,i0ri0,j (3)
3.1.3 Time Dimension Encoder
As mentioned in Section1, we find some
expres-sions in texts require information about players’ historical (time dimension) performance. So the
history information of record ri,j is important.
Note that we have already constructed timeline for each record entity and type as described in
Sec-tion2.2. Given those timelines, We collect records
with same entity and type in the timeline which
has date before date k of the record ri,j as
tory information. Since for some record, the tory information can be too long, we set a
his-tory window. Thus, we keep most recent
his-tory information sequence within hishis-tory window
and denote them as hist(ri,j). We model this
kind of information in time dimension via self-attention. However, unlike the unordered nature of rows and columns, the history information is se-quential. Therefore, we introduce a trainable
po-sition embedding embpos(k0) and add it to the
record’s representation and obtain a new record
representationrpk0. It denotes the representation
of a record with the same entity and type ofri,j
but of the date k0 before k in the corresponding
history window. We usertimei,j to denote the
his-tory representation of the record ofithrow andjth
column. Then the history dimension context vec-tor is obtained by attending to hisvec-tory records in the window. Please note that we use 1-layer MLP
as score function here and αtimek,k0 is normalized
within the history window. We obtain the time
di-mension representation ri,jtime similar to row
di-mension.
αtimek,k0 ∝exp(score(rpk,rpk0)) (4)
ctimei,j = X
k0<k
αtimek,k0 rpk0 (5)
3.2 Layer 2: Record Fusion Gate
out from other row’s records of same column, the column dimension representation may have a higher weight in forming the overall record repre-sentation. If a record differs from previous match significantly, the history dimension representation may have a higher weight. Also, some types of information may appear in texts more frequently together which can be reflected by row dimension representation. Therefore, we propose a record fu-sion gate to adaptively combine all three
dimen-sion representations. First, we concatenateri,jrow,
rcoli,j andri,jtime, then adopt a 1-layer MLP to
ob-tain a general representationri,jgenwhich we
con-sider as a baseline representation of records’ infor-mation. Then, we compare each dimension repre-sentation with the baseline and obtain its weight in the final record representation. We use 1-layer
MLP as the score function. Equation6shows an
example of calculating column dimension repre-sentation’s weight in the final record representa-tion. The weight of row and time dimension rep-resentation is obtained similar to the weight of col-umn dimension representation.
αcolf us∝exp(score(ri,jcol,rgeni,j )) (6)
In the end, the fused record representationr˜i,j is
the weighted sum of the three dimension represen-tations.
˜
ri,j =αrowf usrrowi,j +α col
f usri,jcol+α time
f usri,jtime (7)
3.3 Layer 3: Row-level Encoder
For each row, we combine its records via mean
pooling (Equation8) in order to obtain a general
representation of the row which may reflect the
row (player or team)’s overall performance.C
de-notes the number of columns.
rowi=M eanP ooling(˜ri,1,˜ri,2, ...,r˜i,C) (8)
Then, we adopt content selection gate gi, which
is proposed byPuduppully et al. (2019) on rows’
representationsrowi, and obtain a new
represen-tationrow˜ i =girowito choose more
impor-tant information based on each row’s context.
3.4 Decoder with Dual Attention
Since record encoders with record fusion gate provide record-level representation and row-level
encoder provides row-level representation.
In-spired by Cohan et al. (2018), we can modify
the decoder in base model to first choose impor-tant row then attend to records when generating
each word. Following notations in Section 2.3,
βt,i ∝ exp(score(dt,rowi)) obtains the
atten-tion weight with respect to each row. Please note
thatβt,i is normalized across all row-level
repre-sentations from all three tables. Then, γt,i,j ∝
exp(score(dt,r˜i,j))obtains attention weight for
records. Please note that we normalize γt,i,j
among records in the same row.
We use the row-level attention βt,i as guidance
for choosing row based on row’s general represen-tation. Then we use it to re-weight the record-level
attentionγt,i,j and change the attention weight in
base model toα˜t,i,j. Please note thatα˜t,i,j sum to
1 across all records in all tables.
˜
αt,i,j =βt,iγt,i,j (9)
3.5 Training
Given a batch of input tables{S}Gand reference
output {Y}G, we use negative log-likelihood as
the loss function for our model. We train the
model by minimizing L. Gis the number of
ex-amples in the batch andTg represents the length
ofgthreference’s length.
L=−1
G G
X
g=1
Tg X
t=1
logP(yt,g|y<t,g, Sg) (10)
4 Experiments
4.1 Dataset and Evaluation Metrics
We conducted experiments on ROTOWIRE
(Wiseman et al., 2017). For each example, it
provides three tables as described in Section 2.1
which consists of 628 records in total with a long game summary. The average length of game sum-mary is 337.1. In this paper, we followed the data
split introduced in Wiseman et al. (2017): 3398
examples in training set, 727 examples in develop-ment set and 728 examples in test set. We followed
Wiseman et al.(2017)’s work and use BLEU ( Pa-pineni et al.,2002) and three extractive evaluation
metrics RG, CS and CO (Wiseman et al.,2017) for
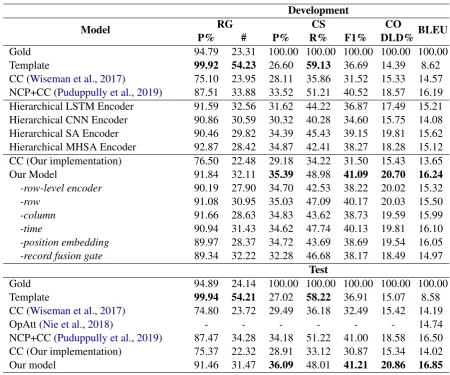
Development
Model RG CS CO BLEU
P% # P% R% F1% DLD%
Gold 94.79 23.31 100.00 100.00 100.00 100.00 100.00
Template 99.92 54.23 26.60 59.13 36.69 14.39 8.62
CC (Wiseman et al.,2017) 75.10 23.95 28.11 35.86 31.52 15.33 14.57
NCP+CC (Puduppully et al.,2019) 87.51 33.88 33.52 51.21 40.52 18.57 16.19
Hierarchical LSTM Encoder 91.59 32.56 31.62 44.22 36.87 17.49 15.21
Hierarchical CNN Encoder 90.86 30.59 30.32 40.28 34.60 15.75 14.08
Hierarchical SA Encoder 90.46 29.82 34.39 45.43 39.15 19.81 15.62
Hierarchical MHSA Encoder 92.87 28.42 34.87 42.41 38.27 18.28 15.12
CC (Our implementation) 76.50 22.48 29.18 34.22 31.50 15.43 13.65
Our Model 91.84 32.11 35.39 48.98 41.09 20.70 16.24
-row-level encoder 90.19 27.90 34.70 42.53 38.22 20.02 15.32
-row 91.08 30.95 35.03 47.09 40.17 20.03 15.50
-column 91.66 28.63 34.83 43.62 38.73 19.59 15.99
-time 90.94 31.43 34.62 47.74 40.13 19.81 16.10
-position embedding 89.97 28.37 34.72 43.69 38.69 19.54 16.05
-record fusion gate 89.34 32.22 32.28 46.68 38.17 18.49 14.97
Test
Gold 94.89 24.14 100.00 100.00 100.00 100.00 100.00
Template 99.94 54.21 27.02 58.22 36.91 15.07 8.58
CC (Wiseman et al.,2017) 74.80 23.72 29.49 36.18 32.49 15.42 14.19
OpAtt (Nie et al.,2018) - - - 14.74
NCP+CC (Puduppully et al.,2019) 87.47 34.28 34.18 51.22 41.00 18.58 16.50
CC (Our implementation) 75.37 22.32 28.91 33.12 30.87 15.34 14.02
[image:6.595.72.523.59.434.2]Our model 91.46 31.47 36.09 48.01 41.21 20.86 16.85
Table 1: Automatic evaluation results. Results were obtained usingPuduppully et al.(2019)’s updated models
texts. CS (Content Selection) measures model’s ability on content selection. CO (Content Order-ing) measures model’s ability on ordering the
cho-sen records in texts. We refer the readers to
Wise-man et al.(2017)’s paper for more details.
4.2 Implementation Details
Following configurations in Puduppully et al.
(2019), we set word embedding and LSTM
de-coder hidden size as 600. The dede-coder’s layer
was set to be 2. Input feeding (Luong et al.,
2015) was also used for decoder. We applied
dropout at a rate 0.3. For training, we used
Ada-grad (Duchi et al., 2010) optimizer with learning
rate of 0.15, truncated BPTT (block length 100), batch size of 5 and learning rate decay of 0.97. For inferring, we set beam size as 5. We also
set the history windows size as 3 from {3,5,7}
based on the results. Code of our model can be
found at
https://github.com/ernestgong/data2text-three-dimensions/.
4.3 Results
4.3.1 Automatic Evaluation
Table 1 displays the automatic evaluation results
on both development and test set. We chose Con-ditional Copy (CC) model as our baseline, which
is the best model in Wiseman et al.(2017). We
included reported scores with updated IE model byPuduppully et al. (2019) and our implementa-tion’s result on CC in this paper. Also, we com-pared our models with other existing works on this
dataset including OpATT (Nie et al., 2018) and
Neural Content Planning with conditional copy
(NCP+CC) (Puduppully et al.,2019). In addition,
we implemented three other hierarchical encoders that encoded tables’ row dimension information in both record-level and row-level to compare with the hierarchical structure of encoder in our model. The decoder was equipped with dual attention (Cohan et al., 2018). The one with LSTM cell
is similar to the one in Cohan et al. (2018) with
(Gehring et al., 2017) has kernel width 3 from
{3, 5} and 10 layer from{5,10,15,20}. The one
with transformer-style encoder (MHSA) (Vaswani
et al.,2017) has 8 head from{8, 10}and 5 layer
from{2,3,4,5,6}. The heads and layers mentioned
above were for both record-level encoder and row-level encoder respectively. The self-attention (SA)
cell we used, as described in Section3, achieved
better overall performance in terms of F1% of CS, CO and BLEU among the hierarchical encoders. Also we implemented a template system same as
the one used inWiseman et al.(2017) which
out-putted eight sentences: an introductory sentence (two teams’ points and who win), six top players’ statistics (ranked by their points) and a conclusion
sentence. We refer the readers toWiseman et al.
(2017)’s paper for more detailed information on
templates. The gold reference’s result is also
in-cluded in Table 1. Overall, our model performs
better than other neural models on both develop-ment and test set in terms of RG’s P%, F1% score of CS, CO and BLEU, indicating our model’s clear improvement on generating high-fidelity, informa-tive and fluent texts. Also, our model with three dimension representations outperforms hierarchi-cal encoders with only row dimension
represen-tation on development set. This indicates that
cell and time dimension representation are impor-tant in representing the tables. Compared to
re-ported baseline result in Wiseman et al. (2017),
we achieved improvement of22.27%in terms of
RG,26.84%in terms of CS F1%,35.28%in terms
of CO and18.75%in terms of BLEU on test set.
Unsurprisingly, template system achieves best on RG P% and CS R% due to the included domain knowledge. Also, the high RG # and low CS P% indicates that template will include vast informa-tion while many of them are deemed redundant. In addition, the low CO and low BLEU indicates that the rigid structure of the template will pro-duce texts that aren’t as adaptive to the given tables and natural as those produced by neural models. Also, we conducted ablation study on our model to evaluate each component’s contribution on de-velopment set. Based on the results, the absence of row-level encoder hurts our model’s performance across all metrics especially the content selection ability.
Row, column and time dimension information are important to the modeling of tables because subtracting any of them will result in performance
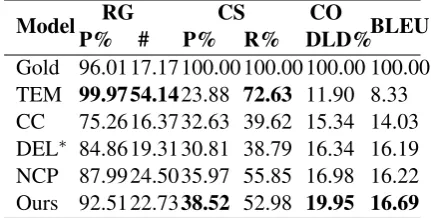
Model RG CS CO BLEU
P% # P% R% DLD%
Gold 96.01 17.17 100.00 100.00 100.00 100.00
TEM 99.97 54.1423.88 72.63 11.90 8.33
CC 75.26 16.37 32.63 39.62 15.34 14.03
DEL∗ 84.86 19.31 30.81 38.79 16.34 16.19
NCP 87.99 24.50 35.97 55.85 16.98 16.22
[image:7.595.310.526.63.172.2]Ours 92.51 22.7338.52 52.98 19.95 16.69
Table 2: Automatic evaluation results on test set. Re-sults were obtained using Wiseman et al. (2017)’s trained extractive evaluation models with relexicaliza-tion (Li and Wan,2018). ∗ We include delayed copy (DEL)’s result in the paper (Li and Wan,2018) for com-parison.
drop. Also, position embedding is critical when modeling time dimension information according to the results. In addition, record fusion gate plays an important role because BLEU, CO, RG P% and CS P% drop significantly after subtracting it from full model. Results show that each compo-nent in the model contributes to the overall perfor-mance. In addition, we compare our model with
delayed copy model (DEL) (Li and Wan, 2018)
along with gold text, template system (TEM),
con-ditional copy (CC) (Wiseman et al., 2017) and
NCP+CC (NCP) (Puduppully et al.,2019).Li and
Wan (2018)’s model generate a template at first
and then fill in the slots with delayed copy
mech-anism. Since its result inLi and Wan(2018)’s
pa-per was evaluated by IE model trained by
Wise-man et al.(2017) and “relexicalization” byLi and
Wan (2018), we adopted the corresponding IE
model and re-implement “relexicalization” as
sug-gested byLi and Wan(2018) for fair comparison.
Please note that CC’s evaluation results via our re-implemented “relexicalization” is comparable to
the reported result inLi and Wan(2018). We
ap-plied them on models other than DEL as shown in
Table2and report DEL’s result from (Li and Wan,
2018)’s paper. It shows that our model outperform
Li and Wan(2018)’s model significantly across all
automatic evaluation metrics in Table2.
4.3.2 Human Evaluation
In this section, we hired three graduates who passed intermediate English test (College English Test Band 6) and were familiar with NBA games to perform human evaluation.
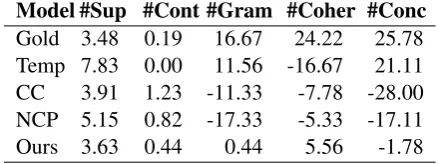
train-Model #Sup #Cont #Gram #Coher #Conc
Gold 3.48 0.19 16.67 24.22 25.78
Temp 7.83 0.00 11.56 -16.67 21.11
CC 3.91 1.23 -11.33 -7.78 -28.00
NCP 5.15 0.82 -17.33 -5.33 -17.11
[image:8.595.71.291.64.146.2]Ours 3.63 0.44 0.44 5.56 -1.78
Table 3: Human evaluation results.
ing set and asked raters to manually check whether the summary contained expressions that need to be inferred from history information. It turns out that
56.7%summaries of the sampled summaries need
history information.
Following human evaluation settings in
Pudup-pully et al.(2019), we conducted the following hu-man evaluation experiments at the same scale. The second experiment is to assess whether the im-provement on relation generation metric reported in automatic evaluation is supported by human
evaluation. We compared our full model with
gold texts, template-based system, CC (Wiseman
et al., 2017) and NCP+CC (NCP) (Puduppully et al.,2019). We randomly sampled 30 examples from test set. Then, we randomly sampled 4 sen-tences from each model’s output for each exam-ple. We provided the raters of those sampled sen-tences with the corresponding NBA game statis-tics. They were asked to count the number of sup-porting and contradicting facts in each sentence. Each sentence is rated independently. We report the average number of supporting facts (#Sup) and
contradicting facts (#Cont) in Table3.
Unsurpris-ingly, template-based system includes most sup-porting facts and least contradicting facts in its texts because the template consists of a large num-ber of facts and all of those facts are extracted from the table. Also, our model produces less contra-dicting facts than other two neural models. Al-though our model produces less supporting facts than NCP and CC, it still includes enough sup-porting facts (slightly more than gold texts). Also, comparing to NCP+CC (NCP)s tendency to clude vast information that contain redundant in-formation, our models ability to select and accu-rately convey information is better. All other re-sults (Gold, CC, NCP and ours) are significantly different from template-based system’s results in terms of number of supporting facts according to one-way ANOVA with posthoc Tukey HSD tests. All significance difference reported in this paper are less than 0.05. Our model is also significantly
different from the NCP model. As for average number of contradicting facts, our model is sig-nificantly different from other two neural mod-els. Surprisingly, gold texts were found contain-ing contradictcontain-ing facts. We checked the raters’s re-sult and found that gold texts occasionally include wrong field-goal or three-point percent or wrong points difference between the winner and the de-feated team. We can treat the average contradict-ing facts number of gold texts as a lower bound.
In the third experiment, following Puduppully
et al. (2019), we asked raters to evaluate those models in terms of grammaticality (is it more flu-ent and grammatical?), coherence (is it easier to read or follows more natural ordering of facts? ) and conciseness (does it avoid redundant informa-tion and repetiinforma-tions?). We adopted the same 30 examples from above and arranged every 5-tuple of summaries into 10 pairs. Then, we asked the raters to choose which system performs the best given each pair. Scores are computed as the differ-ence between percentage of times when the model is chosen as the best and percentage of times when the model is chosen as the worst. Gold texts is sig-nificantly more grammatical than others across all three metrics. Also, our model performs signif-icantly better than other two neural models (CC, NCP) in all three metrics. Template-based system generates significantly more grammatical and con-cise but significantly less coherent results, com-pared to all three neural models. Because the rigid structure of texts ensures the correct grammatical-ity and no repetition in template-based system’s output. However, since the templates are stilted and lack variability compared to others, it was deemed less coherent than the others by the raters.
4.3.3 Qualitative Example
Our model: The Charlotte Hornets ( 21 - 27 ) defeated the Washington Wizards ( 31 - 18 ) 92 - 88 on Monday … The Hornets were led byAl Jefferson, who recorded adouble - doubleof his own with 18 points ( 9 - 19 FG , 0 - 2 FT ) and 12 rebounds . It was hissecond double -doubleover his last three games … The only other Wizard to reach double - digit pointswasKris Humphries, who came off the bench for 13 points ( 4 - 8 FG , 5 - 6 FT ) and five rebounds in 26 minutes …
Figure 3: An generation example of our model based on the same tables in Figure 1. Text that accurately reflects players (Al Jefferson and Kris Humphries) per-formance is in red.
Figure 3 shows an example generated by our
Jef-ferson” from the tables who is neglected by base-line model, which need the model to understand performance difference of a type of data (column)
between each rows (players). Also it correctly
summarize performance of “Al Jefferson” in this match as “double-double” which requires abil-ity to capture dependency from different columns (different type of record) in the same row (player). In addition, it models “Al Jefferson” history per-formance and correctly states that “It was his sec-ond double-double over his last three games”, which is also mentioned in gold texts included in Figure 1 in a similar way.
5 Related Work
In recent years, neural data-to-text systems make remarkable progress on generating texts directly
from data. Mei et al.(2016) proposes an
encoder-aligner-decoder model to generate weather
fore-cast, while Jain et al. (2018) propose a mixed
hierarchical attention. Sha et al. (2018)
pro-poses a hybrid content- and linkage-based
atten-tion mechanism to model the order of content.Liu
et al. (2018) propose to integrate field informa-tion into table representainforma-tion and enhance decoder
with dual attention. Bao et al. (2018) develops
a table-aware encoder-decoder model. Wiseman
et al.(2017) introduced a document-scale data-to-text dataset, consisting of long data-to-text with more re-dundant records, which requires the model to se-lect important information to generate. We
de-scribe recent works in Section 1. Also, some
studies in abstractive text summarization encode
long texts in a hierarchical manner. Cohan et al.
(2018) uses a hierarchical encoder to encode
in-put, paired with a discourse-aware decoder. Ling
and Rush (2017) encode document hierarchically and propose coarse-to-fine attention for decoder.
Recently, Liu et al. (2019) propose a
hierarchi-cal encoder for data-to-text generation which uses
LSTM as its cell. Murakami et al.(2017) propose
to model stock market time-series data and gen-erate comments. As for incorporating historical
background in generation,Robin(1994) proposed
to build a draft with essential new facts at first, then incorporate background facts when revising the draft based on functional unification gram-mars. Different from that, we encode the historical (time dimension) information in the neural data-to-text model in an end-to-end fashion. Existing works on data-to-text generation neglect the joint
representation of tables’ row, column and time di-mension information. In this paper, we propose an effective hierarchical encoder which models infor-mation from row, column and time dimension si-multaneously.
6 Conclusion
In this work, we present an effective hierarchi-cal encoder for table-to-text generation that learns table representations from row, column and time
dimension. In detail, our model consists of
three layers, which learn records’ representation in three dimension, combine those representations via their sailency and obtain row-level representa-tion based on records’ representarepresenta-tion. Then, dur-ing decoddur-ing, it will select important table row be-fore attending to records. Experiments are con-ducted on ROTOWIRE, a benchmark dataset of NBA games. Both automatic and human evalua-tion results show that our model achieves the new state-of-the-art performance.
Acknowledgements
We would like to thank the anonymous review-ers for their helpful comments. We’d also like to thank Xinwei Geng, Yibo Sun, Zhengpeng Xiang and Yuyu Chen for their valuable input. This work was supported by the National Key R&D Program of China via grant 2018YFB1005103 and National Natural Science Foundation of China (NSFC) via grant 61632011 and 61772156.
References
Junwei Bao, Duyu Tang, Nan Duan, Zhao Yan, Yuan-hua Lv, Ming Zhou, and Tiejun Zhao. 2018. Table-to-text: Describing table region with natural lan-guage. In The Thirty-Second AAAI Conference on Artificial Intelligence, pages 5020–5027. Associa-tion for the Advancement of Artificial Intelligence.
Arman Cohan, Franck Dernoncourt, Doo Soon Kim, Trung Bui, Seokhwan Kim, Walter Chang, and Nazli Goharian. 2018. A discourse-aware attention model for abstractive summarization of long documents. In Proceedings of the 2018 Conference of the North American Chapter of the Association for Computa-tional Linguistics: Human Language Technologies, pages 615–621. ACL.
Jonas Gehring, Michael Auli, David Grangier, Denis Yarats, and Yann Dauphin. 2017. Convolutional se-quence to sese-quence learning. InProceedings of the 34th International Conference on Machine Learn-ing, pages 1243–1252. JMLR.
Dimitra Gkatzia. 2016. Content selection in data-to-text systems: A survey.
Caglar Gulcehre, Sungjin Ahn, Ramesh Nallapati, Bowen Zhou, and Yoshua Bengio. 2016. Pointing the unknown words. InProceedings of the 54th An-nual Meeting of the Association for Computational Linguistics, pages 140–149. ACL.
Parag Jain, Anirban Laha, Karthik Sankaranarayanan, Preksha Nema, Mitesh M. Khapra, and Shreyas Shetty. 2018. A mixed hierarchical attention based encoder-decoder approach for standard table sum-marization. InProceedings of the 2018 Conference of the North American Chapter of the Association for Computational Linguistics: Human Language Technologies, pages 622–627. ACL.
Liunian Li and Xiaojun Wan. 2018. Point precisely: Towards ensuring the precision of data in generated texts using delayed copy mechanism. In Proceed-ings of the 27th International Conference on Com-putational Linguistics, pages 1044–1055. ACL.
Jeffrey Ling and Alexander Rush. 2017. Coarse-to-fine attention models for document summarization. In Proceedings of the Workshop on New Frontiers in Summarization, pages 33–42. ACL.
Tianyu Liu, Fuli Luo, Qiaolin Xia, Shuming Ma, Baobao Chang, and Zhifang Sui. 2019. Hierarchical encoder with auxiliary supervision for neural table-to-text generation: Learning better representation for tables. InProceedings of the AAAI Conference on Artificial Intelligence, pages 6786–6793. Associ-ation for the Advancement of Artificial Intelligence.
Tianyu Liu, Kexiang Wang, Lei Sha, Baobao Chang, and Zhifang Sui. 2018. Table-to-text generation by structure-aware seq2seq learning. In The Thirty-Second AAAI Conference on Artificial Intelligence, pages 4881–4888. Association for the Advancement of Artificial Intelligence.
Yang P. Liu and Mirella Lapata. 2018. Learning struc-tured text representations. Transactions of the Asso-ciation for Computational Linguistics, 6:63–75.
Thang Luong, Hieu Pham, and Christopher D. Man-ning. 2015. Effective approaches to attention-based neural machine translation. In Proceedings of the 2015 Conference on Empirical Methods in Natural Language Processing, pages 1412–1421. ACL.
Hongyuan Mei, Mohit Bansal, and Matthew R. Walter. 2016. What to talk about and how? selective gen-eration using LSTMs with coarse-to-fine alignment. InProceedings of the 2016 Conference of the North American Chapter of the Association for Computa-tional Linguistics: Human Language Technologies, pages 720–730. ACL.
Soichiro Murakami, Akihiko Watanabe, Akira Miyazawa, Keiichi Goshima, Toshihiko Yanase, Hi-roya Takamura, and Yusuke Miyao. 2017. Learning to generate market comments from stock prices. In Proceedings of the 55th Annual Meeting of the Association for Computational Linguistics, pages 1374–1384. ACL.
Feng Nie, Jinpeng Wang, Jin-Ge Yao, Rong Pan, and Chin-Yew Lin. 2018. Operation-guided neural net-works for high fidelity data-to-text generation. In Proceedings of the 2018 Conference on Empirical Methods in Natural Language Processing, pages 3879–3889. ACL.
Kishore Papineni, Salim Roukos, Todd Ward, and Wei-Jing Zhu. 2002. Bleu: a method for automatic eval-uation of machine translation. In Proceedings of 40th Annual Meeting of the Association for Compu-tational Linguistics, pages 311–318. ACL.
Ratish Puduppully, Li Dong, and Mirella Lapata. 2019. Data-to-text generation with content selection and planning. In Proceedings of the AAAI Conference on Artificial Intelligence, pages 6908–6915. Associ-ation for the Advancement of Artificial Intelligence.
Ehud Reiter and Robert Dale. 2000. Building natural language generation systems. Cambridge university press.
Jacques Robin. 1994. Revision-based generation of natural language summaries providing historical background: corpus-based analysis, design, imple-mentation and evaluation. Ph.D. thesis.
Lei Sha, Lili Mou, Tianyu Liu, Pascal Poupart, Sujian Li, Baobao Chang, and Zhifang Sui. 2018. Order-planning neural text generation from structured data. InThe Thirty-Second AAAI Conference on Artificial Intelligence, pages 5414–5421. Association for the Advancement of Artificial Intelligence.
Ashish Vaswani, Noam Shazeer, Niki Parmar, Jakob Uszkoreit, Llion Jones, Aidan N. Gomez, Lukasz Kaiser, and Illia Polosukhin. 2017. Attention is all you need. InAdvances in Neural Information Pro-cessing Systems, pages 5998–6008. Curran Asso-ciates, Inc.