International Journal of Science Engineering and Advance Technology (IJSEAT)
ISSN 2321-6905, Vol. 7, Issue 9, September -2019
A Simulation Based Study on Heat Dissipation In
Ventilated Break Disk
1Nama Rahul, 2Dr.T. Dharmaraju, Ph.D. 1PG Student, Adarsh College of Engineering, Chebrolu.
2
Professor,Adarsh College of Engineering, Chebrolu.
1,2
Department of Mechanical Engineering.
Abstract
Braking system is one of the significant security parts of a vehicle. It is for the most part used to decelerate vehicles from an underlying rate to a given speed. A A friction based braking system is a common device is a typical gadget to change over kinetic energy into thermal energy through a grating between the brake cushions and the rotor faces. Since high temperatures can prompt overheating of the brake liquid, seals and different segments, the halting ability of a brake increments with the rate at which heat is scattered because of constrained convection and thermal limit of the system.
In this present work thermal investigation of ventilated circle brakes is examined by differing the vent geometry so as to expand the heat dispersal with a prospect to build the plate life and diminish the opportunity of disappointment because of thermal load without irritating the auxiliary figures. Ansys multi-material science is utilized for examination and Catia is utilized for modeling.
Key words- thermal break system, heat dissipation, convection.
1. INTRODUCTION
A plate brake is a kind of brake that utilizations calipers to press sets of cushions against a circle or "rotor" to make erosion. This activity eases back the turn of a pole, for example, a vehicle pivot, either to diminish its rotational speed or to hold it stationary. The vitality of movement is changed over into wasteheat which must be scattered[1-8].
Using pressurized water activated plate brakes are the most usually utilized type of brake for engine vehicles, however the standards of a circle brake are relevant to practically any pivoting shaft.
Revised Manuscript received on September 10, 2019 *Corresponding Author
Nama Rahul
mail id- [email protected]
Plates for cruisers, bikes, and numerous vehicles regularly have openings or spaces sliced through the circle. This is improved warmth dissemination, to help surface-water dispersal, to lessen commotion, to diminish mass, or for advertising beautifying agents.
Opened circles have shallow channels machined into the plate to help in evacuating residue and gas. Opening is the favored strategy in most hustling conditions to
evacuate gas and water and to deglaze brake cushions. A few plates are both bored and opened. Opened plates are commonly not utilized on standard vehicles since they rapidly wear out brake cushions; be that as it may, this evacuation of material is valuable to race vehicles since it keeps the cushions delicate and dodges vitrification of their surfaces. Out and about, bored or opened plates still have a beneficial outcome in wet conditions in light of the fact that the gaps or openings forestall a film of water working up between the circle and the cushions
2.Modeling of Ventilated Break Disk
2.1 Introduction:
There are various typify of drawings required in the dissimilar fields of engineering and science. In elder days, various delineationimplements like drafting shape, T-equality, scale etc., are necessity to load drawings gently and carefully. But to keepmelioratesatisfaction in modifying the design and from calculations, the process of buskaattractive is made in the computer second-hand certain software’s. This utility of computer systems is condition as electronic computerassist design. It replaces manual dragging with a machine-driven an apophysis[9].
2.1.1 Advantages of Cad
Reduced labour.
Less amount of time for drawing.
Minimum wastage of materials for drawing.
Higher accuracy in drawing.
Evolution of better design.
2.1.2 LIMITATIONS OF CAD
Large size of the software package.
Skilled labour with accurate judgment.
Initial investment is very high.
2.2 CAD Tools
The process of express three-dimensional show in a computer is called modelling. Design weapon in a software aid to finish the goal of mold the product effectively. Designers always front for the puppet that foresee them with fast and reliable solutions to sketch geometric weapon from development the analysis to make optimal the result. In between these two extremes, the show tools are used for endurance analysis, number property calculations, and finite constitutepattern and analysis.
2.3 CATIA–Introduction
CATIA which stands for Computer Aided Three-dimensional Interactive Application is CAD software owned and developed by Dassault Systems and marketed worldwide by IBM. It is the world’s suggestion CAD/CAM software for show and manufacturing. CATIA secondmanifoldstation of outcomegrowth through formularizing, intend, engineering and manufacturing.
2.3.1 Advantages of Catia
Modification of model became much easier and accurate.
It enables life like experience of the model by making the virtual representation to appear as realistic as possible.
It is much faster than the previously existing design software’s
2.3.2Design of The Product Through Catia
The manufacturing industries need to consider the demands of customer and thereby the market while manufacturing a product. In order to meet these requirements in an accurate way, synthesis and analysis of the performance of product must be studied prior to its manufacture. Synthesis is crucial to design an analysis
A financial estimate to transform the idea of conceived product into reality is also made with the help of synthesis. Various mechanical properties and functionality of the designed model can be predicted accurately during analysis process. By synthesis of the product virtually, it becomes easier for the manufacturers to get a better idea of the product to be manufactured
2.3.3 Geometric Modelling
The computer compatible mathematical description of geometry of an object is called geometric modelling. The CAD software allows the mathematical
description of the object to be displayed as an image on the computer. Various steps for creating a geometric modelling are:
Creation of basic geometric elements by using commands like points, lines and circles. Transformation of the basic elements based on
requirements by using commands like scaling, rotating and joining.
Creation of geometric model by using various commands that cause the integration of the elements into desired shape.
3. ANALYSIS ON VETILATED BREAK DISK
3.1 Specific capabilities of ANSYS
Basic
Basic examination is presumably the most widely recognized use of the limited component strategy as it suggests extensions and structures, maritime, aeronautical, and mechanical structures, for example, dispatch bodies, air ship bodies, and machine lodgings, just as mechanical segments, for example, cylinders, machine parts and devices
Static Analysis - Used to decide relocations, stresses, and so forth under static stacking conditions. ANSYS can process both direct and nonlinear static investigations. Nonlinearities can incorporate pliancy, stress hardening, huge avoidance, enormous strain, hyper versatility, contact surfaces, and creep.
Transient DynamicAnalysis - Used to decide the reaction of a structure to discretionarily time-fluctuating burdens. All nonlinearities referenced under Static Analysis above are permitted.
Clasping Analysis - Used to compute the clasping loads and decide the clasping mode shape. Both straight (Eigen esteem) clasping and nonlinear clasping examinations are conceivable.
Notwithstanding the above examination types, a few particular reason highlights are accessible, for example, Fracture mechanics, Composite material investigation, Fatigue, and both p-Method and Beam investigations.
3.2. Heat
International Journal of Science Engineering and Advance Technology (IJSEAT)
ISSN 2321-6905, Vol. 7, Issue 9, September -2019
the impacts of consistent warm stacks on a frameworkor part. Clients frequently play out an enduring state investigation before doing a transient warm examination, to help set up introductory conditions. An unfaltering state examination likewise can be the last advance of a transient warm investigation; performed after every single transient impact have reduced. ANSYS can be utilized to decide temperatures, warm slopes, heat stream rates, and warmth transitions in an item that are brought about by warm stacks that don't fluctuate after some time. Such loads incorporate the accompanying:
Radiation
Heat flow rates
Heat fluxes (heat flow per unit area)
Heat generation rates (heat flow per unit volume)
3.3 Boundary conditions in Ansys On Break
Disc-Pictures representing the Fixed Points, Pressure, Convection, Heat flux in the ventilated break disc.
Fig. 3.1 Fixed points in disk
Fig. 3.2 Pressure in disk
3.3.1 Design and Meshing of Ventilated disc break with materials Grey cast iron, Structural steel, aluminum alloys–
Pictures describes the meshing with the material of the ventilated break disc.
Fig. 3.3 Meshing
3.4 Pictorial reports from anysis for Model-1 Ventilated Disk Break
3.4.1 Model 1: Results with Material-Cast Iron
International Journal of Science Engineering and Advance Technology (IJSEAT)
ISSN 2321-6905, Vol. 7, Issue 9, September -2019
the impacts of consistent warm stacks on a frameworkor part. Clients frequently play out an enduring state investigation before doing a transient warm examination, to help set up introductory conditions. An unfaltering state examination likewise can be the last advance of a transient warm investigation; performed after every single transient impact have reduced. ANSYS can be utilized to decide temperatures, warm slopes, heat stream rates, and warmth transitions in an item that are brought about by warm stacks that don't fluctuate after some time. Such loads incorporate the accompanying:
Radiation
Heat flow rates
Heat fluxes (heat flow per unit area)
Heat generation rates (heat flow per unit volume)
3.3 Boundary conditions in Ansys On Break
Disc-Pictures representing the Fixed Points, Pressure, Convection, Heat flux in the ventilated break disc.
Fig. 3.1 Fixed points in disk
Fig. 3.2 Pressure in disk
3.3.1 Design and Meshing of Ventilated disc break with materials Grey cast iron, Structural steel, aluminum alloys–
Pictures describes the meshing with the material of the ventilated break disc.
Fig. 3.3 Meshing
3.4 Pictorial reports from anysis for Model-1 Ventilated Disk Break
Fig. 3.4Temperature Variation after 1 sec time, on outer surface temperature minimum of 15.358 deg And maximum 461.3 in disk.
Fig. 3.5 Heat Flux Distribution in material cast iron with minimum of 2.7844e-w/mm2 And maximum of
1.7977w/mm2 in the disk.
3.4.2 Model 1: Results with Materialstructural steel
Fig. 3.6 Temperature Variation after 1 sec time, on outer surface temperature Min of 15.358 deg And Max 461.3 in disk
Fig. 3.7 Heat flux Distribution in material steel with min of 2.5057e-5 and max of 1.875w/mm2 in disk
Fig. 3.8 Equivalent stress in material Stell with min of 12.357 Mpa And maxi of 809.55 Mpa in disk.
Fig. 3.9 Equivalent elastic strainin material aluminum with min of 4.4166e-6 mm /mm And max of 0.0012625 mm/mm in disk.
Fig. 3.4Temperature Variation after 1 sec time, on outer surface temperature minimum of 15.358 deg And maximum 461.3 in disk.
Fig. 3.5 Heat Flux Distribution in material cast iron with minimum of 2.7844e-w/mm2 And maximum of
1.7977w/mm2 in the disk.
3.4.2 Model 1: Results with Materialstructural steel
Fig. 3.6 Temperature Variation after 1 sec time, on outer surface temperature Min of 15.358 deg And Max 461.3 in disk
Fig. 3.7 Heat flux Distribution in material steel with min of 2.5057e-5 and max of 1.875w/mm2 in disk
Fig. 3.8 Equivalent stress in material Stell with min of 12.357 Mpa And maxi of 809.55 Mpa in disk.
International Journal of Science Engineering and Advance Technology (IJSEAT)
ISSN 2321-6905, Vol. 7, Issue 9, September -2019
Fig. 3.10Temperature Variation after 1 sec time, on outer surface temperature min of 222.054 deg And max 318.09 in disk
Fig. 3.11 Equivalent stress in material aluminum with min of 0.27694 MpaAnd max of 105.69 Mpa
Fig. 3.12 Temperature Variation after 1 sec time, on outer surface temperature min of 15.554 deg And max 437.56 in disk.
4. Results and Discussions
From the analysis done on the break disk with the materials grey cast iron. Steel, aluminum
alloys and the results are shown below with tabular forms and graphical representation
4.1 Table contains Grey Cast Iron Temperature and Total Heat flux
values-4.2 Table contains structural steel Temperature and Total heat flux
values-4.3 Table contains aluminium alloy Temperature and Total heat flux
values-Structural Steel
Temperature total heat flux
Min max min max
Model 1 16.299 434.73 2.51E-05 1.875
Model 2 16.36 434.14 4.39E-05 2.5026
Model 3 16.467 427.79 3.17E-05 1.9995
Model 4 16.488 410.3 2.56E-05 6.8544
International Journal of Science Engineering and Advance Technology (IJSEAT)
ISSN 2321-6905, Vol. 7, Issue 9, September -2019
Fig. 3.10Temperature Variation after 1 sec time, on outer surface temperature min of 222.054 deg And max 318.09 in disk
Fig. 3.11 Equivalent stress in material aluminum with min of 0.27694 MpaAnd max of 105.69 Mpa
Fig. 3.12 Temperature Variation after 1 sec time, on outer surface temperature min of 15.554 deg And max 437.56 in disk.
4. Results and Discussions
From the analysis done on the break disk with the materials grey cast iron. Steel, aluminum
alloys and the results are shown below with tabular forms and graphical representation
4.1 Table contains Grey Cast Iron Temperature and Total Heat flux
values-4.2 Table contains structural steel Temperature and Total heat flux
values-4.3 Table contains aluminium alloy Temperature and Total heat flux
values-Structural Steel
Temperature total heat flux
Min max min max
Model 1 16.299 434.73 2.51E-05 1.875
Model 2 16.36 434.14 4.39E-05 2.5026
Model 3 16.467 427.79 3.17E-05 1.9995
4.4 Table Contains Total Deformation, EE strain and E Stress values
4.5 Table contains total deformation, EE strain and E Stress
values-4.6 Table contains total deformation, EE strain and E Stress
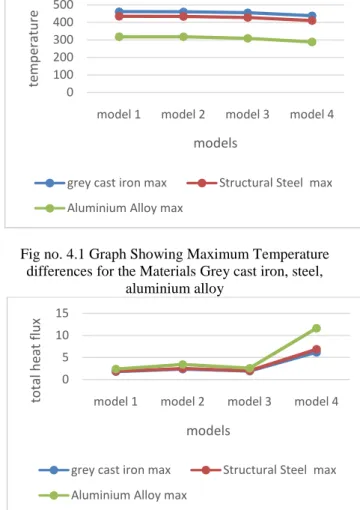
values-Fig no. 4.1 Graph Showing Maximum Temperature differences for the Materials Grey cast iron, steel,
aluminium alloy
Fig no. 4.2 Graph Showing Maximum Heat Flux (w/mm2) differences for the Materials Grey cast iron,
steel, aluminium alloy
Fig no. 4.3 Graph Showing Minimum Temperature differences for the Materials Grey cast iron, steel,
aluminium alloy EE Strain- equivalent elastic strain
0 100 200 300 400 500
model 1 model 2 model 3 model 4
te
m
pe
ra
tu
re
models
grey cast iron max Structural Steel max Aluminium Alloy max
0 5 10 15
model 1 model 2 model 3 model 4
to
ta
l h
ea
t f
lu
x
models
grey cast iron max Structural Steel max Aluminium Alloy max
0 5 10 15 20 25
model 1 model 2 model 3 model 4
te
m
pe
ra
tu
re
models
International Journal of Science Engineering and Advance Technology (IJSEAT)
ISSN 2321-6905, Vol. 7, Issue 9, September -2019
E Stress- equivalent stressFrom Fig no4.4 The minimum values are observed for Equivalent elastic strain for materials Grey cast iron, structural steel are gradually increased for models 1 and 2.But for model 3 to 4 the EE strain is gradually decreased for the three materials.
Fig no. 4.4 Graph Showing Minimum Equivalent Elastic Strain differences for the Materials Grey cast iron, steel, aluminium alloy
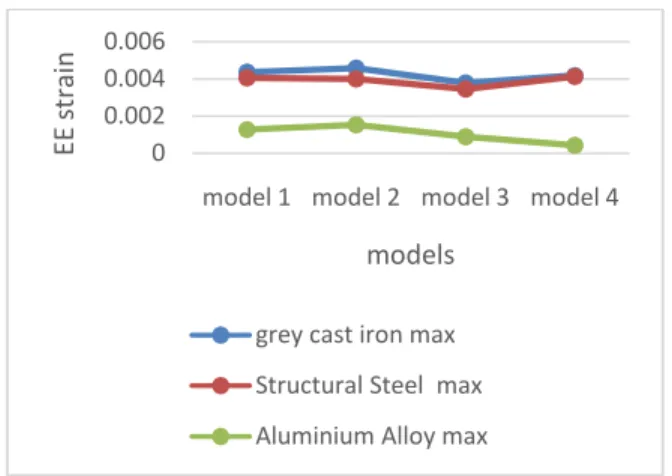
From Fig no4.5 The maximum values table observed for Equivalent elastic strain for material Grey cast iron are increased to model 1 to 2 and 3to 4,for model 2 to 3 EE strain is gradually decreased.
Fig no. 4.5 Graph Showing Equivalent Maximum Elastic Strain differences for the Materials Grey cast iron, steel, aluminium alloy
For material Structural steel the maximum values for EE strain from table 4.4 are observed that strains are decreased from model 1 to 3 and increased from 3 to 4 gradually. For material aluminiumalloys are reduced to model 2 to 4 from fig no 4.5
Fig no. 4.6 Graph Showing Maximum Equivalent stress (Mpa) differences for the MaterialsGrey cast iron, steel, aluminium alloy
From fig no4.6 and 4.7 it is observed that maximum and minimum EE stress for the materials Grey Cast Iron, Steel ,aluminium are reduced to model 2 to 4.from table 4.4 and 4.5 the EE stress are increased to model 2 to 3 and reduced to model 3 to 4 respectively.
Fig no. 4.7 Graph Showing Minimum Equivalent stress (Mpa) differences for the Materials Grey cast iron, steel, aluminium alloy
Fig no. 4.8 Graph Showing Maximum Total Deformation (mm) differences for the Materials Grey
cast iron, steel, aluminium alloy 0.00E+00
5.00E-05 1.00E-04 1.50E-04
model 1 model 2 model 3 model 4
EE
st
ra
in
models
grey cast iron min Structural Steel min Aluminium Alloy min
0 0.002 0.004 0.006
model 1 model 2 model 3 model 4
EE
st
ra
in
models
grey cast iron max Structural Steel max Aluminium Alloy max
0 500 1000
model 1 model 2 model 3 model 4
E
St
re
ss
models
grey cast iron max Structural Steel max Aluminium Alloy max
0 5 10 15
model 1 model 2 model 3 model 4
E
St
re
ss
models
grey cast iron min Structural Steel min Aluminium Alloy min
0 1
model 1 model 2 model 3 model 4
tot
al
de
for
m
at
ion
models
Discussion:
In the temperature distribution graph it is evident that lowest maximum temperature is recorded in model 4 and also maximum heat flux is developed in model 4 from fig no. 4.1 and 4.2
From fig 4.8 it is noticed that the deformations are gradually decreasing with each model, aero foil shaped vines break disk (model 4) has lowest deformation. From fig 4.4 it is noticed that lowest strains are recorded in model 4.
it is noticed that the Circular shaped vines shaped disk break (model 2) the strains are more when compared with model 1 but these strains are gradually decreased over model 3 and model 4 from fig no. 4.4 and 4.5
5. CONCLUSIONS
In this work 4 models of disk brakes are modelled and studied in Ansys workbench for thermal and thermo mechanical stress. All the models are developed from the dimensions of an existing model of the disk break, these models are subjected to both thermal and structural loading these loads are calculated using standard formulation. The observations made during this study are listed below
In Circular shaped vines break disk (Model 2) and Oval shaped vines disk break (model 3) Mechanical Strength is increased but the thermal efficiency is reduced. Lowest temperature is recorded in Aero foil shaped disk break (Model 4) with highest flux of four models. Low temperature at low flux indicates better thermal conductive nature. Structural strength is measured in terms of low stress, strain, deformation profile.
Aero foil vine design in break disk (Model 4) has shown better results when compared with other three models when analyzed with materials cast iron, structural steel and aluminum. Performance of model 4 is better with all the materials has applied.
Aero foil vine Shaped design in break disk (Model 4) in which vines are designed in aero foil has the best structural and thermal performance with all the materials has been applied to the break disk.
Aero foil vines Shaped design in break disk (Model 4) has the best structural and thermal performance with material aluminum alloys.
Future scope
All though this is study is a success full in finding best model for good thermo- mechanical performance, experimentation and theoretical addition to this work is very important. But no experimentation and theoretical work is done in this work due to lack of equipment and literature, any experimental and theoretical work in this field is preferable.
REFERENCES
[1] Abdo, J., Experimental technique to study tangential to normal contact load ratio, Tribology Transactions 48 (2005) 389–403.
[2] Abu Bakar, A. R., Ouyang, H., Wear prediction of friction material and brake squeal using the finite element method, Wear 264 (11–12) (2008) 1 069–1 076 .
[3] Altuzarra, O., Amezua, E., Aviles, R., Hernandez, A., Judder vibration in disc brakes excited by thermoelastic instability, Engineering Computations 19 (4) (2002) 411–430.
[4] Choi, B. K., Park, J. H., Kim, M. R., Simulation of the braking condition of vehicle for evaluating thermal performance of disc brake, Proceedings of KSAE Autumn Conference, 2008, pp. 1 265–1 274.
[
5] Dhaubhadel, M. N., Review: CFD applications in the automotive industry, Journal of Fluids Engineering 118 (4) (1996) 647–653.
[6] Gao, C. H., Lin, X. Z., Transient temperature field analysis of a brake in a non-axisymmetric threedimensional model, Journal of Materials Processing Technology 129 (2002) 513–517.
[7] Hudson, M., Ruhl, R., Ventilated brake rotor air flow investigation, SAE Technical Paper 971033, 1997.
[8] Jacobsson, H., Aspects of disc brake judder, Proceedings of the Institution of Mechanical Engineers, Part D: Journal of Automobile Engineering 217 (6) (2003) 419–430.