Abstract—A neural network simulator built for prediction of milling tool wear in cutting process is discussed. Experiments are conducted on an existing laboratory equipment to generate training and test data. The cutting current of the singular value decomposition (SVD) noise reduction and cutting parameters are employed to train network. Network train is carried out for a variety of inputs. The adaptability of different cutting conditions is investigated. The networks are validated for test data with unknown tool wear and established tool wear net model can calculate tool wear value in different cutting conditions satisfactorily.
Keywords —radical basic function network; tool wear;
singular value decomposition.
I. INTRODUCTION
Wear and wear condition of metal cutting tool directly effect the precision, efficiency and economic benefit of machining process, so monitoring wear of cutting tool are becoming more and more significant. On-line tool wear monitoring is an important topic to flexible manufacture system. In recent years, several monitoring methods have been developed by researchers. But few can be applicable to practical production. Although some of them can be applied, it is difficult to popularize for practical application because of rigorous requirements and limitations to the working condition[1-12] .
In the cutting process, techniques for tool wear monitoring are being used widely using the current of machine tool spindle and feed[13-15]. It does not interference with cutting
process by measurement equipment and the machine tool didn’t formed by reworking process. But it is a key problem how to find mathematical models between cutting current and cutting parameters in research and develop monitor current.
In this paper, a tool wear model of radial basic function network(RBFN) is obtained based on cutting current .Tool wear net model is trained by selecting reasonable factors related to tool wear and adopting several groups’ data of tool wear in different cutting conditions, then forecasts tool wear.
Manuscript received October 9, 2008.
XU Chuangwen is with the Department of Mechanical Engineering, Lanzhou Polytechnic College, China (e-mail: xuchuangwen@ 126.com).
FAN Xing is with with the Department of Mechanical Engineering, Lanzhou Polytechnic College, China.
LUO Wencui is with with the Department of Mechanical Engineering, Lanzhou Polytechnic College, China .
II. RBFN
A radial basis function network (RBFN) is a hybrid learning neural network, which is a two-layer fully-connected network with an input layer which performs no computation. RBFN is a type of neural network using local receptive field. Here is the RBFN shape. Its structure is shown in Fig.1. It consists of following three layers:
Fig.1 Structure of RBFN
1) Input t layer: X =
(
x1,x2"xN)
T is a N dimension input vector.2) The hidden layer: Learning in the hidden layer is performed by using an unsupervised method, the K-means algorithm. First, the user must choose a number of centers and this number will correspond to the number of neurons in the hidden layer. The K-means algorithm is used to position the centers in the best way, i.e. each presented record is attached to its nearest center (or cluster). As it is an unsupervised learning method, only the inputs data are presented to the K-means algorithm. The radial basis functions are then applied to each center: There is one radial Gaussian function for each hidden unit which simulates the effect of overlapping and locally tuned receptive fields. Weights between nodes in the input layer and in the hidden layer are identically equal to 1.The activation function of the hidden nodes is radially symmetric in input space; the magnitude of the activation given by a particular record is a decreasing function of the distance between the input vector of the record and the center of the basis function. The distance metric employed is the Euclidean distance. The activation of the hidden neuron j with presented pattern X has the form
⎟ ⎟ ⎟
⎠ ⎞
⎜ ⎜ ⎜
⎝
⎛ −
− =
2 2
2 exp
j j j
C X u
σ j=1,2,",m (1)
Research of Tool Wear Based on Radical Basic
Function Network
XU Chuangwen FAN Xing LUO Wencui
x1
x2
xN
y(1)
y(2)
Where X is the network input vector,
(
)
TN x x x
X = 1, 2" ;Cj =
(
c1j,c2j"cNj)
T is a vector with the same dimension as Xand it is the center of the Gaussian function for jth hidden node; σj is the width of the central function, which is the range of the control function, also named variance. Where the Euclidean distance is(
)
∑
= − = − = N i ij i jj X C x c
L
1
2 j=1,2,",m; and
N i=1,2,", (2) Each hidden unit has an associated σ ‘width’ value which defines the nature and scope of the unit’s receptive field response. It is equivalent to the standard deviation of the width of the Gaussian response, so larger values allow more points to be included.
The closer presenting pattern to the center, the higher the response. This response will always be between 0 and 1 (The response will be 1 only if the presented pattern is identical to the center). The width of the ‘bell’ shape depends on the value of σ : The bigger the value of σ , the larger the width of the ‘bell’ shape. The value of σ is computed according to the distance between the corresponding cluster and its 2 closest one. The user can’t neither choose the value of σ nor the way it’s computed.
The role of the hidden units is to perform a non-linear transformation of the input space into the space of activations of the hidden units. It is this representation that gives the RBF a much greater representational power than the linear perceptron.
3)The output layer: Learning in the output layer is performed by computing a linear combination of the activation of the basis functions, parameterised by the weights ω between hidden and output layers. Objective function of net is as follows
( ) ( )
[
]
∑
= − = N i i i yx x y N e 1 2 ˆ 2 1 (3)Wheree is the total average error; yˆ
( )
xi is the actual output relative to input xi ; y( )
xi is expectation output relative to inputxi;N is numbers of training samples.In order to make objection function reach the minimum, the gradient descent method can be used to modify weights
ωwhich is from net hidden layer to output layer:
( )
( )
j i i j η yex yωx ω Δ ∂ ∂ ⋅ ∂ ∂ − = ˆˆ (4) Where μ is learning rate, its range of value is from 0 to 1. The adjusting amount of each step ωis confirmed according to Equation (3) and (4) listed, and it is as follows
( ) ( )
[
]
∑
= − − = N i j i ij N y x yx u
1 ˆ η ω
Δ (5)
j j
j ω ω
ω = +Δ (6) Net output is as follows
( )
=∑
ω( )
+θ=
m j
j ju x x
y 1
(
7) III. BACKGROUND THEORY
Measurable tool wear signals typically have very low signal-to-noise ratio because of the variety of noise sources in the milling process. However, relatively little work has been done on tool wear signal enhancement and noise reduction. For tool wear classification, most monitoring systems either use the noisy signals directly without pre-processing, or simply lowpass filter the signal to average out the corrupting noise sources While relatively easy to implement, these techniques have proven to be generally ineffective at reducing the noise and tend to remove information necessary for proper tool wear classification. To choose more effective signal enhancement and noise reduction algorithms, we first need to examine the tool wear signal and noise generating processes .The noise can exist in the obtained data because there is much error during the process of collecting the initial data and much system error of the machine tools itself as well. The noise reduction must be done before obtaining the sample data.
A. The singular value decomposition (SVD)
In the singular value theory, SVD of m×n dimension matrix X (r≤rmax ≤min
( )
m,n )that any of their rank is equal to r is shown as X =UΛVT , where U and V respectively is m×rmax and n×rmax dimensions orthogonal matrix, and UUT =I , VVT =I .) , , , (
diag 1 2 rmax
Λ= λ λ " λ is a diagonal matrix and its main diagonal element is all nonnegative value and arranges according to following order: λ1 ≥λ2 ≥"≥λrmax >0 , where λ1,λ2,",λrmaxis the singular value of the matrixX , U and V respectively is the left and right singular matrix ofX.
Supposed the time series measured cutting current signal isx
( )
i ,i=1,2,3,",N, a m×n dimensions matrix is composed according to certain method.( )
( )
( )
( )
( )
(
)
( ) (
)
(
)
⎥ ⎥ ⎥ ⎥ ⎦ ⎤ ⎢ ⎢ ⎢ ⎢ ⎣ ⎡ + + + = m n x n x n x m x x x m x x x m " # # # # " " 1 1 3 2 2 1D (8)
Where Dm is known as the reconstruction attractor orbital matrix and it can be expressed as Dm =D+W . D is a m×n dimension matrix which is composed by non-noise time series and W is also a m×n dimensions matrix which is composed by noise time series. SVD of Dmis as follows
(
Λ Λ)
V U V U V D WU V U Dm + = + = + = = T 2 T 1 T 2 1
T Λ Λ
Λ
signals are not of noise or its signal-to-noise ratio is very high, Λ=diag
(
λ1,λ2,"λk,0,",0)
; if the series signals include noise or are of the low signal-to-noise ratio,(
1, 2, 1, 2, max)
diagλ λ "λk+ λk+ "λr =
Λ . In the calculating
process, if the mand n is not too small, the attractor orbital matrixDm must be singular and the noise signals W is a column with full rank matrix .According to SVD theory, k
maximum singular value(k<rmax)is selected and other singular values are equal to 0, then a matrix D is obtained in the reverse process of the singular value decomposition. Therefore, the slick response signals D is an optimum approximation matrix without noise and its rank is r.
B. Reconstruction method
The contribution rate of the singular value is as follows
∑
=
= max
1 2 2/r
j j i
i λ λ
s j=1,2,",rmax (10) If the signal is slick and don’t include the noise, the first several values of {si} are big, and others are equal to 0. If the signal includes the noise, {si} is not equal to 0. Because the energy of the noise signal is wide on the frequency domain distribution, singular value is far less than the primary signals. Therefore, the value after the point in the si ~i curve that the drops and then becomes smooth contributes to the noise. Make their singular value equal to 0, and a new matrix can be obtained.
C The Time Series
A method to reconstruct the phase space was proposed by Packard based on single variable time series[16] . Supposed the time series of a dimension
observation is xi =x(ti),ti =t0+iΔt ,i=1,2,",N . m dimension phase space is constructed in terms of sampling with equal space length and time delay τ ,τ is integral times of Δt .m dimension phase space is defined as follows
( )
{
i i τ i τ i m τ}
i mτ x x x x
X , = , + , +2 ,", +( −1)
i=1,2,",N−(m−1)τ (11)
Where m is embedding dimension, τ is time delay andτ =KΔt,Δt is interval time between sampling data and
K is random integer. According to Tankens’ embedding theory, the method obtaining condition vector Xi from time series xi is called time delay embedding method. Embedding dimensionm and time delay τ must be selected carefully in order to give really expression to the dynamical characteristic from the measuring signal based on time delay embedding method . Tankens’ embedding theory fails to show the principle of selecting the time delay, but only consider that as long as embedding dimension fills withm≥2D+1, reconstruction phase space and the system phase space are differential coefficient homeomorphism, that is, topology equivalence, their dynamical characteristic is completely similar in the qualitative sense. When D
dimension attractor can embed in m≥2D+1 dimension phase space, the geometry characteristic of the initial
attractor can be reappeared, and the evolvement law of the system can be researched.
When the phase space is reconstructed, the selection of time delay τ must assure that every component is relative independence. That is, the relativity of the phase space ordinate is as less as possible. Autocorrelation correlation function and mutual information method are very ordinary methods in selecting the time delay. In this thesis mutual information method is used to select the time delay because it is more advanced[17-18] .
Mutual information principle: supposed the states of the discrete variable X andY are m and n , their entropy function is defined as follows
( )
∑=
− = m
i pi pi X
H
1 ln (12) Where pi is probability which variableX appears in the istate. The combination entropy of the variable XandY is defined
(
)
ijm i
n j pij p
Y X
H ∑ ∑
= =
− =
1 1 ln
, (13) Where pij is probability that variable Xappears in the
istate and variable Y appears in the jstate . According to the definition of the entropy of X andY and combination entropy of XandY, the mutual information can be derived as follows
(
X Y)
H( )
X H( )
Y H(
X Y)
I , = + − , (14) The total dependency of two variables can be measured by the mutual information function. Because the mutual information value of the first minimum is less and the two-double inception is differentiated more clearly, the dynamic characteristic of the attractor can be analyzed qualitatively and qualitatively through reconstructing the phase space. It is a better method to select time delay. Therefore, the optimal value is ascertained by using the average mutual information method, that is, selecting time delay when the mutual information function reaches the minimum firstly as time delay τ reconstructing the phase space. The relation between the mutual information and the time delayτ is shown in Fig.3. According to the mutual information method, the time delay of the time series signals of the current is ascertained, that is,τ=1 .
Embedding dimension mis usually obtained from time series phase space reconstruction according to formula m≥2D+1.But such embedding dimension is not sure of minimum embedding dimension. Although much large embedding dimension can reconstruct the phase space such calculation easily increases other statistic complexity and is easily disturbed by outside noise. So it is necessary to search a minimum embedding dimension to reconstruct completely the phase space. Selection of common embedding dimension has system saturation method, false neighboring method and Liangyue Cao method and so on. The method of selecting the embedding dimension was proposed by Liangyue Cao in 1997[19].
among them, the minimum embedding dimension mwas decided byE1
( )
m , and pointed out when E1( )
m tends to be steadily in along with the evolution, the corresponds valuemis the minimum embedding dimension. At the same time, E2( )
m can not be used to obtain the minimum embedding dimension, but it has a very good function ,that is, it can be used to distinguishing random series or chaotic series from time series .It is random series if( )
mE2 is equal to 1 or is near to 1 to anym. Therefore, to real chaotic series, E2
( )
m can not be equal to 1 to anym. Generally, E2( )
m tends to 1 to a real chaotic series. Thus, it is a direct and simple method to decide whether the time series has fractal characteristic of the chaos series. In Fig.4, the minimum embedding dimension extracted by Cao method is nearly 10. Therefore, the singular value decomposition matrix is consisted of 10×1015 dimensions whereN−(m−1)τ=1024−(
10−1)
×1=1015.0 5 10 15 20
1 2 3 4 5
Time delay τ Mut
ual i nf or mat
io n
(a) The tool wear initial stage
0 5 10 15 20
1 2 3 4 5
Time delay τ Mut
ual i nf or mat
io n
(b) The tool wear normal stage
0 5 10 15 20
1 2 3 4 5 6
Time delay τ Mut
ual i nf or mat
io n
(c) The tool wear acute stage
Fig.3 The relation curve between mutual information
2 4 6 8 10 12 14 0
0.2 0.4 0.6 0.8 1
The embedding dimension m
Full line indicates E1(m).Dotted line indicates E2(m).*indicates the tool wear initial
.stage.+indicates the tool wear normal stage .o indicates the tool wear acute stage . Fig.4 The minimum calculation dimension on Gao method
E1
an
d
E2
IV. EXPERIMENTAL RESULTS
We select v、 f 、 ap 、 Is 、 If as the input parameters of RBFN . They are representative of cutting speed, feed speed, cutting depth, cutting current of spindle and feed current. The tool wear VB is nonlinear function of these parameters and is in the form
(
v f ap Is If)
F
VB= , , , , (15) The parameters (v、 f 、ap、Is、If )concerned with the cutting tool wear is as input patterns of RBFN. VB is as the output target. The essence of training process is approximation to the function, which is nonlinear mapping from original input patterns to target output VB in the multidimensional space. If the effect factors of tool wear are covered reasonably by original input patterns, RBFN model can correctly estimate and forecast the cutting tool wear VB
based on training RBFN.
To a particular CNC machine tools, there is a strict correspondence between v′、f′and a′p detected from the drive unit and actual v、f andap. If the curves of this correspondence relation is established, the actual v、f andap
can be obtained easily. In data acquisition, A/D conversion chip is used for each analog signal, chose the XZCS6AND7 to start up multiple A/D conversion at the same time through logic circuit, and read conversion data from every highway was latched. At firstly, the data was processed by using above-mentioned theory of the singular value decomposition and the method of noise reduction.
The vector of the working condition recognition is
constituted by the parameters v 、 f
andΔI.ΔI=
(
It −It−1)
/T , In the equation, T is sampling cycle according to experiences, It is current at time of t,1
−
t
I is current at time of t-1. Whether the working condition recognition on machine tool is rapid feed, work feed or stop is judged by the vector (v、f、ΔI). The rules of working condition recognition are shown in Tab.1.
Tab.1 The working condition recognition parameters condition
v f ΔI rapid feed working feed stop — f ≥ fhigh ΔI≤ΔIhigh +
— f < flow ΔI<ΔIlow + low
v
v> fhigh≥ f > flow ΔI≥ΔIhigh + The model Isi(v)(orIfi(f) ) is corrected by this
no-load current, then the no-load current model is changed with real-time tracking current variety.
In order to testify the rationality and practicability of the RBFN model, a lot of experiments were done. In the experiment process, the high speed steal tool and the 45# steal workpiece material are used to do it. Higher hardless material is used for the cutting experiment in order to run tool wear up. Take the turn from little to more to cut according to the tool wear. On different wear stage, the current value is collected about 12 sets and every value is the average of 640 sets data. The milling experimental condition is shown in Tab.2.
Tab.2 Cutting experiment condition
Material High-speed steel Type End milling cutter Cutting
tool
Diameter(mm) 14
Equipment XKA714 Milling method Climb milling
Workspace material Thermal refining 45 steel Cutting speed/(m/min) 8.792∼21.98
Feed speed/(mm/min) 20∼35
Cutting depth/mm 2∼5
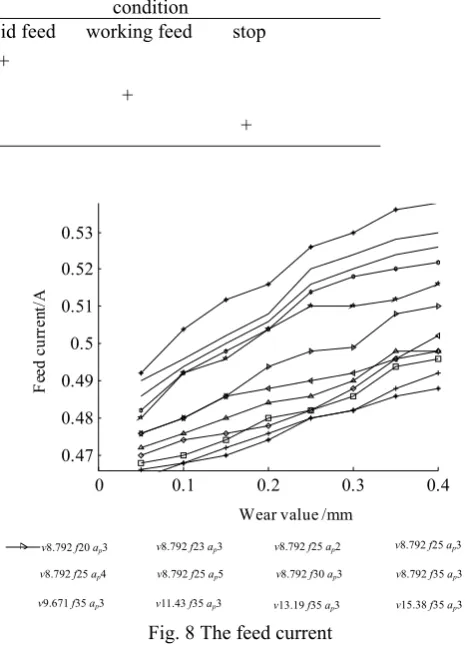
96 groups experimental data of the spindle cutting current and feed current are obtained in different cutting conditions as the tool value is equal to 0.05mm、0.1mm、0.15mm、 0.2mm、0.25mm、0.3mm、0.35mm、0.4mm. As it is shown in Fig.7 and Fig.8, every curve is obtained in the same cutting condition.
0 0.1 0.2 0.3 0.4
1.1 1.2 1.3 1.4 1.5 1.6 1.7 1.8
Wear value /mm
Sp
in
dl
e c
ur
ren
[image:5.595.308.542.77.403.2]t/A
Fig. 7 The spindle cutting current
0 0.1 0.2 0.3 0.4
0.47 0.48 0.49 0.5 0.51 0.52 0.53
Wear value /mm
F
ee
d cu
rr
en
t/
A
v15.38 f35 ap3
v8.792 f20 ap3 v8.792 f23 ap3 v8.792 f25 ap2 v8.792 f25 ap3
v8.792 f25 ap4 v8.792 f25 ap5 v8.792 f30 ap3 v8.792 f35 ap3
v9.671 f35 ap3 v11.43 f35 ap3 v13.19 f35 ap3
Fig. 8 The feed current
RBFN is trained by sample set constituted of the 96 groups of current data and cutting parameters. With the increase in the number of neurons, the scope of network squared error is observed by selecting appropriate initial weights and deviation. Then trained network weights and deviation are kept to memory. The simulation result of RBFN model is shown in Fig.9.
From Fig.9, the linear correlation coefficient R between the network forecast and measured values is 0.92, and the result is a good degree of satisfaction. In order to verify the reliability of the network recognition, firstly, 16 groups of new testing samples are obtained randomly according to Tab.2. Secondly, calculation valueVB′ is calculated by trained artificial neural network model. Finally, Compared with actual tool wear valueVB, the result is shown in Tab.3.
[image:5.595.62.270.587.756.2]affecting tool wear are more complex, so the forecast accuracy is not particularly desirable[20-21].
0 0.1 0.2 0.3 0.4
0 0.1 0.2 0.3 0.4
Measured value VB/mm
Cal
cu
lat
ed
v
al
ue
VB
´
/m
m
Fig. 9 Network model simulation result
I. CONCLUSION
There is a consanguineous relation between the current of machine tool spindle and feed and the cutting tool wear in cutting process. In this paper, the non-linear mapping of the original model of multidimensional space to the cutting tool wear is constructed using the radial basis function network. This method does not need to build a mathematical model of the cutting tool wear, and has better adaptability because the artificial neural network function has the self-study, associative memory and non-linear map characteristic and can effectively remove the influence of uncertainty factors in cutting process. The experiments show the model is applicable to monitor the milling tool wear in cutting process. It can be used to accurately control the normal or fierce wear, and further studies are needed to monitor the initial stages of the wear.
REFERENCES
[1] C.W. Xu, H.l.Chen, “A Research of tool wear recognizing based on wavelet packet pretreated and neural network,”Journal of System Design and Dynamics, The Japan Society of Mechanical Engineers , 2007, 1 (4) : 611- 612.
[2] P. W. Prickett , C. Johns. “An overview of approaches to end milling tool monitoring,” Machine Tools and Manufacture, 1999, 39:105-122.
[3] E. Jantunen, “A summary of methods applied to tool condition monitoring in drilling,” Machine Tools and Manufacture, 2002, 42:997-1010.
[4] L. Wang, M.G. Mehrabi, “Hidden Markov model-based tool wear monitoring in turning,” Manufacturing Science and Engineering, 2002, 124(3):651-658.
[5] J. Kopac, S. Sali, “Tool wear monitoring during the turning process,” Materials Processing Technology, 2001, 113:312-316.
[6] A. Dragos, “Tool condition monitoring in broaching,” Wear, 2003, 254:370-382.
[7] H. L. Wang, H. Shao, “On-line tool breakage monitoring in turning,” Materials Processing Technology, 2003, 139:237-242.
[8] M.A.Mannan, A.Kassim, “Application of image and sound analysis techniques to monitor the condition of cutting tools,” Pattren Recognition Letters, 2000, 21:969-979.
[9] D. E. Dimla “The Correlation of vibration signal features to cutting tool wear in a metal turning operation ,” Materials Processing Technology, 2002, 19(10):705-713.
[10] K. Jemielnlak, L. Kwlatkowski, P .Wrzosek, “Diagnosis of tool wear based on cutting forces and acoustic emission measures as inputs to a neural network,” Intelligent Manufacturing, 1998,9(5): 447-455. [11] P. Srinivasa Pai , P. K. Ramakrishna Rao, “Acoustic emission alysis
for tool wear monitoring in face milling,” Production Research, 2002,40(5): 1081- 1093.
[12] S. V. Kamarthi, S. R. T. Kumara, P. H. Cohen, “Flank wear estimation in turning through wavelet representation of acoustic emission signals,” Manufacturing Science and Engineering, 2000,122(1): 12-19.
[13] H. Shao, H. L .Wang, X. M. Zhao, “A cutting power model for tool wear monitoring in milling ,” Machine Tools & Manufacture ,2004,44: 1503-1509.
[14] C. W. Xu , “ Design and research for tool wear monitoring,” Journal of Harbin Institute of Technology, 2003, 35(1): 76-80.
[15] L. L Xiao, S. K. Tso, “Drill wear monitoring based on current signals ,” Wear, 1999, 231: 172-178.
[16] N. H .Packard, “ Geometry from a time series,”Phys Rev, 1980 ,45 :712-716.
[17] S .B. Wang, X. Y. Li, Y. D .Cao , “Deformation measurements using mutual information : principle and applications,” Optics and Lasers in Engineering , 2005, 43 (7 ) : 895-903.
[18] D.Erdogmus, “Minimax mutual information approach for independent component analysis,” Neural Computation, 2004, 16 (6 ) : 1235-1252.
[19] Liangyue Cao, “ Practical method for determining the minimum embedding dimension of a scalar time series,” Physical D, 1997, 110 (1 ) : 43-50.
[20] J.M.Zheng, “On identification of tool wear by multiple features fusion based on artificial neural network,” Mechanical Science and Technology,2002, 21 (1 ) : 111-114.
[21] M.Q.Zhu, “ Sensor fusion via neural networks for estimation of tool wear,” ACTA Aeronautical ET Astronautic Sinica,2002, 18 (1 ) : 121-116.