ECONOMIC
THE
RESEARCH
INSTITUTE
Irish County Incomes in
~96o
by
E. A. ATTWOOD and R. C. GEARY
September, x963
Paper No. I6.
THE
ECONOMIC RESEARCH INSTITUTE
EXECUTIVE BOARD z962-63
J. J. McELL1GOTr, M.A.,
LL.D.,President of the Institute.
G. O’BRIEN, D.LITT., LITT.D., Chairman of the Executive Board.
C. S. ANDREWS, B.COMM., D.ECON.SC., Chairman, C6ras Iompair l~ircann.
J. P.
BEDDY, D.ECON.SC., LL.D.Chairman and Managing Director, The Industrial Credit Company Ltd.
R. D. C. BLACK, PH.D.,
Professor, Department of Economics, The Queen’s University, Belfast.
J. BUSTEED, M.COMM.,
Professor, Department of Economics, University College, Cork.
G. A. DUNCAN, S.F.T.C.D.,
Professor of Political Economy, Trinity College, Dublin.
R. C. GEARY, D.SC., D.ECON.SC.~ Director of the Institute.
W. A. HONOHAN, M.A., F.I.A.,
Secretary, Department of Social Welfare.
M. D. McCARTHY, M.A., PH.D., Director, Central Statistics Office.
J. F. MEENAN, M.A., B.L.,
Professor of Political Economy, University College, Dublin.
C. K. MILL, B.A., D.SC.,
Joint Managing Director, Arthur Guinness Son & Company (Dublin) Ltd.
D. NEVlN,
Research Officer, Irish Congress of Trade Unions.
L. O’BUACHALLA, M.COMM.,
Professor, Department of Economics, University College, Galway.
J. C.
TONGE,Federation of Irish Industries.
T. WALSH, D.SC.,
Director, An Foras Taldntais.
T. K.
WHITAKER, M.SC. (ECON.), D.ECON.SC., Secretary, Department of Finance.GERALD WILSON,
Director, Bank of Ireland, Dublin.
CONTENTS
i.
Introduction
2. Acknowledgements
3. Plan of the Paper
4. Methods Used
5.
Appraisal of Statistical Reliability of Tables I and 2
6.
Conclusion
Tables
Notes to Tables
Appendix--Component Analysis
Page
rI
I
2
4
8
9
22
Irish County Incomes in I96o
and R. C. GEARY*
by E. A. ATTWOOD
1. Introduction
This paper owes its inception to a problem
which the Taoiseach (Prime Minister), Mr. Se~n
F. Lemass, T.D., at the Opening Ceremony on
6 June, x96I, asked the Institute to examine, in the
following
terms’--"The Minister for Finance has already raised
the questions whether the present system is
adequate or appropriate to deal with the increasing
activities of local bodies or whether a more
rational or more effective system could be devised.
There is a situation developing in local authority
operations, and their financing, which requires
consideration. Investigations, under the auspices
of the Institute, of certain aspects, including the
economic aspects, of the incidence of local
tax-ation covering such matters as the effect of the
local rate charge on enterprise and development,
and the possibilities of providing Local Authorities
with new sources of income, will provide some
basic material which will be invaluable in the
review of local finance which the Minister for
Local Government intends to undertake".
One paper on this topic has already been
pub-lished, t Another paper is in preparation in which
our present findings will be taken into account.
Apart from its main purpose the appended
estimates of county incomes may be put to many
uses, amongst them the following:
i. Market planning by business concerns;
2. Regional studies of location of industry;
3. A wide variety of social studies;
4. Cross section analyses on econometric lines
with a view to establishing relationships
between level of income and various causative
factors;
*E. A. Attwood is Head, Agricultural Economics and Farm Management Division of An Eoras Talttntais. R. C. Geary is Director of The Economic Research Institute. The authors
are responsible for the contents of the paper including the
views expressed therein.
tLocal Government Finance in Ireland : ,4 Preliminary Survey, by David Walker. Economic Research Institute,
Paper No.
5-5. Regional economic planning and appraisal of
results achieved in time.
Actually studies have begun within the Institute
falling under more than one of these general
head-ings, using data from the appended tables.
2. Acknowledgements
This work could not have been completed without
the help of many organisations. It is pleasing to
state that all the information required was ful!y and
willingly supplied by the
following:--Central Statistics Office
All Government Departments (through
Depart-ment of Finance) for data summarized in
Table 7.
Revenue Commissioners
Department of Social Welfare
Department of Local Government
Department of Education
Department of Lands
An Foras Talfintais (The Agricultural Institute)
Irish Banks Standing Committee
Electricity Supply Board
C6ras Iompair ]~ireann (Irish Transport Service)
Bord na M6na (Turf Board)
Bord F~filte (Tourist Board)
We are indebted in a special way to the Central
Statistics Office which supplied many returns of
unpublished material, and for many consultations
during the course of the work, in addition to the
published statistics on which our work was based.
The nature and extent of our indebtedness to all
the organisations named will be apparent from the
text and the Notes to the tables. Of course,
responsi-bility for the contents of this paper is ours alone.
3. Plan of the Paper
Tables 3-1I have all been used in the preparation
of Tables i and u. This is the main justification for
their presentation here, though it is hoped that they
will be found useful in themselves. The tables,
therefore, have no pretentions to being a statistical
compendium of Irish counties. It might be of
interest to produce such a compendium, displaying
comprehensively all the principal demographic,
economic and social data for counties, but such is
not our object here.
Our main purpose was to estimate the statistics
of personal income displayed in col. 6 of Table 2.
These figures are designed to represent the incomes
in i96o, from all sources, of persons normally
resident in each county. The principal difficulty
which we encountered was that the statistical
sources on which we mainly relied were not compiled
on an individual residential basis. For instance, two of
our principal sources were the Census of Industrial
Production i958 (Table 5) and the Census of
Dis-tribution i956 (Table 6). The basic statistical unit in
these cases was the establishment, and the assumption
had to be made, in the first instance, that the county
of residence of persons (workpeople or proprietors)
coincided with the county in which the
establish-ment was located. As regards employee
remunera-tion probably no serious error is introduced by this
assumption, though many important Irish towns are
located on or near county boundaries. Perhaps the
same assumptions might safely be made with regard
to profits of farms and other unincorporated
enter-prises. It is quite otherwise with limited companies;
there is no reason for assuming that shareholders
reside in the county in which the enterprise is
carried on; and the situation is further complicated
by the fact that the enterprise may consist of several
establishments located in different counties. The
"head office" effect (whereby a large part of profit
and probably some share of employee income) is
attributed to the location of the head office
(over-whelmingly Dublin) precluded our using data
available to the Revenue Commissioners (see
Table Io) as a major source for our basic estimate,
though these data proved very useful for checking
and appraisal purposes. As far as unemployment
benefit and unemployment assistance are concerned
the unit of distribution is the local office of the
Department of Social Welfare and recipients do not
all reside in the county of the Office. For by far the
greater part we have ignored this locatlonal difficulty.
The expedients to which we had to have recourse
generally in the transition from income arising to
personal income are described in the Notes to
Table 2.
The same difficulty largely accounts for our
failure to produce corroborative estimates of
personal incomes and, as we had hoped, county
estimates of personal saving by approaching the
problem of estimation from the expenditure side.
This aspect is dealt with in section 5 below.
4. Methods Used
It may be well to point the distinction between
the two concepts of income used in this paper,
namely "income arising" and "personal income".
Income arising is the income created within the
borders of each county in i96o. It is very like
"earned income". As well as income in cash it
includes income in kind, the most important
constitutent of which is consumption of own
produce in farm households (valued, incidentally,
at farm and not retail prices). Personal income, on
the other hand, is income receivable by households
from all sources, whether earned or not. The
manner of derivation of personal income from
income arising should be clear from Table 2 and
the notes thereto. It will be seen that, to obtain
personal income, elements like emigrants’
remit-tances, social welfare payments, dividends
receiv-able, etc., have to be added to income arising but
corporate allocations to reserves, dividends payable,
etc., have to be deducted.
Estimates of income arising (Table I) in each
county were based on Table Az in the Central
Statistics Office compilation National Income and
Expenditure, i96i in which the following figures for
I96O are
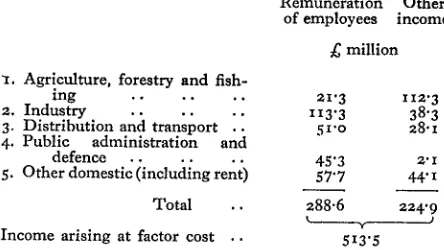
displayed:--Remuneration Other of employees income
£ million
"x. Agriculture, forestry and
fish-ing ... 21’3 II2"3
2. Industry ... 113.3 38.3
3. Distribution and transport 5I"o 28.i 4. Public administration and
defence ... 45’3 2" i
5. Other domestic (including rent) 57"7 44" I
Total ¯ ¯ 288.6 224"9
J Y
Income arising at factor cost .. 513"5
[image:6.625.326.548.422.547.2]with the ten national totals shown above, were
"forced" into the national totals. These distributors
varied greatly in statistical quality ranging from
county series which encompassed a large fraction
of the national aggregate (e.g. output of cattle,
industrial employee remuneration) to series (e.g.
numbers engaged in small industry in x95x) rather
remote in time or character from the entity to be
distributed.
Fairly extensive use was made of the I951 Census
of Population as distributors in the non-agricultural
sectors. It is not considered that the remoteness of
the Census date seriously prejudices the accuracy
of the estimates since a rough allocation of the
county population in I96o into (a) agricultural and
(b) other, indicates that changes in (b) in the aggregate
in the period i95x-6i are not considerable; in fact,
the showing is a slight increase in almost all counties,
the decline in the total population in all counties
except Dublin being attributable to the agricultural
population. Population distributors have the merit
that they are residential in character since the census
unit is the household (except as regards institutions)
and county of allocation is therefore county of
residence.
The transition from county income arising to
personal income on a residential basis is indicated
in Table 2. In full detail the steps are as follows:
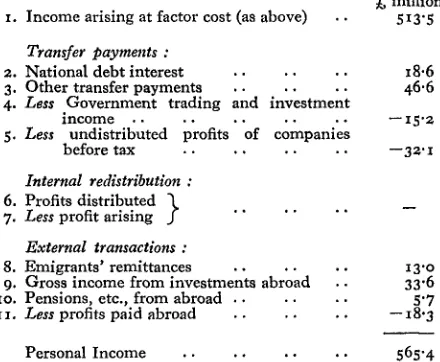
£ million L Income arising at factor cost (as above) ¯ ¯ 513"5
Transfer payments :
2. National debt interest ... I8.6 3. Other transfer payments ... 46.6
4. Less Government trading and investment
income ... -- xS’Z
5. Less undistributed profits of companies
before tax ... --3z’x
Internal redistribution :
6. Profits distributed ~
7. Less profit arisingf ... External transactions :
8. Emigrants’ remittances ... 13’o 9. Gross income from investments abroad ¯ ¯ 33"6 xo. Pensions, etc., from abroad ... 5"7
ix. Less profits paid abroad ... --x8"3 Personal Income ... 565-4
The total of personal income of £565.4 million
agrees, of course, with the figure given for i96o in
Table A5 of National Income and Expenditure, i96I.
Each of these eleven constituent series was separately
distributed between counties, the distributors being
described in the Notes to Table 2. The values for
transitional items 3 and 8 only have been
distinguish-ed in Table 2, as worthy of crdistinguish-edence. All the rest
have been merged in col. 5--"other adjustments"
--the aggregate value being only minus £7"7 million,
in the hope that errors in the very large positive
and negative values for some of the constituent
items will largely cancel out and that the figures
shown in the column will be reasonably dependable.
It will be observed that the effect of this column
has been for the most part to transfer a large
amount (£33.i million) of income arising from
Dublin to the remaining counties.
It will be observed that no attempt has been
made to distinguish, in the personal income Table 2,
between employee and other remuneration or
between sectors as in Table i. The reason is fairly
obvious. In Table i the figures purport to show
income arising, which is not to be confused with
income enjoyed. In particular, the income received
by persons whose principal occupation is in
agricul-ture, forestry and fishing is significantly larger than
that shown in col. 4 of Table I even from the gainful
employment of persons living on farms. It is
well-known, in particular, that many family members
living on small farms, whose principal occupation
is farming, regularly obtain employment on road
[image:7.625.65.285.387.568.2]work during the slack agricultural seasons and the
Census of Population i95i revealed the remarkable
fact that no fewer than 36 % of the non-agriculturally
occupied population of Connacht lived on
agricul-tural holdings of £2 valuation or over. We cannot
estimate the non-agricultural income of the
house-holds of farmers and farm workers. A similar
obser-vation applies to unearned income. We do not know
how much of emigrants’ remittances, social security
payments, etc., go to households in the different
economic sectors. For these reasons only a single
figure for personal incomes in each county can be
aspired to.
This may be a suitable point at which to observe
that, following the national accounting convention,
farmers’ household consumption of own produce
has been valued at the prices received by farmers
for produce sold--see col. I2 of Table 3. This
subsistence element in county income is large in
the small-farming counties of the west and
north-west and it may be well to bear in mind that for
comparisons of welfare between a county like Mayo
at the one extreme and Dublin at the other
allowance should be made for the fact that a large
part of the food consumption and fuel in Mayo is
valued at farm, instead of at retail prices.*
5. Appraisal of Statistical Reliability
of Tables 1 and 2
No extravagant claim can be made for the accuracy
of the county income estimates, even when the
official national aggregates, themselves estimates,
are regarded as absolutely correct. This general
appraisal will have been almost self-evident from
what has gone before and from the methodological
Notes to the tables which follow. It goes without
saying, in the first place, that expressing the figures
in these tables to the nearest £I,OOO does not imply
any belief on our part that we regard the figures as
accurate to the unit place; the figures are set down
as they emerge from the calculations as described
and we leave them as they are, for our own
arith-metical convenience. As already stated, each
con-stituent in the various aggregates has been estimated
by recourse to county distributors (on the pro rata
principle), some very good, as encompassing in
themselves a large part of the national aggregate,
ranging through a whole spectrum of reliability to
dubious population distributors admittedly remote
from the value entity to be estimated. That the
distributor is dubious is no great matter when the
constituent is small (say under £xo million) but it
is quite otherwise when, as is apparent from Table 2,
the amounts distributed by remote control are of
the order of £5o million. In the Table 2 case,
how-ever, which marks the transition from income arising
to personal income, a mitigating circumstance is that
some of the signs are + and some --, the national
aggregate largely cancelling out. This, of course, is
by no means the case at county level, as will be
clear from the comparison of columns 2 and 6 of
Table 2 where the transition, largely a redistribution
effect between counties, is seen to involve a
con-siderable decrease in the Dublin income arising and
an increase in most of the other twenty-five counties,
the increase being relatively greatest (see Table 12,
col. 7) in the poorer counties of the north-west.
Still, in general effect this column is reassuring for
its consistency.
As a general opinion, we think that, as regards
income arising (Table I), estimates of sector
4--public administration and defence--are the most
reliable, as based on exact data for the year 1958-59
(see Table 7) carried forward to our year of reference
196o. Then follows sector I--agriculture, forestry,
fishing--for which the estimates of product and
cost were made in considerable commodity and
service detail and, for some large constituents, the
distributors were in good agreement, in the aggregate
and independently, with the corresponding national
aggregates. Industry, largely covered county-wise
by the 1958 Census of Industrial Production and
supplementary exact information, may be accorded
a fairly high rating; perhaps sector 3--distribution
and transport--would not be far below sector 2.
Certainly sector 5--other domesticwhas the lowest
reliability rating.
As regards non-agriculture as a whole, estimates
of employee remuneration, covered by exact
information to the extent of over one-half, are of
far-higher statistical quality than estimates of other
income. So much for income arising (Table I). For
reasons indicated in a previous paragraph,
estimates of personal income (Table 2) are of more
dubious quality than the estimates of income
arising.
The more doubtful the estimates the more
necessary is it to try to check, by comparison, in
whole or in part, these estimates with suitable
correlatives. Such comparisons have been revealing
in showing up the particular counties for which the
estimates of personal income are probably too high
or too low. As will appear, the series of comparisons
was on an elaborate scale, leaving us with the
impression that the estimates of personal income
which emerged from our calculations for certain
counties were too low and in a few others rather
high. Having come to so definite a conclusion we
were confronted with a problem of statistical ethics
--do we alter the original estimates in the direction
of general conformity with the correlatives? We
decided against this course for the following
reasons:w
(i) In our view, the correlatives were, as regards
all counties, less reliable than those which
we adopted; if the case were otherwise we
would obviously have adopted the
correla-tives as estimates or bases of estimate;
(ii) The adjustments would, in magnitude,
contain too large an element of guess-work;
we are here in a different situation from that
of random sampling estimates in which
probabilistic confidence limits could be set
to estimates;
(iii)
If some of the estimates be not accepted by
users of the material, the users may make
their own adjustments in the light of our
correlatives (which we present fairly fully)
or on other evidence; they will do so on
their own responsibility and we shall not
object.
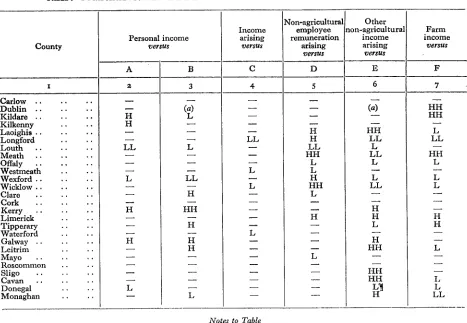
We divide the correlatives into two main groups:
(i) Component analysis;
(ii) Five other aggregations.
240t ¯ 230
220 2|O 200
--190
o
~. 18o
8
170
t! O
160 I50 140 130
Chart: Scatter Diagram and Regression for Personal Income per Head on Principal Component in Irish Counties
I t I I I I I I 1 I
I
16
1
I
I
I
I
I
I
i F
I F
I
I
I
I
I
I
I
17 I& 19 20 2| 22 23 24 25 26 27 28 2.9 30 31 32 Z:3 34 ~Cipal Component
Sources : Appendix Table A3, col. 2 ; Table 12, col. 6.
Regression : Y=73.2446+4.4928Zx, Zx=26.23, Y=I91.08. Broken lines are 5% and Io% above and below the regression line.
240
220 210 20O tD
0
9o
~
g
i80 o 170 ~
the seven series in Table 11 explains, of itself, most
of the variability in personal income per head
between counties; it is also shown that the
correla-tion between income per head and this principal
component is as high as "9. We draw the inference
that a measure of confidence may be reposed in the
estimates of personal income in general, despite
the animadversions expressed in the foregoing
paragraphs.
It will obviously be desirable, however, to
investigate how the individual county figures stand
up to this test. In the Chart, county personal
incomes per head are graphed against principal
component values, for the seven series in Table 1i;
also displayed is the least squares regression line of
incomes on component, as well as the simple
average abscissa and ordinate dividing the Chart
into four quadrants. None of the county points
departs significantly (in the statistical sense) from
the regression line; furthermore, the line lies
"fairly" between the points in both the top right
and bottom left quadrants. Both standards, income
and component, clearly divide the counties into
two classes, the fifteen counties of Leinster (except
Longford) and Munster (except Clare and Kerry) in
the more prosperous class with the remaining eleven
counties less prosperous. As the magnitude of the
correlation coefficient has already shown, there is a
considerable measure of consistency between the two
series. The location of Louth and Wexford
except-ionally in the lower right quadrant must, however,
raise the suspicion that the personal income for these
counties is under-estimated, and Kilkenny
over-es-timated. At the same time we cannot accept deviation
from the regression line as a criterion of inaccuracy
since, even if we knew the incomes exactly, the
county points would certainly not lie on the line.
The four aggregations referred to at (ii) are as
follows:
(a) Estimates of personal income from the
personal expenditure side for comparison
with our estimates from the income side;
(b) Rates paid in comparison with income
arising;
(c) Almost firm figures for non-agricultural
employee remuneration in many economic
sectors compared with our estimates (see
Table 1, col. 15).
(d) Estimates based on amounts of gross income
assessed to income tax (Table lO) for
com-parison with our estimates of non-agricultural
non-employee income arising (Table I, col.
16);
(e) Farm income (Table4, Cols.
11-12)compared
with regression estimates.
Attention is directed to the Notes appended to the
Table in which the comparisons are made. It will
be seen that the principal component comparison
is also included (col 2), using a more rigorous
standard than in the other four eases.
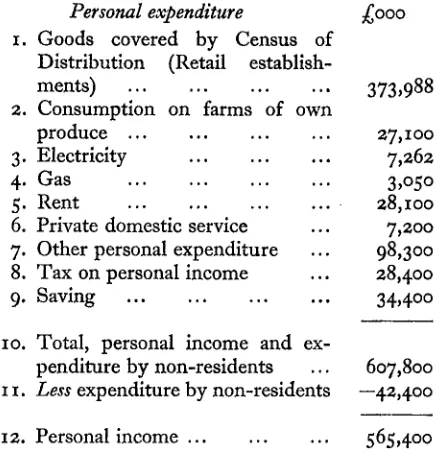
[image:10.622.350.570.214.441.2]It was a disappointment, in regard to (a), that
an attempt to estimate county personal incomes
from the expenditure side proved abortive and,
though we have used the estimates for the purpose
of the Table, we refrain from citing the actual
figures as likely to confuse. The method used was
based on a recast version of Table A8 of National
bzcome and Expenditure, 1961 from which personal
income in 196o may be aggregated as
follows:--Personal expenditure £ooo
I. Goods covered by Census of
Distribution (Retail
establish-meats) ...
373,988
2. Consumption on farms of own
produce ...
27,IOO
3. Electricity ...
7,262
4. Gas ...
3,o5o
5. Rent ...
28,1oo
6. Private domestic service
...
7,200
7. Other personal expenditure
...
98,300
8. Tax on personal income
...
28,4oo
9. Saving ...
34,4oo
IO. Total, personal income and
ex-penditure by non-residents ... 607,800
I I. Less expenditure by non-residents --42,4oo
12. Personal income ...
565,400
Each of items 1-9 was distributed county-wise using
appropriate distributors; naturally the Census of
Distribution, 1956-59, Table IB, using factors
TABLE: COMPARISON OF CERTAIN MACRO-ESTIMATES WITH ANCILLARY SERIES
Non-agricultural Other
Income employee non-agricultural Farm Personal income arising remuneration income income
County versus versus arising arising versus
V~SUS versus
A B C D E F
x z 3 4 5 6 7
Carlow ..
Dublin ¯ ¯ Kildare ¯ ¯ Kilkenny Laoighis ¯ ¯ Longford Louth Meath i: Offaly .. Westmeatla Wexford ¯ ¯ Wicldow ¯ ¯ Clare ¯ ¯ Cork ¯ ¯ Kerry ¯ ¯ Limerick Tipperary Water ford Galway ¯ ¯ Leitrim Mayo ¯ ¯
Roscommon Sligo ¯ ¯ Cavan ¯ ¯ Donegal Monaghan °. °. .° ,. .° °. ,° °. .° °, .° °, ..
¯ . H ¯ ° H °, °. .. LL °, .° ,° °, L ., °,
¯ . H °° °, .° .. H °° °. °° °,
¯ . L
M
(a)
L L LL H HH H H H L LL L L L H H LL HH L L H HH L H L(a)
HH LL L LL L L LL H H L H HH HH HH HH HH L LL HH L L L H H L L L LLNotes to Table
H (L)=high (low) for macro-estimates compared with test series A--E defined below. (a)=Dublin test figure made same as macro under test. Single letters H (L) mean that discrepancy is in the range io-2o%; double letters that discrepancy is over 2o%, except for test series A when ranges are respectively 5-xo% and over Io%, i.e., as indicated on the Chart.
Macro-estimates under test are as
follows:--Cols. 2-3: Tabie 2, col. 6. Col. 4: Table x, col. 20. Col. 5: Table x, col. x5. Col. 6: Table i, col. i6. Col. 7: Table 4, cols. ii-i2. Test series are as
follows:--A: Principal component; see text and Appendix.
B: Personal income estimated from expenditure side; see text. C: Rates paid; see text.
D: Employee remuneration in special groups, i.e., sum of Table 5 (col 5), Table 6 (col. 6), Table 7B((col. x3), Table 8B (col. 7).
E: Income tax Schedule A--D income assessed, based on Table xo, col. 6. F: Regression estimate for farm income; see text.
by B6rd Ffiilte and the Central Statistics Office.
The residual £47 million was redistributed from
Dublin amongst the counties using the distributor
p/d, where p is the county population and d the
distance from mid-county to Dublin City. It was
the resulting estimate which was used for
compar-ative purposes in col. 3 of the Table.
With regard to col. 4, the comparison may be
regarded as somewhat anomalous, since the main
purpose of the present series of estimates of income
was just to ascertain if rates paid were high compared
with income. The fact is, however, that rates paid
as percentage of incomes arising exhibit a rather
remarkable degree of constancy throughout the
counties, as will appear from the local taxation
paper to be published shortly. This particular
comparison therefore finds its justification in pure
empiricism.
independently estimated, the fbrmer using
exped-ients which, to say the least, required verification.
Here again we find Louth making an exceptional
showing, the percentage 43 being by far the lowest
in the series.
With regard to col. 7, CSO kindly made available
to us a series of estimates of farm (i.e. labour and
family) income based on linear regression analysis
of farms included in the National Farm Survey of
I955. Regression equations were determined for the
Survey farms in each size-region cell with labour
and family income per acre of crops and pasture
as the dependent variable and, as independent
variables, the density per acre of crops and pasture
of ploughed land, milch cows, other cattle, pigs,
sheep and poultry.* The average densities
deter-" mined from the size group analysis of the I96o
Agricultural Statistics were inserted in these
equations, using the equations for a particular region
for all counties within that region. The resultant
estimates of income per acre of crops and pasture,
when multiplied by the appropriate total of crops
and pasture for the cell and aggregated for all sizes
within a county, yielded county estimates. These
totals were then used as distributors to give the
figures in the statement attached where they are
compared with the estimates in the paper. The
method of estimation produces results as at the
cost/price structure existing in i955-56 and tends
to eliminate differences between counties within a
region. Hence the best comparison is on a regional
basis.t
From principal component analysis in conjunction
with the showing of the Table generally we incline
to the view that our estimates for Counties Louth
and Wexford are too low and those for Kerry,
Galway and Leitrim rather too high.
*The simple average of the RI for the x7 regression equations used was "544. The linear regression, as representing the data,
can therefore be regarded only as fair.
~Comparisons are as follows in three Survey regions
:--£ million £ million
Region x A B Region z A B
Carlow 2’29 2"3I Clare 4"8x 5"ox Dublin 2"56 3"22 Cork x7"64 x6"77
Kildare 3"45 4’3z Kerry 7"58 8.ii Laoighis 3"7x 3"28 Limerick 6.6x 7"6o Longford 2"xo x’6o Tipperary 8"7x 9"68 Louth 2’xo x’9x Waterford 3’59 3’68 Meath 5’02 6’2I Kilkenny 4"87 5"07 Offaly 3"37 2’96
Westmeath 2.96 z.88 Total Region 2 53"8I 55"93 Wexford 6.14 5"39
Wicklow 2’79 2"36 " Region 3
Galway 8"I9 8.68 Leitrim 2"34 2"o3 Roseommon 4.07 4.09 Mayo 6"74 6’45 ~ Sligo 2"89 3"00
Total, Region I 48’75 49"2I Cavan 4’02 3"36 ~ Donegal 5’3I 4"67
Monaghan 3"z... 72"4___.7
Total, Region 3 24"56 2x’98
A : Regre~ion estimate. 13 : sum of cols. xx-x2, Table 4.
8
6. Conclusion
It will be clear that formidable difficulties had to
be surmounted to produce the estimates in Tables
i and 2, if indeed these difficulties may be regarded
as overcome. If experience shows that these statistics
are useful then steps can be taken to improve their
quality. It seems likely that the methodology used
in this paper is sound enough; realistically one
cannot conceive of any method which at one sweep
would surmount all the difficulties; the method will
always entail the setting together of many small
pieces, as in the case of the national accounts
them-selves. At first sight it might appear that one or
more of the following general approaches could be
used :
I. Compilation of county incomes derived from
a question about incomes on the Census of
Population schedule;
2. Compilation of incomes from all sources
assessed to income tax on a strictly residential
basis by the Revenue Commissioners;
3. A sample Household Budget inquiry.
Unfortunately each of these sources is defective for
the present purpose--which is not to say that the
compilations would not be useful, indeed essentially
useful, for other purposes--or for parts of an inquiry
into county incomes. As to i, experience elsewhere
has indicated a tendency to understate income and
in Ireland it is notorious that farmers have very
imprecise ideas of what their incomes are. As to 2,
the Revenue r6gime scarcely touches agriculture or
non-agricultural incomes not assessable. As to 3,
the inquiry would have to be on a very large scale
to enable the authority to produce reliable county
figures and these inquiries are very expensive; also,
experience with the Irish inquiry of I951-52
revealed a substantial and systematic tendency to
understate income.
It has been noted that many of the distributors
used for the present purpose were derived from the
1951 Census of Population. When the corresponding
statistics from the 196I Census become available
we propose to revise the estimates in Tables I and
2. It is not expected that these will be significantly
changed as a result; if they are, revised versions
will be published.
Once series of statistics for county incomes have
been set up for a particular year, say I96o, it will
be a comparatively easy task to keep them up-to-date
by the use of index numbers applied to the more
im-portant constituents in the aggregation; in fact one
may place much more reliance on the year-to-year
changes than on the absolute level of figures in any
List of Tables
I. Income Arising I96o in Five Main Sectors, Distinguishing Remuneration of Employees and Other Income. z. Derivation of Personal Income and Population I96o,
3- Gross Output of Agriculture I96o, Distinguishing Principal Product Groups. 4. Derivation of Agricultural Income; Males Engaged in Agriculture I96o, 5. Particulars from Census of Industrial Production I958.
6. Particulars of Retail Trade from Census of Distribution x956.
7. Central and Local Government I958/59. Average Number of Employees and Employee Remuneration, 8. Average Number of Employees and Employee Remuneration in Certain Groups ~958.
9. Social Welfare Payments ~958/59,
io. Income Charged with Income Tax and Yield of Tax. x I. Certain Economic Status Indicators.
12. Some Derived Statistics,
Abbreviations
BM: B6rd na M6na. CIE: C6ras Iompair ]~irearm.
CSO: Central Statistics Office, ESB: Electricity Supply Board. CIP: Census of Industrial Production. CP: Census of Population.
ITJSB: Irish Trade Journal and Statistical Bulletin,
NIE: National Income and Expenditure. SA: Statistical Abstract.
TABLE I : INCOME ARISING 196o IN FIVE MAIN SECTORS DISTINGUISHING REMUNERATION OF EMPLOYEES AND OTHER INCOME
£ thousand
. Public
admin-I. Agriculture, forestry, z. Industry 3- Distribution and istration 5. Other domestic 6. Total non-agrlcultural 7. Total income arialng fishing transport and (including rent) income arising (x + 6)
de fence (z~5)
County -- ... Couaty
Remun- Remun- Remun- Rcmtm- Remun-
Remun-eration Other Total eration Other Total e.ratlon Other Total Total eration Other Total eration Other Total eration Other Total of era- income income ofem- incomc income ofem- income income income ofem- income income ofem- income income of era- income income
pl0yees ployces ployees ployees ployees ployees
x z 3 4 5 6 7 8 9 I0 xx 12 I3 I4 z5 16 17 18 I9 20 23
’,arlow .... 496 1,877 2,373 t,313 273 x,586 370 228 598 351 557 278 835 2,591 779 3,370 3,087 2,656 5,743 Carlow )ublin .... ]I,418 2,xxo 3,5z8 51,5o5 18,596 7o,xox 26,413 13,)48 4o,36I 22,643 24,o56 24,645 48,7oi zzz,SZ7 59,289 , I81,8o6 I23,935 61,399 185,334 Dublin ~ildare .... 998 3,450 4,448 3,065 813 3,878 576 37I 947 1,585 I,o58
~ilkenny ¯. 950 4,298 5,248 2,i22 647 2,769 559 344 903 579 1,oo2 ,anighis ¯ ¯ 639 g,819 3,458 1,336 536 x.872 418 233 65t 5r4 643 ,ongford ¯ ¯ 235 1,428 1,663 472 I72 644 246 169 415 280 42o ,outh .... 563 1,477 2,040 4,64-4 z,366 6,oio 1,343 617 1,96o 693 x,157 ~eath .... 1,3o8 S.Ixo 6,418 1,583 622 2,2.05 480 303 783 541 999 Jff21y .... 507 2,555 3,062 2,5go 519 3,099 499 3o8 807 438 686 gestmeath .. 516 2,485 3,ooi 1,22i 373 1,594 677 318 995 1,3o2 814 gexford ¯ ¯ 1,273 4,430 5,703 1,84o 667 2,507 980 598 1,578 706 1,337 iricldow ¯ ¯ 793 1,925 2,718 2,I6o 806 2,966 702 42I I,I23 369 1,29I
538 1,596 6,284 1,722 8,006 7,282 5,I72 x2,454 Kildare 476 1,478 4,262 1,467 5,729 5,212 5,765 Io,977 Irdlkenny 331 974 2,91I Z,xoo 4,oII 3,550 3,919 7,469 Laoighis I99 619 1,418 540 1,958 1,653 1,968 3,62I Longford 699 1,856 7,837 2,682 Io,519 8,400 4,159 12,559 Louth 436 1,435 3,603 1,36I 4,964 4,9II 6,47I II,382 Meath 348 I,o34 4,203 I,I75 5,378 4,7to 3,730 8,440 Offaly 445 1,259 6,oi4 I,I36 5,15o 4,53° 3,621 8,151 Westmeath 629 1,966 4,863 1,894 6,757 6,I30 6,324 I2,46o Wexford 793 2,084 4,522 2,o2o 6,542 5,315 3,945 9,260 Wicklow ¯ ~INSTER 9,696 33,964 43,660 73,84I 25,390 99,23z 33,263 I7,858 51,I22 30,0oi 34,020 29,817 63,837 I69,o25 75,I65 244,I90 I78,72I 109,129 287,850 LEINSTER ’.late .... 476 4,711 5,187 978 300 1,278 403 408 8II 917 925 505 z,43o 3,223 1,213 4,436 3,699 5,924 9,623 Clare :ork .... 2,708 14,984 I7,692 1~,528 4,507 I9,o35 6,049 3,062 9,III 3,848 6,679 4,53I Ii,2Io 31,1o4 12,1oo 43,204 33,812 27,084 60,896 Cork ~erry .... 76I 7,646 8~4o7 1,833 676 2,5o9 953 530 1,483 I,I39 1.549 84o 2,389 5,474 2,o46 7,52o 6,235 9,692 I5,927 Kerry ,imerick .. 1,224 6,645 7,869 4,I98 1,57I 5,769 2,546 1,255 3,8oi 2,003 2,343 1,3o9 3,652 Ii,o9o 4,I35 I5,225 I2,314 1o,78o 23,094 Limerick "ipperary .. 1,615 8,430 Io,o45 3,828 I,I77 5,005 1,2o3 772 1,975 1,322 1,913 942 2,855 8,266 2,89I II,I57 9,881 11,321 21,2o2 Tipperary Varerford .. 768 3,352 4,I2o 2,966 869 3,835 1,6o3 836 2,439 780 1,435 847 2,282 6,784 2,552 9,336 7,552 5,904 13,456 Watefford ~[UNSTF.R .. 7,552 45,768 53,320 28,331 9,Ioo 37,43I I2,757 6,863 I9,620 Io,o09 24,844 8,974 23,818 65,94I 24,937 90,878 73,493 70,705 I44,I98 MUNSTer ;alway .... 917 8,250 9,I67 2,508 736 3,244 1,268 780 2,048 2,317 2,254 1,437 3,69I 8,347 2,953 I1,3oo 9,264 II,2o3 20,467 Galway ~itrim .. 193 x,92o 2,II3 [ 487 I96 683 I89 152 34I 336 399 234 633 1,4II 582 1,993 r,6o4 2,502 4,1o6 Leitrlm /[ayo .... 636 6,i2o 6,756
[
1,798 552 2,350 804 578 1,382 I,I95 1,4I2 I,o33 2,445 5,209 2,I63 7,372 5,845 8,283 r4,128 Mayo [oscommon ¯ ¯ 335 3,885 4,220 796 218 I,oi4 322 246 568 661 744 466 1,2io 2,523 930 3,453 2,858 4,815 7,673 Roscomraon ,ligo .... 283 2,835 3,II8 1,I87 396 1,583 579 329 908 538 833 564 1,397 3,137 1,289 4,426 3,420 4,I24 7,544 Sllgo .’ONNACIlT ¯ ¯ 2,364 Z3,O~O 25,374 6,776 2,098 8,874 3,I62 2,085 5,247 5,O47 5,642 3,734 9,376 20,627 7,917 ~8,544 22,99I 30,927 53,918 CONNACHT "a~an .... 454 3,024 3,472 964 388 x,352 436 343 779 6o1 767 422 I,I89 2,768 I,I53 3,92I 3,222 4,I77 7,399 Cavan )onegal .. 881 4 318 5A99 2,478 027 3,405 932 656 1,588 x,o9o 1,68o 740 2,420 6,I8o 2,323 8,503 7,o6I 6,64I 13,7o2 Donegal /Ionaghan ¯ ¯ 353 2,216 2,569 9Io 397 1,3o7 450 295 745 652 747 413 i,I6o 2,759 1,1o5 3.864 3,I12 3,32I 6,433 Monaghan JI~T~ (part) .. 1,688 9,558 II,246 4,352 1,712 6,064 1,818 r,294 3,112 2,343 3,I94 1,575 4,769 x1,7o7 4,58I 16,288 13,395 I4,I39 27,534 ULSTER (pare)
I
’
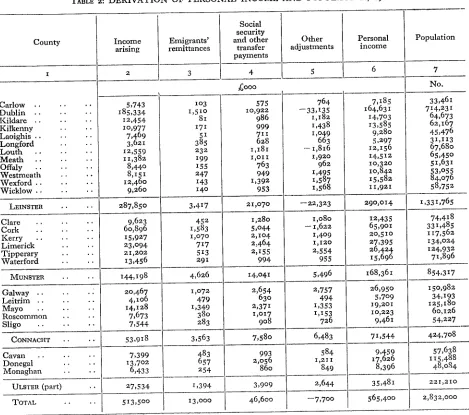
TABLE 2: DERIVATION OF PERSONAL INCOME AND POPULATION, 196o
County
Carlow .... Dublin .... Kildare .... Kilkenny ¯ ¯ Laoighis ..
Long ford Louth ¯ ¯ Meath . ¯ Offaly ¯ ¯ Westmeath Wexford ¯ ¯ Wicklow ¯ ¯
LEINSTER .... Clare ... Cork ... Kerry ... Limerick .... Tipperary .... Waterford ....
MUNSTER . ¯
Galway ... LeitrJm ... Mayo ... Roscommon .... Sligo ... CONNACHT .... Cflvfln ... Donegal .... Monaghan .. ULSTER (part)
TOTAL ¯ ¯
Income arising 5,743 185,334 12,454 lO,977 7,469 3,62I 12,559 11,382 8,44° 8,151 12,46o 9,260 Emigrants’ remittances 1o3 1,510 81 171 51 385 232 199 155 247 143 14o security
and other Other transfer adjustments payments 4 5 £000 575 10,922 986 999 711 628 I,I8I 1,oi1 763 949 1,392 953 764 --33,I35 I,I82 1,438 I ,o49 663 -- 1,816 1,92o 962 1,495 1,587 1,568 Personal income 7,185 164,631 Population No. 33,46I 714,231 14,7o3 64,673 13,585 62,167 9,280 45,476 5,297 3I,I13 12,156 67,680 14,512 65,450 lO,32o 51,631 lO,842 53,055 15,582 84,o76 11,921 58,752
287,850 3,417 21,o7o --22,323 29o,o14 1,331,765
1,28o 5 ,o44 Z, IO4 2,464 2,155 994 14,o41 452 1,583 1,o7o 717 513 291 1,o8o -- 1,622 1,4o9 I,I20 2,554 955 5,496 2,757 494 1,353 I,I53 726 4,626 I,O72 479 1,349 380 283 12,435 65,9Ol 20,510 27,395 26,424 15,696 I68,361 26,950 5,7°9 19,2Ol IO,223 9,461 9,623 60,896 15,927 23,094 21,202 13,456 144,198 20,467 4,1o6 14,128 7,673 7,544 2,654 63° 2,371 1,o17 908
53,918 3,563 7,580 6,483 71,544
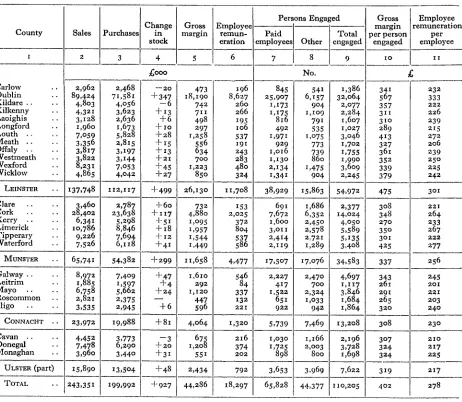
TJusr.~ 3: GROSS OUTPUT OF AGRICULTURE z96o, DISTINGUISHING PRINCIPAL PRODUCT GROUPS £ thousand
Total Zncluding
Cattle Milk Eggs Sheep, Other livestock Total Value of Total
con,yump-County and and milk and Pi~ lambs livestock and crops, changes gross tion County calves products poultry and and livestock timber in stock outptit of of O~H
wool products products and turf agriculture produce
I 2 3 4 5 6 7 8 9 IO II 12" 13
~arlow .. 897 307 203 4oi 457 59 2,324 1,5o5 26 3,855 334 Carlow Dublin .. 812 85z 19° 815 206 385 3,259 1,86x 28 5,148 486 Dublin Kildare .. 1,839 936 229 298 429 602 4,333 2,,I59 48 6,540 610 Kildare Kilkenny .. 2,066 1,467 426 957 367 153 5,436 2,635 62 8,x33 636 lGlkenny Laoighls .. It532 603 304 577 203 50 3,269 2,190 43 5,502 578 Laoighis Longford .. I~I30 331 3Io 327 xoo 38 2,2"36 355 30 2,62I 519 Long ford Louth .. 822 541 233 278 213 43 2,I30 1,169 z3 3,322 336 Louth Meath ., 3,450 1,913 425 483 813 475 7,559 1,4~;4 88 9,1o1 797 Meath Dffaly .. 1,639 588 306 482 242 45 3,302 x,672 43 5,o27 757 Offaly ~Vestmeath .. 1,987 587 336 328 342 H9 3,699 677 52 4,428 711 Westmeath
Vexford .. x,855 I jr38 517 1,122 779 168 5,579 3,819 6x 9,459 818 Wexford Wicldow .. 871 844 235 353 696 81 3,080 O86 34 4,Ioo 422 Wicklow LEINSTER .. x8,9oo 10~I06 3,714 6,42I 4,847 2,218 46,206 20,482 538 67,226 7,004 LEINSTER ~{are .. 2,958 x,765 444 344 236 65 5,812 926 79 6,807 1,295 Clare Cork .. 5,774 7j681 1,8OI 4,871 88x 330 21,338 5,489 2II ~7,o38 ~,459 Cork Kerry .. 2~520 4,258 732 1,515 644 23 9,692" x,484 98 I1,274 1,926 Kerry Limerick .. 2,824 4,757 5o9 1,249 75 2.52 9,666 724 97 IO,487 1,197 Limerick Yipperary .. 4,623 3,630 626 1,420 625 409 11,333 2,818 I30 14,28I 1,334 Tipperary Waterford ,. 1,502 1,53o 266 736 297 127 4,458 1,304 47 5,809 461 Water ford MUNSTER .. 20,20I 23,62I 4,378 lO,135 2,758 1,206 62,299 I2,735 66= 75,696 8,683 MUNSTER Galway .. 3,364 z,66z 1,412 682 2~14I 62 9,321 2,625 11I x2,o57 2,626 Galway Lcitrim .. x,143 586 342 236 144 6 2,457 322 32" 2=811 650 Leitrim Mayo .. 2,980 1,346 1,o87 580 9a8 36 6,957 1,74I 90 8,788 ~,637 Mayo Ros¢ommon.. 2,440 69z 632 ~98 648 15 4,624 963 64 5,65I 1,301 Roscommon
.. x,545 925 397 249 266 23 3,405 606 42 4,053 897 Sligo ~ONNACHT .. I T~472 5j209 3,870 1,944 4~I27 142 26,764 6,257 339 33,360 8,111 CONNACHT ~avan .. 1,56o 1,326 681 I~108 136 18 4,829 496 54 5,379 822 Cavan Done~qd ., z,77o 923 708 293 985 4,691 2,370 64 7,125 1,925 Donegal Monaghan .. ItII8 824 635 87O 73 2I 3,541 737 38 4,316 65a Monaghan ULS~ZS (part) 4,448 3,073 2,024 2,271 I,x94 51 13,o61 3,603 I56 16,82o 3,303 ULSTER (part’.
TABMZ 4: DERIVATION OF AGRICULTURAL INCOME AND MALES ENGAGED IN AGRICULTURE, x96o County Carlow Dublin Kildare tGlkenny Laoighis Longford Louth Meath Offaly Westmeath Wexford Wicklow LEINSTER Clare Cork Kerry Limerick Tipperary Waterford MUNSTER Galway Leitrlm Mayo Roseommon Sligo CONNACHT Cavan Donegal Monaghan ULSTER (part) TOTAL G1055 value of output 3,355 I 5,Z43 I 0,540 I 3,I33 i 5J502 ! 2,62I ! 3,322 9,101 5,o171 4,428 9,459 : 4jlOO 67,226 6,807 2%o38 1Z ,274 lO,487 I4,281 5,809 75,696 I2,o57 2,811 8,788 5,651 4,053 33,360 5,379 7,115 4,316 Non-labour costs
Rates Misc. Total cOStS
6 7 8
Fertil-Animall isers Mach-~ed I and inery
lime
314 5
~000 374 208 425 x7o 3201 x,5o3 594 z66 522 247 333 I 1,862 418 311 583 336 4341 z,I33 784 426 806 318 0sOl 2,980 533 313 627 225 47oi 2,168 381 IO8 144 171 1731 977 305 174 415 187 2791 1,360 81o 350 559 463 59o I 2,772 532 283 523 244 4141 1,996 489 146 217 3Z3 259 1,464 908 598 1,284 317 877 3,984 4a8 217 471 227 335 1,678 6 556 3,3Ol 6,576 3,228 5,116 24,877 554 227 204 319 406 1,71o 3,570 1,359 2,oIz 1,o44 2,o14 9,999 1,222 367 485 308 703 3,085 1,o68] 286 385 449 578 2,766 1,3o31 61o 913 635 970 4,431 579 287 398 327 449 2,040
j____
8,296 3,136 4,397 3,082 5,IZO 24,031 949 494 447 51I 845 3,246 284 47 141 i14 161 747 773 319 302 184 583 2,261
437 206 198 285 355 1,481 339 lO7 I63 165 239 I,OI3 2,782 x,173 1,251 1,359 2,183 8,748 825 197 343 133 359 1,957 486 279 703 303 602 2,373 641 189 43o 195 344 1,799
1,952 665 1,476 731 1,3o5 6,129 19,586 ! 8,275 113,7oo 8,4oo 13,824 63,785
Income arising in agrl-culture 9 2,352 3,286 4,407 5,153 3,334 1,644 1,962 6,329 3,O21 Z,964 5,475 2,422 42,349 5,097 17,o39 8,I89 7,721 9,850 3,769 51,665 8,8Ii 2,064 6,527 4,17o 3,040 24,612 3,422 4,752 2,517 lO,69I 129,317 Rent tRemun-element[ oration Family in land of em- farm
annu- ployees income ities
10 [ II 12
.... 1--45 4351 1,822 65 1,155 I 1,966 88 9731 3,346 83 3o11 4,I79 59 5391 2,736 45 2211 1,377 49 5321 1,381 122 1,3o31 4,904 64 4541 2,473 84 5o21 2,378 83 I,I431 4,244 59 5451 1,818 846 8,879 I 32,624
1--83 4ZOl 4,585 273 2,3021 14,4o4 81 o521 7,456 118 z,1031 6,435 I66 1,475I 8,209 86 577I 3,1o6 807 6,663 ! 44,I95 134 704 7,973 30 162 1,872 74 5a4 5,929 75 319 3,776 43 242 2,755 356 Ij951 221305 61 43° 2,93I 79 642 4,o3I 51 335 2,131
191 1,4o7 9,093 2,200 18,9OO IO8,217
Males engaged in agriculture, I June 196o Membersl
.... Other Total family I males
1--14 15 --i. Number County 16 3,441 2,3a9 4,333 5,044 : O,SI0 i 5,941 I 3,351 ! 8,1OO ! 6,729 1 6,746 9,077 4,135 68,742 14,426 29,662 19,O48 12,283 I5,583 5,141 96,143 29,191 8,970 26,926 14,502 9,820 89,409 12,197 18,928 8,948 2,303 I 5,570 I 4,200 l 4,072 ] 2,554 ] 1,IOI [ 2,505 I 5,722 l 2,339 l 2,412 I 5,227 I 2,51I ] 40,532 I I 10,309 I 3,24~ I 5,515 I 0,302 I 2,009 ! 31,114! 3,619 878 z,787 1,565 I~220 lO,O69 2,216 3,319 1,748 40,073 7,a83 i 294,367 89,048
TABLE 5: PARTICULARS FROM CENSUS OF INDUSTRIAL PRODUCTION I958
Remainder Average Net output
County Gross Materials, Net Employee of net number per person
output etc. used output remuneration output engaged engaged
i 2 3 4 5 6 7 8
5’280 [
£ooo No.
£
~,arlow ... 4,040 1,24o 830 41o 1,84° 674
Dublin ... I73,877 I I *,975 61,902 33,228 28,674 82,I44 754
Kildare ... 7,458 5,II2 2,346 x,I46 1,200 3,o41 772
Kilkenny .... 8,570 6,568 2,002 1,182 820 2,931 683
Laoighis ... 3,288 2,485 803 465 338 1,33I 6o3
Longford .... 475 285 190 119 71 4O3 472
Louth ... 23,369 I7,205 6,x64 2,950 3,214 7,672 803
Meath ....
~fray ii ....
2,6336,I98 1,5474,98I 1,o861,217 6~4825 472392 2,4821,956 555490gCestmeath .... 2,239 *,439 800 463 337 1,42I 563
Wexford ... 5,439 3,663 1,776 963 813 2,622 677
~¢icklow ... 3,215 1,845 1,37o 92O 45° 2,617 524
LEINSTER .... 242,041 16.,,45 8o,896 43,705 37,I9I 1 io,46o 732
Clare ... 2,715 2,090 625 354 271 I,IOl 568
Fork ... 62,779 45,I66 I7,613 9,382 8,231 23,o6I 764
Kerry ... 8.74I 7,498 1,243 7*9 524 1,945 639
Limerick ....
ripperary .... 19,I56 I5,32I 3,835 2,o67
1.768 5,383 712
I8,o68 *4,505 3,563 2,023 1.54° 5,oo5 712
Waterford .... 10,229 7,418 2,8ii 1,60I 1,2IO 4,34I 648
MUNSTER .... I21.688 9’,998 29,690 ,6.,46 13,544 4o,836 727
Galway ... 4,786 3,328 1,458 987 471 2,805 520
Leitrim ... 766 570 196 lO7 89 372 527
Mayo ... 6,o67 4,669 1,398 8z3 575 2,562 546
Roscommon .... I,I42 856 286 211 75 632 453
Bligo ... 3,629 2,790 839 483 356 1,434 585
CONNACHT .... 16.39o I2,213 4,I77 2.61 * 1,566 7,805 535
Cavsn ... 4,24° 3,37I 869 414 455 1,209 7x9
Donegal .... 5,727 4,046 1,681 996 685 3,35o 502
Monaghan .... 3,I26 2,357 769 433 336 1,318 584
ULSTER (part) .. 13,o93 9,774 3,319 I, 843 1,476 5,877 565
TOTAL .... 393,212 275,13o I18,o82 64.305 53,777 164,978 716
TABLE 6: PARTICULARS OF RETAIL TRADE FROM CENSUS OF DISTRIBUTION 1956
Gross Employee margin remunerati on per person per
engaged employee Persons Engaged Change in stock Gross margin Employee remun-eration
County Sales Purchases Paid
employees Total Other engaged 6 196 8,627 260 266 195 io6 537 29I 243 283 480 324 8 No. 541 6,757 904 I,IO9 79I 535 I ,O75 773 739 860 1,475 9o4
I 2 3
2,468 71,581 4,056 3,623 2,636 1,673 5,828 2,815 3,197 3,I44 7,o53 4,o42 4 £ooo --20 + 347 --6 +13 +6 -~- io +28 +15 +13 +2i +45 +27 5 473 I8, I9o 742 711 498 297 1,258 556 634 700 1,223 85O 7 845 25,907 1,I73 1,175 816 492 1,97I 929 1,O16 I,I30 2,134 1,34I
9 IO II
£
Carlow .. Dublin .. Kildare .... Kilkenny .. Laoighis ¯ ¯ Longford .. Louth .... Meath .... Offaly .... Westmeath .. Wexford .. Wieklow .. 2,962 89,424 4,803 4,322 3,I28 1,96o 7,o59 3,356 3,817 3,822 8,23I 4,865 1,386 32,064 2,077 2,284 x ,607 I,O27 3,o46 i ,7o2 1,755 1,99o 3,609 2,245 341 232 567 333 357 222 311 226 31o 239 289 215 413 272 327 206 361 239 352 25° 339 225 379 242
LEINSTER . . 137,748 II2,II7 -b 499 26,13° I1,7o8 38,929 15,863 54,972 475 3Ol
22I 264 233 267 222 277 256 Clare .... Cork .... Kerry .... Limerick . . Tipperary .. Waterford . ¯
3,460 28,402 6,341 Io,786 9,226 7,526 2,787 23,638 5,298 8,846 7,694 6,I18 + 6o +117 -I-51 + 18 + i2 +41 691 7,672 1,6oo 3,oi I 2,414 2,119 x,686 6,352 2,45° 2,578 2,721 1,289 3o8 348 270 35° 3Ol 425 732 4,880 I,o95 1,957 1,544 i ,449 153 2,025 372 8o4 537 586 2,377 14,o24 4,050 5,589 5,I35 3,4o8 MUNSTER . . 65,74I 54,382 +299 11,658 4,477 I7,5o7 I7,O76 34,583
337 Galway .... Leitrim .. Mayo .... Roscommon .. Sligo .... 8,972 1,885 6,758 2,821 3,535 +47 +4 + 24 +6 1,610 292 1,12o 447 596 546 84 337 132 22i 4,697 1,117 3,846 1,684 1,864 7,409 1,597 5,662 2,375 2,945 2,227 417 1)522 65i 922 2,470 700 2,324 1,o33 942 245 201 22I 203 24° 343 267 291 265 320
CONNACHT . . 23,972 19,988 +8i 4,064 1,32o 5,739 7,469 I3,208 308 230 Cavan .... Donegal .. Monaghan .. 675 1,208 551 216 374 202 1,166 2,003 80O 2,196 3,728 1,698 4,452 7,478 3,96o 3,773 6,290 3,44° --3 +20 +3I 1,030 1,725 898 307 324 324 210 217 225
ULSTER (part) 15,89o 13,5o4 +48 2,434 792 3,653 3,969 7,622 217
319
TOTAL ¯ ¯ 243,351 199,992 +927 44,286 18,297 651828 44,377 I 1 O)205 4O2 278
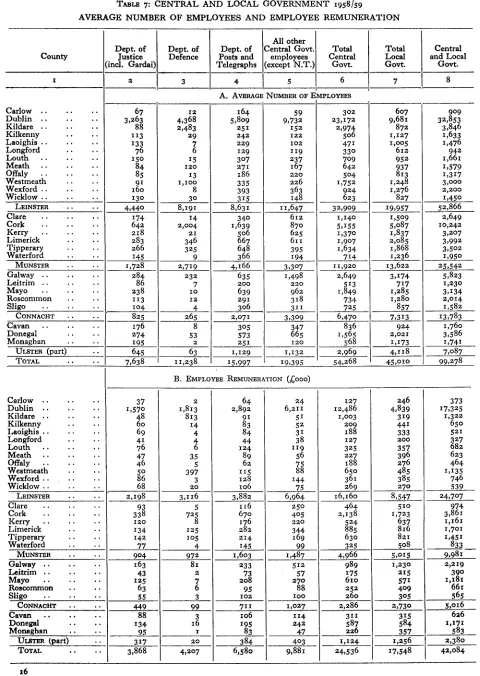
TABLE 7: CENTRAL AND LOCAL GOVERNMENT 1958/59
AVERAGE NUMBER OF EMPLOYEES AND EMPLOYEE REMUNERATION
County
Dept. of Justice (incl. Gardai
Cat-low . . Dublin . ¯ Kildare ¯ ¯ Kilkenny Laoighis ¯.
Longford Louth ¯ ¯ Meath ¯ ¯ Offaly ¯ ¯ Westmeath Wexford ¯ ¯ Wieldow ¯ ¯
Dept. of De fence Dept. of Posts and Telegraphs Total Local Govt. Central and Local Govt.
1 z 3 4 6 7 8
A. AWRAGE NUMBER OF EMPLOYEES
67 3,263 88 113 I33 76 15o 84 85 91 16o 13o I64 5,809 25I 242 229 129 3o7 271 ~86 335 393 315 All other
Central Govt.I Total employees I Central
(excepi_ N.T.)I. Govt. 59 9,732 I52 i22 IO2 119 237 167 220 226 363 148 ,° °. .° .° °° °. i2 4,368 2,483 29 7 6 I5 i2o 13 i,ioo 8 3o
LEINSTER .... 4,44° 8,191 8,631 11,647
14 2,004 2I 346 325 9 174 642 218 283 266 145 2,719 232 7 io I2 4 i ,728 340 1,639 506 667 648 366 4,I66 635 200 639 291 3o6 284 86 238 113 lO4 612 870 625 611 395 I94 3,307 1,498 220 962 318 311 302 23,172 2,974 5o6 47I 33° 7o9 642 504 1,752 924 623 32,9o9 I,I40 5,155 1,37o 1,9o7 1,634 714 I 1,920 2,649 513 1,849 734 725 607 9,68I 872 I,I27 I ~OO5 612 952 937 813 1,248 1,276 827 Clare ... Cork ... Kerry ... Limerick .... Tipperary .... Waterford .... 909 32,853 3,846 1,633 1,476 942 1,661 1,579 1,317 3,000 2,200 1,45o 19,957 52,866 1,509 5,087 1,837 2,085 1,868 1,236 13,622 3,I74 717 1,285 1,28o 857 MUNSTER .... Galway ... Leitrim ... Mayo ... Roscommon ¯ ¯ Sligo .... CONNACHT ¯. Cavan .... Donegal ¯ ¯ Monaghan ¯ ¯
ULSTER (part) .. TOTAL .... 2,649 10,242 3,207 3,992 3,502 1,95o 25,542 5,823 1,23° 3,134 2,o14 1,582
825 265 2,071 3,309 6,47o_ 7,313 13,783
I76 8 305 347 836 924 1,76o
274 53 573 665 1,565 2,o21 3,586
195 2 251 12o 568 1,173 1,74I
645 63 I,I29 I,I32 2,969 4,II8 7,087
7,638 11,238 15,997 I9,395 54,268 45,oio 99,278
B. EMPLOYEE REMUNERATION (£OOO)
Carlow .... Dublin ¯ ¯ Kildare ¯ ¯ Kilkenny Laoighis .. Longford Louth . ¯ Meath ¯ ¯ Offaly .. Westmeath Wexford ¯ ¯ Wicldow ¯ ’ LEINSTER Clare .. Cork .... Kerry .... Limerick ¯.
Tipperary ¯ ¯
Waterford ¯ ¯
MUNSTER . ¯
Galway .... Leitrim ... Mayo ... Roscemmon .... Sligo ... CONNACHT .... CavtLrl ... Donegal .... Monaghan .... 37 1,57O 48 60 69 41 76 47 46 5° 86 68 2 1,813 64 2,892 24 6,2II 813 14 4 4 6 35 5 397 3 20 9I 83 84 44 124 89 62 115 i28 lO6 5I 52 31 38 I19 56 75 88 144 75 I27 i2,486 1,003 209 188 127 325 227 188 650 36I 269 246 4,839 319 441 333 200 357 396 276 485 385 27° 373 I7,325 1,322 650 521 327 682 623 464 1,I35 746 539 2,I98 93 338 I2o I34 I42 77 904 163 43 125 63 55 449 88 I34 95 3,II6 5 725 8 I25 lO5 4 972 81 2 7 6 3 99 3 I6 ! 3,882 116 67° 176 282 214 145 1,6o3 233 73 208 95 io2 711 1o6 195 83 6,964 250 405 220 344 169 99 i ,487 512 57 27° 88 IOO 1,O27 114 242 47 16,16o 464 2,I38 524 885 630 325 4,966 989 175 61o 252 260 2,286 3II 587 226 8,547 51o 1,723 637 816 821 508 5,OI5 1,23° 215 571 409 305 2,730 315 584 357 24,707 974 3,861 1,16i 1,7Ol 1,451 833 9,98I 2,219 390 1~181 661 565 5,O16 626 1,17I 583
Ut,ffrm~ (part) .. 317 20 384 403 1,124 1,256 2,380
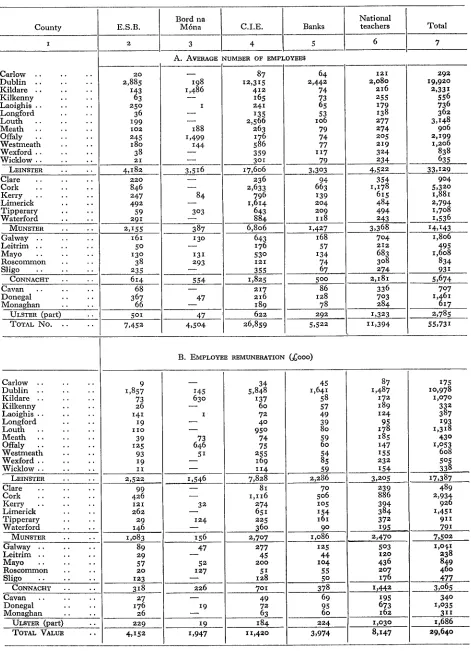
TABLE 8 : AVERAGE NUMBER OF EMPLOYEES AND EMPLOYEE REMUNERATION IN CERTAIN GROUPS 1958 County I Carlow ... Dublin ... Kildare ... Kilkenny .... Laoighis ... Longford .... Louth ... Meath ... Offaly ... Westmeath .... Wexford ... Wicklow ... LEINSTER
Clare ¯ ¯ Cork . Kerry . Limerick Tipperary Water ford Bord na M6na National teachers
E.S.B. C.I.E. Banks Total
2 3 4 5 6 7
A. AVERAGE NUMBl~ OF EMPLOYEES
2O 2,885 143 63 25° 36 199 I02 245 18o 38 21 4,182, 198 1,486 I 188 1,499 144 3,516 84 303 87 I2,315 412 165 241 135 2,566 263 176 586 359 3oi I7,6o6 236 2,633 796 1,614 643 884 64 2,442 74 73 65 53 lO6 79 74 77 117 79 3,303 94 663 139 2o4 2o9 i18 220 846 247 492 59 29I IZI 2,080 216 255 179 138 277 274 205 219 324 234 4,522 354 1,178 615 484 494 243 292 19,92o 2,33I 556 736 362 3,I48 906 2,199 1,2o6 838 635 33,I29 904 5,320 1,881 2,794 1,7o8 1,536
MUNSTER ¯ ¯ 2,155 387 6,806 1,427 3,368 14,143
Galway .... 16 z 13° 643 x 68 704 1,8o6
Leitrim .... 50 -- 176 57 212 495
Mayo .... I3O 131 53° 134 683 1,608
Roscommon ¯ ¯ 38 293 121 74 3°8 834
Sligo .... 235 -- 355 67 274 93I
CONNACHT ¯ ¯ 614 554 1,825 500 2,I8I 5,674
Cavan .... 68 -- 217 86 336 707
Donegal ¯ ¯ 367 47 216 128 703 1,461
Monaghan ¯ ¯ 66 -- I89 78 284 617
ULSTER (part) ,. 501 47 622 292 1,323 2,785
TOTAL No ... 7,452 4,504 26,859 5,522 11,394 55,731
B EMPLO’~E aEMUNE~TION (£OOO)
Carlow ¯ ¯ Dublin . ¯ Kildare ¯ ¯ Kilkenny Laoighis ¯. Longford Louth ¯ ¯ Meath ¯ ¯ Offaly ¯ ¯ Westmeath Wexford .. Wicklow ¯.
LEINSTER
Clare .. Cork ¯ ¯ Kerry ¯ ¯ Limerick Tipperary Waterford
MUNSTER
Galway ¯ ¯ Leitrim .. Mayo ¯ ¯ Roscommon Sligo ¯
CONNACHT ¯ ¯
Cavan ... Donegal .... Monaghan .... ULSTER (par0 ..
TOTAL VALUE ..
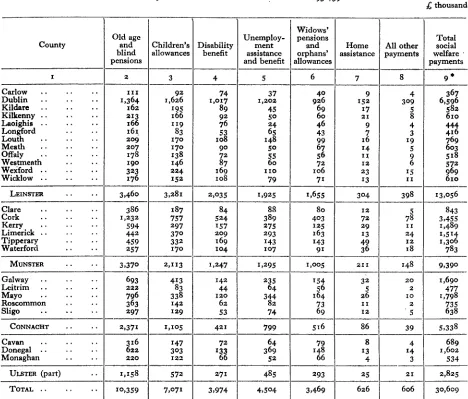
TABLE 9: SOCIAL WELFARE PAYMENTS x958[59
£ thousand
Widows’
Old age Unemploy- pensions Total
County and Children’s Disability ment and Home All other social blind allowances benefit assistance orphans’
pensions and benefit allowances assistance payments paymentswelfare "
I 2 3 4 5 6 7 8 9*
?~arlow ... III 92 74 37 4° 367
Dublin ... 1,364
9
i ,626 1,017 1,202 926 I52 3094 6,596
Kildare ... 162 195 89 45 69 17 582
Kilkenny ... 213 166 92 5o 60 2I 58 6Io
Laoighis ... 166 I19 76 24 46
Longford .... x6x 83 53 65 43 97 43 444416
Louth ... 209 I7o xo8 x48 99 16 19 769
Meath ... 207 I7o 90 5o 67 14 603
Dffdy ... 178 I38 72 55 56 I1 5 518
Weatmeath .... I9o 146 87 6o 72 I2 69
Nexford ... 323 224 I69 IIO lO6 23 I5 969571
Nicklow ... 176 lO8 79 7I I3 1I 6IO
LEINSTER .... 3,460 3,281 2,035 1,925 1,655 304 398 I3,o56
21are ... 386 I87 84 88 8o I2 5 843
2ork ... 1,232 757 524 389 403 72 78 3,455
Kerry ... 594 297 157 275 I25 29 II i ,489
Limerick ...
ripperary .... 442459 370332 209I69 293143 I63I43 13 24I2 1,5141,3o6
Waterford .... 257 I7o lO4 Io7 91 4936 18 783
MUNSTER .... 3,37° 2,113 1,247 1,295 I, 005 21I 148 9,390
~alway ... 693 413 142 235 154
32
20 1,69oLeitrim ... 22"~ 83 44 64 56 5 2 477
Mayo ... 796 338 I20 344 164 26 IO 1,798
Roscommon .... 363 142 62 82 73 ii 2 735
31igo ... 297 129 53 74 69 I2 5 638
CONNACHT .... 2,371 I,xo5 421 799 5~6 86 39 5,338
~avan ... 316 I47 72 64 79 8 4 689
Donegal ... 622 303 z33 369 148 x3 I4 1,6o2
VIonaghan .... 220 i22 66 52 66 4 3 534
ULSTER (part) .. 1,I58 572 271 485 293 25 2I 2,825
TOTAL ... lO,359 7,o71 3,974 4,504 3,469 626 606 30,609
*Figures in col. 9 may differ in some cases from the total of cols. 2-8 because of rounding to nearest £1,ooo.
TABLE 10: INCOME CHARGED TO INCOME TAX AND YIELD OF TAX
£ thousand
Assessment year 1961-62 Income arising 196o--61
Profits Income Tax assessed Total taxes on personal income
County Tax on
salaries, wages, etc. Salaries, wages, etc. All other Total income assessed 6 8
I 2 3 4 5 7
Carlow ... Dublin ... Kildare ... Kilkenny .... Laoighis ... Longford .... Louth ... Meath ... Offaly ... Wcstmcath .... Wexford ... Wicklow ... 67 1o,544 15o IIO 63 8o 344 154 I21 97 194 245 625 75,148 1,392 1,213 647 633 2,743 1,355 I,I00 958 1,838 2,371 809 79,039 x ,747 1,579 888 778 3,o48 1,862 1,349 1,277 2,246 2,694 470 8o,319 1,788 891 538 460 2,264 620 692 1,1o6 1,215 1,o45 1,279 159,358 3,535 2,470 1,426 1,238 5,312 2,482 2,041 2,383 3,46I 3,739 34 6,846 70 68 34 33 I96 38 50 4o 84 77 293 I2,771 616 503 350 255 597 652 462 5o1 638 669
LEINSTER .... 7,57° I2,I69 90,023 91,4o8 97,316 I88,724 18,3o7 Clare ... Cork ... Kerry ... Limerick .... Tipperary .... Waterford .... 78 1,474 I32 329 308 221 856 i 1,298 1,477 3,oo4 2,902 1,951 1,176 I2,847 1,826 3,641 3,595 2,352 382 2,766 555 1,027 1,o49 678 42 1,186 83 20I 20I 10I 919 i3,888 1,385 2,929 2,648 1,34° 2,095 26,735 3,2I I 6,570 6,243 3,692
MUNSTER .... 1,814 2,542 ZI,488 23,1o9 25,437 48,546 6,457
Galway ... Leitrim ...
Mayo .... ¯ ¯
Roscommon .... Sligo ... CONNACHT .... 2,246 357 1,217 530 782 4,838 806 3,372 1,439 1,826 119 17 56 26 5I 193 28 178 58 76 2,029 321 1,792 633 821 2,592 449 2,155 909 1,o44 93° 163 604 344 321
269 533 5,596 5,I32 7,I49 12,281
Cavan ... Donegal .... Monaghan .... 694 2,495 704 1,67I 4,I39 1,626 57 237 65 39 67 43 722 1,298 668 272 686 316 949 2,841 958
ULSTER (part) .. 149 359 3,893 2,688 4,748 7,436 1,274
TOTAL .... 9,802 15,6o3 12I,OOO 122,337 134,65o 256,987 28,400
TABLE IX: CERTAIN ECONOMIC STATUS INDICATORS
Per xooo Per iooo population x96o gainfully
occupied x95x 7. Pop. 196t
County as
I. Marriages 2. Private 3. Radio 4. Rateable 5. Private 6. Higher percentage x959-6I cars licenees valuation domestic status pop. x926 (annual av.) registered
(+xooo)
servants personnelI 2 3 4 5 6 7 8
£
~arlow ... 5"0 68 256 5’6 56 xo9 97
Dublin ... 5"6 69 x95 5’8 58 xo4 x42
Kildare ... 4"8 69 x48 5"6 58 xo9 III
Kilkermy .... 4"1 69 I31 6"2 52 IOI 87
L,aoighis ... 4"5 7x x69 5’7 39 83 87
Longford .... 3"6 57 x87 5"2 39 64 77
Louth ... 5"3 59 252 4"7 42 84 xo7
,VIeath ... 4’6 73 x53 8"9 60 1o3 xo3
~faly ....
Westmeatl~ .... 4"7
6x x56 5"3 37 76 98
4"5 62 2x9 6"5 48 IOO 93
Wexford ... 4"6 60 x87 5.i 64 87 87
Wicklow ... 5"0 62 x25 5"8 76 IOO 102
LEINSTER .... 5"6 67 187 5"8 56 99 xx6
21are ... 4" I 45 148 4"9 3I 78
~ork ... 5"8 66 x7x 4"9 52 90
Kerry ... 3"6 47 13I 3’2 39 48 78
Limerick .... . 60 2io 5.0 62 87 95
ripperary .... 4"54"4 74 I7X 5"9 49 9z 88
Waterford .... 5"3 64 231 5"6 57 xx5 9x
MUNSTER .... 4"6 6i x75 4"9 5° 8i 88
3alway ... 3"6 43 x44 4"0 30 6o 88
~eitrim ... 2II 20 38 60
~ayo ... 3"83.0 5335 x62 4"33"2 23 4x 7x
~oseommon .... 3"5 44 x6o 5"4 20 49 7I
31ig0 ... 4.0 45 x75 4"5 33 58 75
CONNACHT .... 3"4 42 x6x 4.I 26 5° 76
2avan ... 4"I 5o 97 5°I 33 48 69
Donegal .... 3.6 42 x49 3’2 38 47 75
,Vionaghan .... 4"4 51 xx4 6’0 37 63 72
ULSTSa (part) .. 3"9 46 128 4"3 37 5I 72
TOTAL .... 4"9 6o x75 5"2 47 82 95
TABLE IZ: SOME DERIVED STATISTICS
Percentage distribution
of income arising Per head of population Income in
Emp.
tern.
County Agri- agri- per Per acre Per £
culture, Income Personal Col. 6 culture head agri- valuation forestry Other arising income as % of per male special cultural
fishing Col. 5 engaged group land
I 2 3 4 5 6 7 8 9 IO II
%
%
%
£
£
%
£
£
£
£
Carlow .. 41 28 3I 172 2I5 I25 409 407 I3"9 18"o
Dublin . ¯ 2 38 6o 259 231 89 416 439 19"4 17"1
Kildare .. 36 31 33 193 227 118 516 367 13.o I8"I
Kilkenny ¯ ¯ 48 25 27 177 219 124 425 388 I1"9 17"9
I,aoighis .. 46 25 29 164 204 124. 368 361 lO’3 16"9
Longford ¯ ¯ 46 18 36 116 17° 14.7 23I 34° 7’9 13"3
Louth .... 16 48 36 i86 18o 97 335 382 I1’6 I3"2
Meatb .. 56 19 25 174 222 128 458 348 xI’6 13"2
Offaly . ¯ 37 37 26 163 200 123 333 370 9"0 15"7
Westmeath ¯ ¯ 37 20 43 154 204 I32 324 369 8"2 11’6
Wexford . . 46 20 34 148 185 125 383 347 1I’2 18"6
Wicklow . ¯ 29 32 39 158 203 i28 364 353 I0"2 13"5
LEINSTER .. I5 34 51 216 218 I01 387 417 II’2 15"5
Clare .... 54 13 33 129 167 129 308 369 9’9 19’0
Cork .... 29 31 40 184 199 lO8 421 396 13’2 22"0
Kerry .. 53 16 31 135 174 129 367 369 16"1 37’7
Limerick ¯ ¯ 34 25 4I 172 204. 119 434 399 I3"I 19"6
Tipperary ¯ ¯ 47 24 29 17o 212 125 4.4o 392 11’8 18"6
Water ford . . 31 29 40 187 218 117 486 385 I2"I 18"O
MUNSTER .. 37 26 37 I69 197 117 406 391 12"7 21"6
Galway .. 45 16 39 136 178 I3I 269 380 11"6 23"7
Leitrim ¯ ¯ 52 17 31 I20 167 139 2IO 326 7"9 17’9
Mayo .... 48 17 35 113 153 135 220 363 11"7 25"4
Roseommon .. 55 13 32 128 17o 133 26o 355 8"9 16"1
Sligo .... 41 21 38 139 174 125 275 360 lO.3 18"7
CONNACHT ¯ ¯ 47 16 37 127 168 132 247 365 lO"5 2I’I
Cavan .... 4.7 18 35 128 164 128 237 34° 8"9 15"3
Donegal ¯ ¯ 38 25 37 119 153 129 214 355 12"0 21"2
Monaghan .. 40 20 40 134 175 I31 235 335 9"I 12"3
ULSTER (part) 41 22 37 124 16o 129 226 347 I0’I 16"4
TOTAL .. 26 3° 44 181 200 IIO 337 402 11"5 18.6