doi:10.4236/jssm.2010.32027 Published Online June 2010 (http://www.SciRP.org/journal/jssm)
An Importance-Performance Analysis of Primary
Health Care Services: Managers vs. Patients
Perceptions
Francisco J. Miranda, Antonio Chamorro, Luis R. Murillo, Juan Vega
Economics and Business Management Faculty. University of Extremadura, Badajoz, Spain. Email: [email protected]
Received February 10th, 2010; revised March 11th, 2010; accepted April 15th, 2010.
ABSTRACT
Using importance-performance analysis (IPA), this paper examines the perceptions of patients and managers of health centres of several health care quality services attributes. IPA is an approach to the measurement of customer/user sat-isfaction which allows for a simple and functional identification of both the strong and the weak aspects, or improve-ment areas, of a given service. Taking both the importance assigned by users to all relevant aspects of a given service and the perceived performance of the establishment in providing the service, the result is an IPA grid with four quad-rants. To the best of our knowledge, this is the first time this methodology has been used to compare the perceptions of health centre patients and managers. The results showed patients and managers to have very different perceptions of all the quality service attributes. Implications for researchers and health centre managers are discussed. The study illus-trates the usefulness of the IPA model as a managerial tool in identifying areas to which marketing resources should be allocated in order to improve and enhance the quality of the health centre services provided.
Keywords: Health Services, Importance-Performance Analysis, Patient Perception, Satisfaction, Service Quality
1. Introduction
Health care providers are increasingly using higher levels of service quality to satisfy patients. Indeed, satisfaction surveys have been used widely as a management tool to address the problems of access and performance. They have also been instrumental in helping government agen-cies identify target groups, clarify objectives, define mea- sures of performance, and develop performance informa-tion systems. In addiinforma-tion, the emerging health care lit-erature suggests that patient satisfaction is a dominant concern that is intertwined with strategic decisions in the health services [1].
The present work attempts to formulate a strategic vi-sion to enable health care centres and the overall health care system to deliver higher levels of patient satisfaction. Although numerous studies have examined patients’ as-sessments, many questions still remain unanswered. Pa-tients’ evaluations of quality remain unclear because, in the absence of medical training, they are less qualified than their providers to determine technical competence. Additionally, the number of distinct concepts upon which patients base their evaluations is questionable.
The relationship between the established variables and the models that deal with satisfaction and quality pro-vides a unique research opportunity to enhance manage-rial understanding. This paper exploits this opportunity by identifying both the importance and the performance of service quality attributes in Spain's health care system using the importance-performance analysis (IPA) model. In particular, the perceptions of health centre patients and managers are compared in terms of the importance and performance of service quality attributes.
To the best of our knowledge, this is the first time that the IPA methodological approach has been used to com-pare the perceptions of health centre users and managers. Our research extends the existing literature in two direc-tions. Firstly, unlike prior studies with similar objectives, we consider a wide range of attributes to reflect the most relevant dimensions in primary health service, and sec-ondly, the method allows a direct comparison to be made between users’ and managers’ perceptions.
Then, we analyze the main results of our study, and fin-ish with the conclusions and final reflections.
2. Methods
Importance-performance analysis conceptually underlies the multi-attribute models that date back to the late 1970s. Martilla and James [2] were the first to apply the IPA technique to analyze the performance of a car dealer’s service department. They declared IPA to be a low-cost, easily understood technique for exploring different aspe- cts of the marketing mix, and enabling managers to real-locate resources according to the four areas identified.
Originally devised with marketing uses in mind, the applications of IPA now extend to a wide range of fields, including health service provision [3-9].
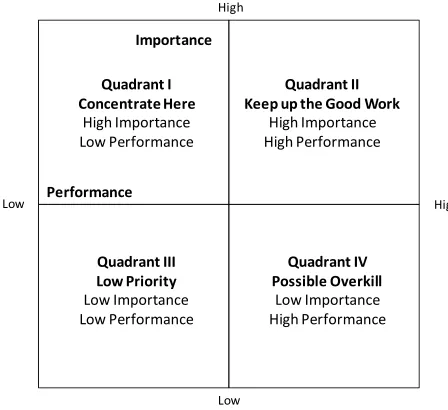
The key objective of IPA is diagnostic in nature. It aims to facilitate identification of attributes for which, given their importance, the product or service underper-forms or overperunderper-forms. To this end, the interpretation of the IPA is graphically presented on a grid divided into four quadrants. Figure 1 illustrates the IPA grid. The Y- axis reports the customers’ perceived importance of se-lected attributes, and the X-axis shows the product’s (or service’s) performance in relation to these attributes. The four identifiable quadrants are: Concentrate Here, Keep up the Good Work, Low Priority and Possible Overkill.
Therefore, IPA provides a useful and easily under-standable guide to identifying the most crucial product or service attributes in terms of their need for managerial action, and hence to developing successful marketing programs to achieve competitive advantage.
Attribute importance is generally regarded as a per-son’s general assessment of the significance of an attrib-ute for a product. Many studies have attempted to ana-lyse customer satisfaction in terms of both expectations
Performance
Importance
High High
Low
Low Quadrant I
Concentrate Here
High Importance Low Performance
Quadrant II Keep up the Good Work
High Importance High Performance
Quadrant III Low Priority
Low Importance Low Performance
Quadrant IV Possible Overkill
[image:2.595.56.280.502.707.2]Low Importance High Performance
Figure 1. Importance-Performance analysis grid
that relate to certain important attributes and judgements of the performance of those attributes [10,11]. However, there appears to have been some diversity in the conclu-sions drawn about how one should relate attribute im-portance and performance.
There exists a variety of approaches to defining meas-ures of importance. In particular, two quite different kinds of measure are common in IPA applications: 1) direct measures based on Likert scale, k-point scale, or metric ratings obtained in the same way as for performance, and 2) indirect measures obtained from the performance scores, either by multivariate regression of an overall product or service rating on the ratings given to the indi-vidual attributes [4,12-15] or by means of conjoint analysis techniques [12,16,17].
A recent review of these methods [18] supports earlier studies [19] in finding that direct measures capture the importance of attributes better than indirect measures. We therefore used a Likert scale to measure importance.
3. Data and Results
The first step in implementing the IPA analysis was to define a suitable questionnaire. The questionnaire for this study included two main sections. The first section con-sisted of 25 health care centre attributes, for which pa-tients were asked to indicate the perceived importance of each attribute and their perceptions of actual health care centre. These 25 attributes were identified based on a review of the relevant literature [1,5,9]. The question-naire was structured so that each health care centre at-tribute was scored on a 7-point Likert scale, ranging from 1 (least important) to 7 (most important) in the Impor-tance part, and from 1 (strongly disagree) to 7 (strongly agree) in the Performance part.
The second section was designed to elicit socio-dem- ographic information about the respondents. Prior to the main survey, a pilot study was conducted comprising 10 patients, 10 health professionals, and 10 health manage-ment experts. This led to several items being re-worded to improve their comprehensibility and the overall clarity of the instrument. In particular, this pre-test revealed that respondents perceived some of the items included in the scale to be redundant. Because this redundancy led to frustration and low response rates, the researchers agreed to further reduce the number of items.
con-tained in the research instrument were converted to posi-tive connotations.
In September 2008, questionnaires were mailed to 20000 patients who had used the health care services of Extremadura (a Region in southwest Spain) within the previous month. Due to its extensive area (41634 km²) and low population density (26.18 inhab/km²), Extre-madura has structured its health care system around two territorial administrative levels of aggregation: Health Areas and Basic Health Zones. There are 8 Health Areas, each consisting of a number of Basic Health Zones. The total population covered is 1081845 inhabitants, and in 2008 the number of operating Basic Health Zones was 105, each organized around a Health Care Centre as the main provider of primary health care services in the zone. There were 2556 returns, for a 12.78% response rate. Questionnaires were also mailed to the 105 Extremadura health centre managers. There were 88 returns, yielding a 4.2 sample error. The study’s technical record is presen- ted in Table 1.
Comparison of the respondents’ gender and age dis-tributions with those of the target population showed no significant differences between the two groups.
The demographic profile of the respondents is present- ed in Table 2. The largest group of respondents (60.15%) was aged > 65 years. The next largest group (28.2%) was aged 30-45 years. Female respondents represented a little more than 60% of the survey population.
Table 1. The study’s technical sheet
USERS MANAGERS
TARGET POPULATION
Users of Extremadura Health Services
Managers of Extre-madura Health Services
GEOGRAPHICAL
AREA Extremadura (Spain)
SAMPLE
DIMENSION 2566 questionnaires 88 questionnaires
SAMPLE
ERROR 1.9% 4.2%
CONFIDENCE
LEVEL 95% z = 1.96 p = q = 0.5
SAMPLE DESIGN
Stratified random sampling (in proportion to the users
of each health care centre) Entire population
PERIOD OF DATA COLLECTION
10 September 2008 to 15 January 2009
Table 2. Profile of surveyed users
Gender Male: 39.85% Female: 60.15%
Age 45-64 years: 24.98% > 65 years: 60.15% < 30 years: 9.6% 30-45 years: 28.23%
Descriptive statistics including simple frequencies and mean scores were computed for the respondents’ demo-graphics and for the 25 attributes. IPA was then used to compare the patients’ and managers’ perceptions of these attributes. Each attribute was plotted according to the mean score of its perceived importance and performance, with the importance of attributes on the vertical axis from low (bottom) to high (top), and the performance of at-tributes on the horizontal axis from low (left) to high (right). The four quadrants are constructed with cross- hairs set at the average scores of the Importance and Per-formance scores [2,3,8]. For patients (Figure 2), these averages for the pooled data were: importance 4.94, and performance 5.77. For health centre managers (Figure 3), they were: importance 6.26, and performance 5.45.
These figures show that patients and managers have different perceptions of the 25 factors. The following pa- ragraphs describe some of the meaningful insights gath-ered from this “quadrant” presentation.
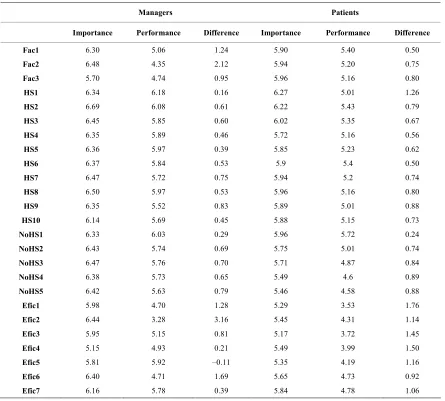
Table 3 lists the aggregate importance and perform-ance values of each attribute together with the difference between the two for patients and managers. That all the importance scores are higher than the performance scores implies that there is room for improvement in all the ar-eas. To decide, however, which attributes most merit im- provement; one can analyze the discrepancies between the performance and importance scores, so that attributes with greater differences will be given higher priority [20]. In this regard, in order to maintain as far as possible the original structure of the IPA, information from the IPA grid was combined with the differences between the per-formance and importance scores (see Table 3).
The first interesting conclusion to be drawn from Fig-ure 2 is that the data show a clear trend of the most im-portant attributes for the patient also being scored as the best performing, showing that the Region’s health care system appears to have clearly identified the user’s needs and concentrated its effort on the most relevant variables. The Concentrate Here quadrant captured a single at-tribute for patients: health centre’s timetable (Efic7). This attribute also presents a major discrepancy between importance and performance (see Table 3), so that it calls for especial attention. In Figure 3, the managers include four attributes in this quadrant: cleanliness of facilities (Fac1), equipment at the health centre (Fac2), level of bureaucracy (Efic2), and time to focus on each patient (Efic6).
Efic1
Efic3
Efic4
Efic5 Efic2
NoHS5 NoHS4
Efic6 NoHS3 Efic7
5,00 5,50 6,00 6,50
3,50 4,00 4,50 5,00 5,50 6,00 6,50
NoHS2 HS4 HS9
Fac 2
HS10 HS8
HS7
HS5 HS3
HS6 Fac3
NoHS1 Fac1
HS2 HS1
Concentrate here
Keep up
the Good Work
Low priority
Possible Overkill
[image:4.595.62.534.94.314.2]IMPORTANCE PERFORMANCE
Figure 2. IPA grid of primary health care service (patients)
Efic1
Efic3
Efic4
Efic5
Efic2 Efic6
Efic7 Fac 2
HS10
Fac3 Fac1
HS2
HS1
5,00 5,50 6,00 6,50 7,00 7,50
3,00 3,50 4,00 4,50 5,00 5,50 6,00 6,50 7,00 7,50
Concentrate here
Keep up
the Good Work
Low priority
Possible Overkill
[image:4.595.65.535.259.622.2]IMPORTANCE PERFORMANCE
Figure 3. IPA grid of primary health care service (managers)
this quadrant. According to Table 3, the administration should focus on improving the “non-health staff interest in solving the patients’ problems” (NoHS5) as it presents the greatest potential for improvement (0.79). This sends a meaningful message to health centre managers in that
The Low Priority quadrant identifies those items whe- re health centres are performing adequately but patients perceive them as less important when compared with other attributes. Nine attributes are perceived as of low importance by the patients, but some of them present the greatest improvement potential (see Table 3). This is the case for some of the efficiency attributes (ease of making an appointment, bureaucracy, waiting times in the health centre before entering the consulting room, speed of complementary tests, and time to focus on each patient). While these attributes are perceived as of lower impor-tance than others, their great improvement potential must be taken into account. Thus, those patients did not per-ceive these attributes as being important does not mean that managers should reduce their effort to improve these services. On the contrary, these service categories are often considered to be the basic attributes for patients who might simply be regarding them as necessary
ser-vice provisions without being aware of their importance. The managers include 4 attributes in this quadrant, but some of them have the highest improvement potential. This is the case for two efficiency attributes―ease of making an appointment (1.28) and speed of complemen-tary tests (0.81)―and for the location for accessibility of the health centre (0.95). While their importance is less than that of other attributes, again their great improve-ment potential must be taken into account in defining policies to improve health centre service quality.
[image:5.595.77.522.324.725.2]Finally in the Possible Overkill quadrant, our analysis identifies only two attributes (trust in health staff, HS4, and non-health staff professionalism, NoHS2) by patients and three by managers (complaints resolution, Efic5; he- alth centre’s timetable, Efic7; and health staff’s prestige, HS10) as being of low importance with relatively high performance. In all of them the improvement potential is also low, so that they should be given only low priority.
Table 3. Aggregate performance and importance scores of each attribute (patients and managers)
Managers Patients
Importance Performance Difference Importance Performance Difference
Fac1 6.30 5.06 1.24 5.90 5.40 0.50
Fac2 6.48 4.35 2.12 5.94 5.20 0.75
Fac3 5.70 4.74 0.95 5.96 5.16 0.80
HS1 6.34 6.18 0.16 6.27 5.01 1.26
HS2 6.69 6.08 0.61 6.22 5.43 0.79
HS3 6.45 5.85 0.60 6.02 5.35 0.67
HS4 6.35 5.89 0.46 5.72 5.16 0.56
HS5 6.36 5.97 0.39 5.85 5.23 0.62
HS6 6.37 5.84 0.53 5.9 5.4 0.50
HS7 6.47 5.72 0.75 5.94 5.2 0.74
HS8 6.50 5.97 0.53 5.96 5.16 0.80
HS9 6.35 5.52 0.83 5.89 5.01 0.88
HS10 6.14 5.69 0.45 5.88 5.15 0.73
NoHS1 6.33 6.03 0.29 5.96 5.72 0.24
NoHS2 6.43 5.74 0.69 5.75 5.01 0.74
NoHS3 6.47 5.76 0.70 5.71 4.87 0.84
NoHS4 6.38 5.73 0.65 5.49 4.6 0.89
NoHS5 6.42 5.63 0.79 5.46 4.58 0.88
Efic1 5.98 4.70 1.28 5.29 3.53 1.76
Efic2 6.44 3.28 3.16 5.45 4.31 1.14
Efic3 5.95 5.15 0.81 5.17 3.72 1.45
Efic4 5.15 4.93 0.21 5.49 3.99 1.50
Efic5 5.81 5.92 –0.11 5.35 4.19 1.16
Efic6 6.40 4.71 1.69 5.65 4.73 0.92
In order to analyze the possible discrepancies between the perceptions of the health centre patients and managers about service quality, we performed a t-test with the fol-lowing hypotheses:
H0: µPatients = µManagers
[image:6.595.62.283.360.723.2]Ha: µPatients≠ µManagers
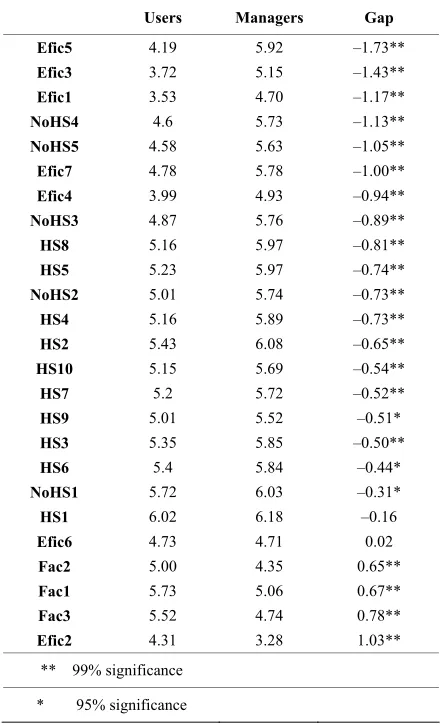
Table 4 presents the results for the difference between the patients’ and the managers’ perceptions. One ob-serves that for 23 of the 25 items the null hypothesis of equal means can be rejected at a 95% confidence level.
Most of the gaps between the patients’ and the manag-ers’ perceptions are negative and statistically significant, indicating that the managers are too optimistic about the service that they provide. The differences are particularly important for efficiency attributes, in particular, the ease of making an appointment (Efic1), waiting times in the health centre before entering the consulting room (Efic3), and complaints resolution (Efic5), for which the patients have a markedly lower perception of quality.
Table 4. Health centres’ perceived service quality (patients vs. managers)
Users Managers Gap
Efic5 4.19 5.92 –1.73**
Efic3 3.72 5.15 –1.43**
Efic1 3.53 4.70 –1.17**
NoHS4 4.6 5.73 –1.13**
NoHS5 4.58 5.63 –1.05**
Efic7 4.78 5.78 –1.00**
Efic4 3.99 4.93 –0.94**
NoHS3 4.87 5.76 –0.89**
HS8 5.16 5.97 –0.81**
HS5 5.23 5.97 –0.74**
NoHS2 5.01 5.74 –0.73**
HS4 5.16 5.89 –0.73**
HS2 5.43 6.08 –0.65**
HS10 5.15 5.69 –0.54**
HS7 5.2 5.72 –0.52**
HS9 5.01 5.52 –0.51*
HS3 5.35 5.85 –0.50**
HS6 5.4 5.84 –0.44*
NoHS1 5.72 6.03 –0.31*
HS1 6.02 6.18 –0.16
Efic6 4.73 4.71 0.02
Fac2 5.00 4.35 0.65**
Fac1 5.73 5.06 0.67**
Fac3 5.52 4.74 0.78**
Efic2 4.31 3.28 1.03**
** 99% significance
* 95% significance
There are also significant differences in several attrib-utes related to attribattrib-utes of the non-health staff: kind-ness and politekind-ness (NoHS3), attention to patients’ pro- blems (NoHS4), and interest in solving patients’ prob-lems (NoHS5). The case is similar for some of the health staff attributes―personalized service (HS5) and interest in solving the patients’ problems (HS8)―where again the managers are overestimating the patients’ perceived qua- lity of these attributes.
In contrast, the managers undervalue attributes relating to the facilities: cleanliness (+0.65), equipment (+0.68), and location for accessibility (+0.78). They also under-value one efficiency attribute: the level of bureaucracy (Efic2).
In general therefore, one can say that the managers’ perception of the service provided in their health centres is quite distant from the views of patients.
4. Conclusions
Using IPA, this study has compared the importance and performance of 25 service quality attributes as perceived by health centre patients and managers. They were found to have quite different perceptions of the quality of those attributes.
The measurement of patient perceptions provides a valuable dimension of insight into the process by which the quality of health care service is evaluated. In order to identify and correct service quality problems quickly, managers need to understand patients’ perceptions of the quality of service actually delivered. The present results have shown, however, that managers have a quite differ-ent perception of the service provided in their health cen-tres from that of the patients. In particular, they are over-estimating the perceived quality of almost all the service quality attributes that we studied.
The findings have implications for managing primary health care centres. In particular, the perceived quality of a health care centre depends mainly on dimensions that are closely linked to the health personnel who are in touch with the patient, as well as to certain measures of efficiency―the ease of making an appointment, level of bureaucracy, waiting times before entering the consulting room, speed of complementary tests, complaints resolu-tion, time to focus on each patient, and the timetable of the health centre.
quality attributes being studied. Second, using the results provided by IPA, managers can tailor their marketing strategies to the patients’ perception of importance and performance revealed in each quadrant. This is a useful and effective way to identify problems and the reasons behind them.
In determining patients’ needs and expectations, health centre managers will be better able to prioritize tasks, allocate resources, and match their marketing strategies to their target segments. Once the patients’ requirements have been clearly identified and understood, a manager will likely be in a better position to anticipate and cater to their desires and needs rather than merely react to their dissatisfaction [21]. Evaluating a health centre’s perform- ance from the patient’s point of view would improve the manager’s understanding of customer satisfaction. Pa-tients who are satisfied with their health centre’s service are more likely to spread favourable word-of-mouth pub-licity [22]. Knowing how patients perceive the quality of services and facilities is the means by which a health centre can achieve a competitive advantage, differentiate itself from competitors, foster customer loyalty, enhance its corporate image, increase business performance, and retain existing customers and attract new ones.
In an academic context, the use of IPA to investigate the differences between how patients perceive the impor-tance of health centre attributes and the centre’s actual performance in relation to those attributes could contrib-ute to broadening the scope of research studies in the area of consumer decision-process theory. In particular, the potential applications of IPA in several areas need to be addressed, including the analysis of the perception of quality in terms of different segments which would help health centre managers formulate and develop marketing strategies to meet the needs of each of those segments.
REFERENCES
[1] F. W. Gilbert, J. R. Lumpkin and R. P. Dant, “Adaptation and Customer Expectation of Health Care Options,” Jour- nal of Health Care Marketing, Vol. 12, No. 3, 1992, pp. 46-55.
[2] J. A. Martilla and J. C. James, “Importance-Performance Analysis,” Journal of Marketing, Vol. 41, No. 1, 1977, pp. 77-79.
[3] J. Abalo, J. Varela and V. Manzano, “Importance Values for Importance-Performance Analysis: A Formula for Spreading out Values Derived from Preference Rankings,”
Journal of Business Research, Vol. 60, No. 2, 2007, pp. 115-121.
[4] A. L. Dolinsky, “Considering the Competition in Strategy Development: An Extension of Importance-Performance Analysis,” Journal of Health Care Marketing, Vol. 11, No. 1, 1991, pp. 31-36.
[5] A. L. Dolinsky and R. K. Caputo, “Adding a Competitive Dimension to Importance-Performance Analysis: An Ap-plication to Rraditional Health Care Systems,” Health Care Marketing Quarterly, Vol. 8, No. 3, 1991, pp. 61-79.
[6] J. M. Hawes, G. E. Kiser and C. P. Rao, “Analysing the Market for Planned Retirement Communities in the Southwest,” Baylor Business Studies, Vol. 13, 1982, pp. 39-46.
[7] J. M. Hawes and C. P. Rao, “Using Importance-Per- formance Analysis to Develop Health Care Marketing Strategies,” Journal of Health Care Marketing, Vol. 5, No. 4, 1985, pp. 19-25.
[8] M. Hemmasi, K. C. Strong and S. A. Taylor, “Measuring Service Quality for Strategies Planning and Analysis in Service,” Journal of Applied Business Research, Vol. 10, No. 4, 1994, pp. 24-34.
[9] U. Yavas and D. J. Shemwell, “Modified Importance- Performance Analysis: An Application to Hospitals,” In-ternational Journal of Health Care Quality Assurance, Vol. 14, No. 3, 2001, pp. 104-110.
[10] J. Myers and M. Alpers, “Determining Attributes: Mean-ing and Measurement,” Journal of Marketing, Vol. 32, No. 4, 1968, pp. 1-4.
[11] J. Swan and I. L. Coombs, “Product Performance and Consumer Satisfaction: A New Concept,” Journal of Marketing, Vol. 40, No. 2, 1976, pp. 25-33.
[12] P. J. Danaher and J. Mattsson, “Customer Satisfaction during the Service Delivery Process,” European Journal of Marketing, Vol. 28, No. 5, 1994, pp. 5-16.
[13] S. A. Neslin, “Linking Product Features to Perceptions: Self-Stated Versus Statistically Revealed Importance Wei- ghts,” Journal of Marketing Research, Vol. 18, No. 1, 1981, pp. 80-86.
[14] S. A. Taylor, “Assessing Regression-Based Importance Weights for Quality Perceptions and Satisfaction Judg-ments in the Presence of Higher Order and/or Interaction Effects,” Journal of Retailing, Vol. 73, No. 1, 1997, pp. 135-159.
[15] D. R. Wittink and L. R. Bayer, “The Measurement Im-perative,” Marketing Research, Vol. 6, No. 4, 1994, pp. 14-22.
[16] P. J. Danaher, “Using Conjoint Analysis to Determine de Relative Importance of Service Attributes Measured in Customer Satisfaction Surveys,” Journal of Retailing, Vol. 73, No. 2, 1997, pp. 235-260.
[17] A. Ostrom and D. Iacobucci, “Consumer Trade-Offs and the Evaluation of Services,” Journal of Marketing, Vol. 59, No. 1, 1995, pp. 17-28.
[18] D. R. Bacon, “A Comparison of Approaches to Impor-tance-Performance Analysis,” International Journal of Marketing Research, Vol. 45, No. 1, 2003, pp. 55-71. [19] R. M. Heeler, C. Okechuku and S. Reid, “Attribute
Im-portance: Contrasting Measurements,” Journal of Mar-keting Research, Vol. 16, No. 1, 1979, pp. 60-63.
[20] U. Oberoi and C. Hales, “Assessing the Quality of the Conference Hotel Service Product: Towards an Empiri-cally Based Model,” The Service Industries Journal, Vol. 10, No. 4, 1990, pp. 700-721.
[21] C. Fornell, “A National Customer Satisfaction Barometer: The Swedish Experience,” Journal of Marketing, Vol. 56, No. 1, 1992, pp. 6-21.
[22] E. H. Watson, M. A. McKenna and G. M. McLean, “TQM and Services: Implementing Change in the NHS,”
Appendix A
Fac1: Cleanliness of facilities
Fac2: Equipment at the health centre
Fac3: Location for accessibility of the health centre
HS1: Health staff cleanliness
HS2: Health staff professionalism
HS3: Health staff kindness and politeness
HS4: Trust in health staff
HS5: Personalized service
HS6: Communication with health staff
HS7: Health staff’s attention to patients’ problems
HS8: Health staff’s interest in solving the patients’ problems
HS9: Health staff understand patients’ problems
HS10: Medical staff’s prestige
NoHS1: Non-health staff cleanliness
NoHS2: Non-health staff professionalism
NoHS3: Non-health staff kindness and politeness
NoHS4: Non-health staff attention to patients’ problems
NoHS5: Non-health staff interest in solving the patients’ problems
Efic1: Ease of making an appointment
Efic2: Level of bureaucracy
Efic3: Waiting times in the health centre before entering the consulting room
Efic4: Speed of complementary tests
Efic5: Resolution of complaints
Efic6: Time to focus on each patient