Original citation:
Piersma, Sjouke, Denham, Emma, Drulhe, Samuel, Tonk, Rudi H. J., Schwikowski,
Benno and van Dijl, Jan Maarten. (2013) TLM-Quant : An open-source pipeline for
visualization and quantification of gene expression heterogeneity in growing microbial
cells. PLoS One, Volume 8 (Number 7). Article number e68696.
Permanent WRAP url:
http://wrap.warwick.ac.uk/58494
Copyright and reuse:
The Warwick Research Archive Portal (WRAP) makes this work of researchers of the
University of Warwick available open access under the following conditions.
This article is made available under the Creative Commons Attribution- 3.0 Unported
(CC BY 3.0) license and may be reused according to the conditions of the license. For
more details see
http://creativecommons.org/licenses/by/3.0/
A note on versions:
The version presented in WRAP is the published version, or, version of record, and may
be cited as it appears here.
and Quantification of Gene Expression Heterogeneity in
Growing Microbial Cells
Sjouke Piersma1, Emma L. Denham1¤a, Samuel Drulhe2¤b, Rudi H. J. Tonk1, Benno Schwikowski2, Jan Maarten van Dijl1*
1Department of Medical Microbiology, University of Groningen and University Medical Center Groningen, Groningen, The Netherlands,2Institut Pasteur, Systems Biology Lab, Department of Genomes and Genetics, Paris, France
Abstract
Gene expression heterogeneity is a key driver for microbial adaptation to fluctuating environmental conditions, cell differentiation and the evolution of species. This phenomenon has therefore enormous implications, not only for life in general, but also for biotechnological applications where unwanted subpopulations of non-producing cells can emerge in large-scale fermentations. Only time-lapse fluorescence microscopy allows real-time measurements of gene expression heterogeneity. A major limitation in the analysis of time-lapse microscopy data is the lack of fast, cost-effective, open, simple and adaptable protocols. Here we describe TLM-Quant, a semi-automatic pipeline for the analysis of time-lapse fluorescence microscopy data that enables the user to visualize and quantify gene expression heterogeneity. Importantly, our pipeline builds on the open-source packages ImageJ and R. To validate TLM-Quant, we selected three possible scenarios, namely homogeneous expression, highly ‘noisy’ heterogeneous expression, and bistable heterogeneous expression in the Gram-positive bacteriumBacillus subtilis.This bacterium is both a paradigm for systems-level studies on gene expression and a highly appreciated biotechnological ‘cell factory’. We conclude that the temporal resolution of such analyses with TLM-Quant is only limited by the numbers of recorded images.
Citation:Piersma S, Denham EL, Drulhe S, Tonk RHJ, Schwikowski B, et al. (2013) TLM-Quant: An Open-Source Pipeline for Visualization and Quantification of Gene Expression Heterogeneity in Growing Microbial Cells. PLoS ONE 8(7): e68696. doi:10.1371/journal.pone.0068696
Editor:Peter Setlow, University of Connecticut, United States of America
ReceivedMarch 21, 2013;AcceptedJune 3, 2013;PublishedJuly 17, 2013
Copyright:ß2013 Piersma et al. This is an open-access article distributed under the terms of the Creative Commons Attribution License, which permits unrestricted use, distribution, and reproduction in any medium, provided the original author and source are credited.
Funding:S.P., E.L.D., S.D., R.H.J.T, B.S. and J.M.v.D. were in parts supported through the CEU (Commission of the European Union) projects LSHG-CT-2006-037469, PITN-GA-2008-215524 and 244093, and the transnational SysMO projects BACELL SysMO 1 and 2 through the Research Council for Earth and Life Sciences of the Netherlands Organization for Scientific Research. The funders had no role in study design, data collection and analysis, decision to publish, or preparation of the manuscript.
Competing Interests:The authors have declared that no competing interests exist. * E-mail: [email protected]
¤a Current address: Division of Microbiology and Infection, Warwick Medical School, University of Warwick, Coventry, United Kingdom ¤b Current address: Theoretical BioPhysics Lab, Humboldt Universita¨t zu Berlin, Berlin, Germany
Introduction
Microorganisms need to adapt to environmental changes by appropriately adjusting their gene expression [1]. They can achieve this through carefully controlled signal transduction pathways that modulate the transcription of individual genes. In recent years it has become increasingly clear that the expression of particular genes is often not uniform in the individual cells of a microbial population, even when these cells are grown under carefully controlled conditions. Firstly, there can be considerable noise or heterogeneity in the expression levels of individual genes, and secondly, there can even be situations of bistability where particular genes are only transcribed in a sub-population of the analysed cells. A paradigm for studies on gene expression heterogeneity is the bacteriumBacillus subtilis. IndividualB. subtilis cells within a population can, for example, differentiate into a motile state for migration to more favourable environments, a competent state to take up DNA from the environment, or a dormant state in the form of spores [2,3]. Microbial gene expression heterogeneity also has important biotechnological implications since, for obtaining the highest product yields, all
microbes used in industrial-scale fermentations should express the gene(s) of interest at the highest possible level; poorly producing cells are unwanted [4].
software [9–12]. Since we needed a simple and readily adaptable tool for the quantitative analysis of large amounts of time-lapse microscopy data, we established the TLM-Quant pipeline for data processing and analyses based on open-source software. This pipeline was validated using a custom-built fluorescence microscopy set-up and B. subtilis strains producing GFP from promoters that direct either homogenous, heterogeneous, or bistable gene expression, as described by Botellaet al.[6]. Importantly, the TLM-Quant pipeline was then effectively implemented in a large-scale systems biological analysis on the global network reorganization during dynamic adaptations ofB. subtilismetabolism to nutritional shifts between the preferred carbon sources glucose and malate [7]. In the latter study, TLM-Quant allowed us to verify the absence of heterogeneity in the expression of genes involved in central carbon metabolism. The respective datasets can be queried at https://basysbio.ethz.ch/ openbis/index.html?viewMode =
SIM-PLE#action = DOWNLOAD_ATTACHMENT&file = populatio-opulation+homogeneity.pdf&&entity = PROJECT&code = BASYS-BIO_BIG&space = BASYSBIO_PUBLIC or http://tinyurl.com/ basysbiodata. A detailed description of TLM-Quant as presented here and in the Tutorial S1 was however not published thus far.
Analysis
For image analysis by TLM-Quant, we will assume that, for each time point, a phase-contrast image and an overlapping
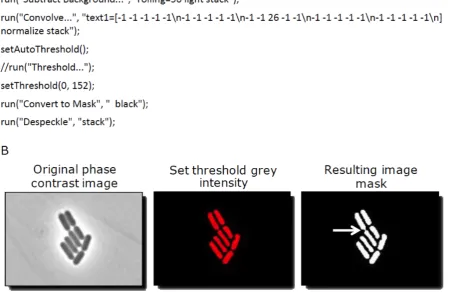
[image:3.612.60.512.373.665.2]fluorescent image are available, both encoded in 8-bits (intensity from 0 to 255). Downstream processing can be generalized to multiple channels (colours). To visualise and quantify gene expression heterogeneity, the fluorescence information in the recorded images is extracted using ImageJ software (available via http://rsbweb.nih.gov/ij/) [12]. To obtain correct cellular fluorescence measurements, cells are segmented in phase contrast images by using the commands ‘Subtract background’ and ‘Convolve’. The kernel used in the ‘Convolve’ command is specified in Figure 1A and should be adjusted depending on cell type and exposure time. A copy of the obtained image is converted to a binary mask (intensity 0 or 255) using the ‘apply’ command in the threshold dialogue. Figure 1 shows the ImageJ macro commands for this process and illustrates its performance starting from an original phase contrast image. The pixel intensities from the fluorescence image are then subtracted from the mask. This yields cells with inverted intensities that are analysed by setting a threshold for all grey values but the minimal grey value, and by subsequently executing the ‘analyse particles’ command. The original intensities are then recovered by subtracting the negative intensities from 255. To measure background fluorescence, the fluorescence images are first added to the mask, and only values below 255 are collected. In this way the entire area in the image, except the cell areas, is analysed using the ImageJ ‘analyse particles’ command and the returned value represents the average background fluorescence.
Figure 1. Processing phase contrast images to create segmented cells.(A) ImageJ commands for the processing of phase contrast images to create segmented cells. (B) Visualization of the image processing from the original phase contrast image, through background subtraction, convolution, setting of a threshold grey intensity, conversion of values within threshold to mask and de-speckling. Red objects in the processed image are above the threshold and counted as cells. Notably, non-separated pairs of cells as marked with the white arrow pointing at the site of their attachment will be counted as one cell.
doi:10.1371/journal.pone.0068696.g001
Results and Discussion
The code in Figure 2 is used to create plots as shown in Figure 3 (A-C). Importantly, the R script allows processing of data from many experiments in a short time period. The output is a high-resolution PDF file visualizing the levels of expression heteroge-neity. Figure 3 illustrates three possible heterogeneity scenarios, namely homogeneous expression (A), ‘highly noisy’ heterogeneous expression, (B) and bistable heterogeneous expression (C). Figure 2. Script used in the R software package to generate heatmap plots from ImageJ output data.Note that the indicated directories are arbitrary examples. The colors.csv file used in this script can be altered for implementing other color schemes.
doi:10.1371/journal.pone.0068696.g002
255–measured value–background
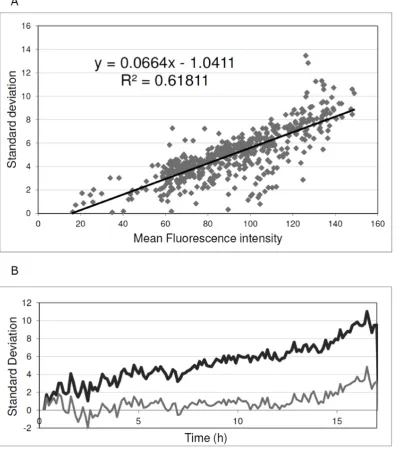
We recommend inclusion of controls for homogenous expres-sion, as in Figure 3A, in all analyses to measure background levels of expression noise. For studies inB. subtilis, we have implemented an amyE::Pspac-GFPmut2 strain in which homogeneous GFP expression can be set at different levels by growing the cells in the presence of different IPTG concentrations. This is due to the fact that, in this particular strain, the transcription ofgfpis driven by the IPTG-dependent Pspacpromoter. Specifically, we added IPTG to the growth medium at concentrations of 0.05 mM, 0.1 mM, 0.5 mM, or 1 mM and performed time-lapse fluorescence microscopy. As expected, this resulted in homogenous expression of GFP in exponentially growing cells, but at different levels depending on the IPTG concentration in the growth medium. Next, the standard deviation in cellular fluorescence in one time-lapse image was plotted as a function of the mean cellular fluorescence intensity in that particular time-lapse image (Figure 4A). Importantly, the standard deviation in the cellular fluorescence, which essentially represents the background noise
when GFP is homogeneously expressed, showed a linear correlation with the mean fluorescence intensity. Accordingly, the corresponding regression line equation can be used for background noise correction in other analyses. This is illustrated in Figure 4B, where the correction is applied to the Pspac-GFP strain grown in the presence of 0.05 mM IPTG.
[image:5.612.61.552.61.426.2]As exemplified in Figure 3D, large numbers of heterogeneous gene expression measurements at different time points and for different promoter-GFP fusions can be readily compared using bar charts generated in spread sheet editors, like LibreOffice Calc or Microsoft Excel [7]. In this case, averages and standard deviations are calculated from the combined fluorescence values. However, the bar charts do not discriminate between highly heterogeneous and bistable gene expression. Notably, Microsoft Excel is not ‘open source’, but since the vast majority of potential users of TLM-Quant have easy access to Excel, we should mention this option.
Figure 3. Heatmap plots created using the R script in Figure 2.(A)B. subtiliscells expressing a fusion of the IPTG-inducible Pspacpromoter with GFP [6,7] show homogeneous fluorescence. (B)B. subtiliscells expressing a fusion of the authentic promoter of thesunAgene to GFP show heterogeneous fluorescence when grown on a Luria Bertani agarose medium. (C)B. subtiliscells expressing the samesunApromoter GFP fusion as in B show bistable heterogeneous fluorescence when grown on an M9 agarose medium. Note that at early time points already two populations of cells with differing fluorescence intensities can be distinguished. AU, arbitrary units. (D) Bar diagrams for easy comparison of the outcomes of multiple heterogeneity measurements during growth on M9 medium as shown in panels A-C. At t = 2 h, cells are in the exponential growth phase (blue bars); at t = 5 h, the highest numbers of cells are observed (red bars); at t = 10 h, a minimum in the cell numbers has been reached due to cell death (green bars); and at t = 17 h, the surviving cells have resumed growth (purple bars). Heterogeneity is expressed in arbitrary units (AU).
doi:10.1371/journal.pone.0068696.g003
In conclusion, time-lapse microscopy is currently the only method that allows real-time measurements of promoter activity, reflected by GFP expression, at the single cell level. Here we document the TLM-Quant pipeline, which allows the user to readily visualise and quantify gene expression heterogeneity using freely available open-source tools. Importantly, this pipeline is simple and robust – there are almost no thresholds and parameters to fine-tune. Since TLM-Quant is based on free open-source tools that almost every one can master, it is easy to adapt to a wide range of different – and potentially new – types of images. Thus,
while we describe the use of TLM-Quant for the soil bacteriumB. subtilis168, the established scripts can be applied to studies on gene expression heterogeneity in all other microorganisms that can be grown in a time-lapse microscopy system.
Supporting Information
Tutorial S1 The Tutorial includes detailed instructions for the implementation of TLM-Quant.
[image:6.612.61.459.66.519.2](PDF)
Figure 4. Quantification of expression heterogeneity.To obtain baseline values for GFP expression heterogeneity, aB. subtilisPspac-GFP strain was used in which the fluorescence intensity of the cells can be varied by varying the amount of the inducer IPTG in the growth medium. Importantly, the variation in GFP fluorescence in this cell population is minimal compared to cells expressing GFP from non-engineered promoters. Therefore, the observed variation can be regarded as a baseline for GFP expression heterogeneity. (A) Standard deviation in the fluorescence intensity of individual cells ofB. subtilisPspac-GFP as a function of the mean fluorescence intensity of the cell population. The analysis included 535 measurements collected from four cultures supplemented with IPTG to 0.05 mM, 0.1 mM, 0.5 mM, or 1 mM. (B) Example to illustrate the effectiveness of the applied heterogeneity correction. When applied to a Pspac-GFP strain grown in the presence of 0.05 mM IPTG the correction shows close to zero levels of expression heterogeneity over a period of at least 12 h. At later time points cells started to lyse in this experiment resulting in a slightly increased GFP expression heterogeneity. Black line, raw fluorescence data; Grey line, Pspac-GFP subtracted data.
Acknowledgments
The authors thank Vincent Fromion and Geoff Doherty for helpful discussions.
Author Contributions
Conceived and designed the experiments: SP ELD SD BS JMD. Performed the experiments: SP RHT. Analyzed the data: SP SD. Contributed reagents/materials/analysis tools: ELD BS JMD. Wrote the paper: SP SD BS JMD.
References
1. Nicolas P, Ma¨der U, Dervyn E, Rochat T, Leduc A, et al. (2012) Condition-dependent transcriptome reveals high-level regulatory architecture inBacillus subtilis. Science 335: 1103–1106.
2. Kearns DB, Losick R (2005) Cell population heterogeneity during growth of
Bacillus subtilis. Genes Dev 19: 3083–3094.
3. Veening JW, Igoshin OA, Eijlander RT, Nijland R, Hamoen LW, et al. (2008) Transient heterogeneity in extracellular protease production byBacillus subtilis. Mol Syst Biol 4: 184.
4. Veening JW, Stewart EJ, Berngruber TW, Taddei F, Kuipers OP, et al. (2008) Bet-hedging and epigenetic inheritance in bacterial cell development. Proc Natl Acad Sci U S A 105: 4393–4398.
5. Aı¨chaoui L, Jules M, Le Chat L, Aymerich S, Fromion V, et al. (2012) BasyLiCA: a tool for automatic processing of a Bacterial Live Cell Array. Bioinformatics 28: 2705–2706.
6. Botella E, Fogg M, Jules M, Piersma S, Doherty G, et al. (2010) pBaSysBioII: an integrative plasmid generatinggfptranscriptional fusions for high-throughput analysis of gene expression inBacillus subtilis. Microbiology 156: 1600–1608. 7. Buescher JM, Liebermeister W, Jules M, Uhr M, Muntel J, et al. (2012) Global
network reorganization during dynamic adaptations ofBacillus subtilis metabo-lism. Science 335: 1099–1103.
8. de Jong IG, Beilharz K, Kuipers OP, Veening JW (2011) Live Cell Imaging of
Bacillus subtilis and Streptococcus pneumoniae using Automated Time-lapse Microscopy. J Vis Exp 53: 3145.
9. Klein J, Leupold S, Biegler I, Biedendieck R, Mu¨nch R, et al. (2012) TLM-Tracker: software for cell segmentation, tracking and lineage analysis in time-lapse microscopy movies. Bioinformatics 28: 2276–2277.
10. Young JW, Locke JC, Altinok A, Rosenfeld N, Bacarian T, et al. (2011) Measuring single-cell gene expression dynamics in bacteria using fluorescence time-lapse microscopy. Nat Protoc 7: 80–88.
11. Carpenter AE, Jones TR, Lamprecht MR, Clarke C, Kang IH, et al. (2006). CellProfiler: image analysis software for identifying and quantifying cell phenotypes. Genome Biol 7: R100.
12. Sto¨ter M, Niederlein A, Barsacchi R, Meyenhofer F, Brandl H, et al. (2013) CellProfiler and KNIME: open source tools for high content screening. Methods Mol Biol 986: 105–122.
13. Schneider CA, Rasband WS, Eliceiri KW (2012) NIH Image to ImageJ: 25 years of image analysis. Nat Methods 9: 671–675.
14. Furrer R, Nychka D, Sain S (2010) Fields: Tools for spatial data. R package version 6.3. Furrer R, Nychka D, et al (eds).
15. R Development Core Team (2011) R: A language and environment for statistical computing. R foundation for statistical computing. ISBN 3-900051-07-0. 2011.
![Figure 3. Heatmap plots created using the R script in Figure 2. (A) B. subtilis cells expressing a fusion of the IPTG-inducible Pspac promoterwith GFP [6,7] show homogeneous fluorescence](https://thumb-us.123doks.com/thumbv2/123dok_us/9587351.462421/5.612.61.552.61.426/figure-heatmap-subtilis-expressing-inducible-promoterwith-homogeneous-fluorescence.webp)