http://go.warwick.ac.uk/lib-publications
Original citation:
Becker, Sascha O. and Hvide, Hans K. (2013) Do entrepreneurs matter? Working Paper. Coventry: Economics Department, University of Warwick. (Warwick economics research paper series (TWERPS), Vol.2013, No.1002
Permanent WRAP url:
http://wrap.warwick.ac.uk/53085
Copyright and reuse:
The Warwick Research Archive Portal (WRAP) makes the work of researchers of the University of Warwick available open access under the following conditions. Copyright © and all moral rights to the version of the paper presented here belong to the individual author(s) and/or other copyright owners. To the extent reasonable and practicable the material made available in WRAP has been checked for eligibility before being made available.
Copies of full items can be used for personal research or study, educational, or not-for-profit purposes without prior permission or charge. Provided that the authors, title and full bibliographic details are credited, a hyperlink and/or URL is given for the original metadata page and the content is not changed in any way.
A note on versions:
The version presented here is a working paper or pre-print that may be later published elsewhere. If a published version is known of, the above WRAP url will contain details on finding it.
Do entrepreneurs matter?
Sascha O. Becker and Hans K.Hvide
No 1002
WARWICK ECONOMIC RESEARCH PAPERS
Do entrepreneurs matter?
Sascha O. Becker and Hans K. Hvide
yJanuary 11, 2013
Abstract
In the large literature on …rm performance, economists have given little
atten-tion to entrepreneurs. We use deaths of more than 500 entrepreneurs as a source
of exogenous variation, and ask whether this variation can explain shifts in …rm
performance. Using longitudinal data, we …nd large and sustained e¤ects of
en-trepreneurs at all levels of the performance distribution. Enen-trepreneurs strongly
a¤ect …rm growth patterns of both very young …rms and for …rms that have begun
to mature. We do not …nd signi…cant di¤erences between small and larger …rms,
family and non-family …rms, nor between …rms located in urban and rural areas,
but we do …nd stronger e¤ects for founders with high human capital. Overall, the
results suggest that an often overlooked factor –individual entrepreneurs –plays a
large role in a¤ecting …rm performance.
Keywords: entrepreneurship, …rm performance, human capital.
JEL Classi…cation: D21, D24, J23, L11, L25, G39.
For valuable input, thanks to many seminar audiences and to John Moore, Kasper Meisner Nielsen, and Steve Tadelis. The results of a pilot study were circulated under the title "Are founders non-substitutable? Evidence from start-ups where founders die".
yBecker: CAGE @ Warwick University, CEPR, CESifo, Ifo and IZA. Email: [email protected].
I.
Introduction
In the large literature on …rm performance, economists have paid little attention to
en-trepreneurs. The idea of entrepreneurs as movers and shakers is old (e.g., Schumpeter,
1934), but geographical, institutional, and industry characteristics have been the focus
of empirical work (see surveys by Bartelsman & Doms, 2000 and Syverson, 2011). One
objective of the paper is to ask how much individual entrepreneurs contribute to …rm
performance.
It is hard to imagine the success of Apple Computers without Steve Jobs, or of Ford
Motor Corporation without Henry Ford. Stories of smaller-scale entrepreneur successes
are heard about almost every day. Little is known, however, whether entrepreneurs more
generally have much of an e¤ect. In addition to informing our understanding of …rm
performance, this question relates to an old debate stemming from Coase (1937) over
what constitutes a …rm and keeps it together. We focus on the role of the entrepreneur,
and whether the entrepreneur provides the ‘glue’that keeps the …rm together.
To examine the in‡uence of entrepreneurs on …rm performance, we could investigate
whether the entrepreneur’s engagement (captured by, for example, whether he is employed
by the …rm or not) is associated with …rm performance. This strategy is problematic, of
course, as engagement is likely to be a¤ected by underlying economic conditions. To deal
with this problem, we examine …rms where the entrepreneur dies. In these …rms, the
entrepreneur’s engagement was random, determined by the timing of the entrepreneur’s
death rather than underlying economic conditions. These deaths therefore provide an
opportunity to quantify whether entrepreneurs have a causal e¤ect on …rm performance.1
We construct a large database that contains longitudinal accounting and employment
information on the universe of incorporated, limited liability …rms established in Norway
between 1999 and 2007. The data contain initial ownership shares, which allows us to
identify entrepreneurs; we de…ne an entrepreneur as an individual with a substantial
ownership share in the …rm when it is established. The database contains about 65,000
1Several recent papers use death as an exogenous event to study causal e¤ects, for example Azoulay
…rms where an individual owns at least 50 percent of the shares initially, and more than 500
…rms where one of these individuals die before the end of 2009. For most of the analysis we
focus on individuals with more than 50 percent ownership (341 death events). We track
…rm performance at a yearly level until the end of 2010, so that …rms in our database are
between zero and eleven years old. The data also include yearly panel information about
each owner back to 1993, including family relation to the entrepreneur.
We ask whether entrepreneurs have a causal e¤ect on …rm performance. For each of the
341 …rms where the entrepreneur dies (’treated’…rms) we use propensity score matching
to identify a similar …rm (’matched control’…rm), which we restrict to be started up in the
same calendar year. The matched controls have similar characteristics at startup date,
but do not experience subsequent entrepreneur death. We run di¤erence-in-di¤erences
regressions, comparing the performance of treated …rms and matched control …rms before
and after entrepreneur death. We …nd robust evidence that …rm performance drop after
the entrepreneur’s death. The magnitudes are large; for example, the mean e¤ect on sales
is about 60 percent, while the mean e¤ect on employment is about 17 percent. Thus we
…nd a large drop in …rm performance after entrepreneur death, pointing to a large role
played by entrepreneurs.
Firms experiencing entrepreneur death have about 20 percentage point lower survival
rates two years after the death event. They also have signi…cantly higher bankruptcy
rates.2 One could argue that entrepreneur death merely speeds up evolution by weeding
out …rms that likely would not ‡ourish even if the entrepreneur stayed alive. Using
quantile regressions, we …nd strong negative e¤ects of entrepreneur death on sales and
assets also among …rms in the upper deciles of the …rm performance distribution. We infer
that entrepreneurs also have an important causal e¤ect for the more productive …rms.
One explanation for our results is that entrepreneur death creates turbulence. If so, we
would expect a large immediate e¤ect on …rm performance, and a partial or full reversal
over time. The point estimates indicate that the immediate e¤ects of entrepreneur death
are quite modest relative to the sustained e¤ects that accumulate after some time. This
…nding suggests, again, that entrepreneurs have a causal e¤ect on the growth path of
2A …rm is not active if it (a) has gone bankrupt, (b) closed down for other reasons, (c) has less than
the …rm. Another explanation of our results is that they are somehow an artifact of our
matching procedure. We therefore also analyze the e¤ect of entrepreneur death using
ordinary least squares, using all the …rms in our database. The estimated coe¢ cients are
somewhat larger than in the analysis based on matching.
For how long in a …rm’s life does the entrepreneur matter? In order to examine this
question, we analyze whether the drop in …rm performance depends on …rm age when
the entrepreneur dies (recall that …rm age ranges between zero and eleven years in the
database). We …nd that the importance of the entrepreneur is largely independent of …rm
age; the entrepreneur e¤ects do not appear to vanish even when the …rm is close to ten
years old. We think this is an important result; the majority of surviving …rms reach a
more ‘mature’phase with moderate growth after about …ve or six years of existence. Thus
the entrepreneur also has a large e¤ect when the …rms have reached this more mature
phase.
Part of the explanation for the strong e¤ects of entrepreneur death could be that
post-death, the control of the …rm is transfered to less competent family members.
Perez-Gonzales (2006) and Bennedsen et al. (2007) document negative e¤ects on performance
from family CEO appointments inside mature …rms. We do not have access to dynamic
ownership data but attempt to address this question in an indirect way: we examine
whether entrepreneur death a¤ects family …rms (de…ned as a …rm where another family
member is a co-owner initially) di¤erently than non-family …rms, and whether …rms are
a¤ected di¤erently if the entrepreneur has adult children. We do not …nd that family
…rms, or …rms where the entrepreneur has adult children, are any more or less resilient
to the loss of the entrepreneur. Relatedly, we examine whether the death of a married
entrepreneur has a di¤erent impact than the death of a non-married entrepeneur. Neither
here do we …nd signi…cant di¤erences.3
Based on the endogenous growth literature (e.g., Glaeser et al., 1992), we ask whether
the causal e¤ect of individual entrepreneurs is smaller in urban areas, where the supply
of entrepreneurs is likely to be denser and the entrepreneur possibly more substitutable.
We …nd, however, no di¤erence in the causal e¤ect of entrepreneurs in rural versus urban
3In Section VI.A. we also discuss whether aspects of Norwegian inheritance law or capital gains tax
areas. We …nd some evidence suggesting that high human capital entrepreneurs are more
important, and that entrepreneurs are more important in …rms in high human capital
industries. We also apply other sector classi…cations (high/low growth sectors; high/low
volatility sectors etc.), but do not …nd signi…cant di¤erences, a sign of the universality of
the importance of entrepreneurs.
While the main analysis concentrates on individuals with more than 50 percent initial
ownership, we also analyze the role of individuals with a 50 percent initial ownership (204
death events). Using di¤erence-in-di¤erences estimation, we …nd negative e¤ects on …rm
performance that are about half the size of those in the main analysis. We also analyze
the impact of the death of minority owners, i.e., individuals with less than 50 percent
initial ownership share (495 death events). In unreported regressions, we …nd that the
point estimates are very close to half of those of the 50 percent founders, i.e., a quarter
of the e¤ect for the founders with more than 50 percent ownership share.
A concern is that many …rms in our sample are very small, and perhaps motivated by
tax-reduction or providing private bene…ts rather than the desire for pro…ts. To address
the possibility that the e¤ects di¤er for small and large …rms, we interact the treatment
e¤ect with a dummy for …rms below median size, in terms of initial equity. We …nd large
e¤ects for startups both below and above median size. We then interact the treatment
e¤ect with a dummy for …rms with less than two employees in the …rst year. We …nd only
minor di¤erences in the e¤ect of entrepreneur death for these types of …rms.
An even simpler explanation for our …ndings could be reverse causality: poor …rm
performance leads to entrepreneurs having a higher probability of dying. To deal with
this possibility, we look at whether there are pre-treatment di¤erences between treated
and matched controls. We do not …nd evidence of pre-treatment e¤ects, which suggests
that reverse causality is not a major concern.4
The remainder of this paper is organized as follows. Section II discusses why
en-trepreneurs should matter in light of existing theory and evidence. Section III presents
the data and descriptive statistics. Section IV discusses the empirical strategy. Section V
presents the main results and speci…cation checks, while Section VI explores heterogeneity
4We do not have access on data on health or on the cause of death. The absence of pre-treatment
by means of interaction e¤ects. Section VII interprets the results and concludes.
II.
Why should entrepreneurs matter?
Empirical studies of …rm performance tend to take a neoclassical view of the …rm in which
entrepreneurs are homogenous inputs in the production process, and substitutable once
a …rm has been founded. For example, in Kihlstrom & La¤ont (1979), the entrepreneur
bears residual risk but does not contribute to …rm performance. In sorting models (e.g.,
Lucas, 1978, Evans & Jovanovic, 1989, Lazear, 2005), individuals with high
entrepre-neurial ability become entrepreneurs, while individuals with low entrepreentrepre-neurial ability
become workers. Although this type of theory is consistent with individual entrepreneurs
being important to …rm performance, a degree of smoothness in the distribution of
en-trepreneurial ability will tend to rule out individuals playing a large role. Of course, the
neoclassical view does not exclude the possibility that there are transitional costs, such
as search costs or turbulence costs, from replacing the entrepreneur.5
A theoretical tradition that opens up a way for entrepreneurs to play a more important
role in the production process is critical resource theory (Wernerfelt, 1984, and Rajan
and Zingales, 1998, 2001), where a …rm is a set of speci…c investments built around a
critical resource or resources. In the current context, the entrepreneur’s human capital,
personality, or ideas can be seen as the critical resource which the …rm is initially organized
around; for example, the entrepreneur can de…ne a product line, hire people, or invest in
physical assets that are complementary to himself (this is a sense in which the entrepreneur
is an argument in the production function). Under this view, the entrepreneur can have
two e¤ects on …rm performance. The …rst is the direct e¤ect through providing the critical
resource, and the second is positive spillover e¤ects on the other assets of the …rm. We …nd
very large negative e¤ects on sales after entrepreneur death but smaller negative e¤ects
on …rm employment. These …ndings are consistent with spillovers from the entrepreneur
to the productivity of the …rm’s employees.
5Other theories of entrepreneurship such as Hellmann (2007) and Hvide (2009) emphasize contractual
Although critical resource theory opens up for entrepreneurs being important in new
…rms, it says less about for how long in the …rm’s life. Do entrepreneurs enter the
produc-tion funcproduc-tion for more mature …rms? This is a quesproduc-tion we try to address in the empirical
analysis. Critical resource theory also says less about which activities make entrepreneurs
important. Leadership in mature …rms is divided between managers and owners, where
managers take care of daily operations and owners oversee managers and provide
strate-gic direction. Entrepreneurs, in contrast, are both owners and managers, which makes it
di¢ cult to separately identify the e¤ects of losing the owner from the e¤ects of losing the
manager in the empirical analysis.6 We are not convinced this is a major shortcoming as
the distinction between operations and strategy is blurred in the context of very young
…rms.7 By focusing on entrepreneur death, we quantify the joint e¤ect of owners and
managers for these young …rms.
Johnson et al. (1985) examine the e¤ect on share price of senior management deaths
for a sample of 53 U.S. publicly traded …rms. The e¤ect of CEO death is negative for
the sample overall, but they …nd a positive e¤ect for CEOs that were also founders of
the company, a …nding veri…ed with more recent data by Pérez-González (2006). As
argued by Slovin and Sushka (1993), some of these results might be explained not by the
ability of the entrepreneur but by an increase in the probability of a corporate control
contest. Across the literature on productivity and …rm performance, not very much
is known about the importance of individuals.8 Bertrand & Schoar (2003) documents
di¤erences in management styles between individuals, and …nd evidence consistent with
6In about 80 percent of the …rms in our database that hire people, the entrepreneur is employed in
the …rm in the second year of operations. We cannot identify whether the entrepreneur is a manager, but …nd it very likely.
7For example, decisions that are relatively routine in mature …rms, such as the pricing of individual
products, can have major strategic importance when the …rm is young. For …rms where the owner is not an employee, we expect the owner to be involved also in decisions that are viewed as operational in more mature …rms.
8The following quote from Syverson (2011) illustrates the state of knowledge about the importance
CEOs of publicly listed companies a¤ecting …rm performance. Bloom & Van Reenen
(2007) document that higher-quality management practices are correlated with several
measures of productivity and …rm performance in a sample of non-listed …rms. Bloom &
Van Reenen (2007) do not focus on the role of individual managers, but their results are
consistent with individual managers playing a large role through a¤ecting management
practices.
An old tradition from Coase (1937) debates what constitutes a …rm and what keeps
a …rm together (physical or human assets). The property rights view of the …rm (e.g.,
Grossman & Hart, 1986, Hart, 1995) emphasizes non-human assets, while Hart & Moore
(1994) and Zingales (2000) emphasize human assets. Kaplan, Sensoy & Stromberg (2009)
study strategy and management changes in a sample of 156 fast-growing companies that
eventually go public. Between receiving venture funding and the initial public o¤ering,
almost none of these companies change their line of business, while the management team
changes quite frequently. Thus, for this sample of companies, the idea seemed more stable
than the management team. One takeaway from the present paper is that individuals are
more important for newly established …rms than the results from Kaplan, Sensoy, and
Stromberg would suggest.
III.
Data and descriptive statistics
III.A.
Norway
We start with a brief description of the Norwegian economy, the tax code, and the basis
for the data collection.9 Norway is an industrialized nation with a population of about 4.7
million. The GDP per capita in 2008 was about $58,717 when currencies are converted
at purchasing power parity; this is higher than the EU average of $30,651. Norway is
characterized by a large middle class, and a low inequality of disposable income. For
labor income, the maximum marginal tax rate (for incomes above $75,000) is about 50%,
which is fairly typical by European standards. The capital income tax is a ‡at 28% on
net capital gains.
9The material is taken from the OECD Statistical Pro…le for Norway: 2010, available at OECD.org,
In contrast to most OECD countries, Norwegian households are subject to a wealth
tax every year throughout their lives.10 The government’s statistical agency, Statistics
Norway (also known by its Norwegian acronym SSB) collects yearly data on wealth and
income at the individual level from the Norwegian Tax Agency. We obtain our data from
SSB. Earnings and wealth …gures for individuals are public information in Norway. This
transparency is generally believed to make tax evasion more di¢ cult and hence data more
reliable.
The tax value of a …rm, which is included in its owners’wealth statements, is calculated
as sixty percent of assets subtracted debt, where debt is evaluated at face value while assets
are at book value (typically lower than market value). Selling o¤ a non-listed company
therefore produces a tax liability if, which one can expect to commonly be the case, the
transaction price exceeds the tax value of the company. It is commonly known, however,
that this liability can be evaded by transferring the company to a holding company before
selling o¤. We therefore do not expect the capital gains tax to bias the individuals that
inherit a non-listed company towards keeping it or selling it o¤. In Norway there is also
tax on inheritance. The inheritance tax on a non-listed company is based on the tax value
of the …rm on January 1 in the year of death. This means that the inheritance tax is
e¤ectively sunk once inheritance has taken place. We have therefore no reason to believe
that the inheritance tax will bias our results in any particular direction.11
Similar to other industrialized countries, setting up an incorporated company in
Nor-way carries tax bene…ts relative to being self-employed (e.g., more bene…cial write-o¤s
for expenses such as home o¢ ce, company car, and computer equipment), and
incorpora-tion status will therefore be more tax-e¢ cient than self-employment status except for the
10In contrast, the U.S. tax system requires wealth reporting only in connection with estate tax, which
is imposed only on the very rich at the time of death (Campbell, 2006). The wealth tax in Norway is 0% up to about $120,000 in net wealth, and about 1% for net wealth above $120,000.
11If a spouse inherits, no inheritance tax will be paid until the spouse dies or remarries. If children of
smallest projects. The formal capital requirement for registering an incorporated limited
liability company was NOK 50,000 in equity until 1998 and NOK 100,000 thereafter (in
2008, $1 was equal to about 7 NOK).
III.B.
Data
We construct a database that consists of the universe of incorporated limited liability
…rms in Norway between 1999 and 2007, where one individual holds more than 50 percent
of the initial shares.12 The data include yearly accounting and employment measures for
each …rm until the end of 2010, so that the …rms in our database are between zero and
eleven years old. By comparison with recent work in the productivity literature, Foster et
al. (2008) analyze the universe of manufacturing plants in the U.S. over a 20-year period.
The …rms are split into four age categories [age bracket in parentheses]: entrants [0,5],
young [5,10], medium [10,15] and old [15 and older]. Thus our data cover slightly more
than two of the four …rm age brackets considered by Foster et al. (2008). Compared to
datasets of the productivity literature, a main novelty is that the data contain ownership
shares in the incorporation year, broken down by each owner with at least a ten percent
ownership share. We have a detailed panel on socio-demographic information on all
owners, including year of death if applicable, ranging from 1993 to 2009.
The data are compiled from three di¤erent registers:
1. Accounting information from Dun & Bradstreet’s database of accounting …gures
based on the annual …nancial statements submitted to the tax authorities. This
data include variables such as 5-digit industry code, sales, assets, number of
em-ployees, and pro…ts for the years 1999-2010. Note that the D&B data contain yearly
information on all Norwegian incorporated limited liability companies, and not a
sample as in the U.S. equivalent. Incorporated companies are required to have an
external auditor certifying the accounting statements in the annual reports.
12For 1999, the data contain only a sample of the …rms started. Diagnostic tests do not suggest
2. Data on individuals from 1993 to 2009 prepared by Statistics Norway. These records
are based on government register data and tax statements, and include the anonymized
personal identi…cation number and yearly socio-demographic variables such as
gen-der, age, education in years, taxable wealth, and income. The data identify the
year of death, if applicable, and also identi…es family relationships between
indi-viduals, which allows us to identify family …rms. The data contain all Norwegian
individuals, not a sample as in the Panel Study of Income Dynamics or the Survey
of Consumer Finance. As with the PSID and the SCF, the data are anonymized
(contains no names of individuals).
3. Founding documents submitted by new …rms to the government agency
’Brønnøysund-registeret’. This register data include the start-up year, total capitalization, and the
personal identi…cation number and ownership share of all initial owners with at least
10 percent ownership stake.
For each new …rm identi…ed in 1), we create a list of owners identi…ed through 3)
and compile their associated socio-demographic information from 2). We de…ne an
entre-preneur as a person with more than 50 percent ownership of the total shares in a newly
established limited liability …rm. We interchangeably refer to this person as ’the
entre-preneur’or ’the founder’. Restricting the sample to majority owners ensures that we are
likely to include ’real’ entrepreneurs in our sample. (In a separate analysis below, we
also look at owners with an exact 50 percent ownership share.) For a small fraction of
…rms, the …rst year of …nancial reporting, de…ned through 1), is di¤erent than the year of
incorporation de…ned by 3). For these …rms, we de…ne the …rst year as the …rst year of
reporting.13
III.C.
Descriptives of original sample
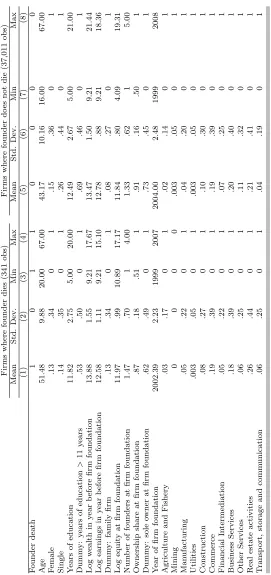
Table 1 presents descriptive statistics of the …rms and founders in the sample. Founder
characteristics generally refer to the …rst year of operations, with the exception of log
13In contrast to Hvide & Moen (2010), the current dataset contains the population of new …rms. A
wealth and log earnings which are taken as the log of …ve-year averages prior to …rm
foundation.Firm characteristics refer to time of incorporation.Table 1 contrasts
charac-teristics of ’treated’ …rms (i.e., where the founders die during our sample period) with
’control’ …rms (i.e., where the founders do not die during the sample period). In the
initial sample of 37,011 …rms, 341 experience founder death during our sampling period.14
Founders who die are older and (likely as a consequence) wealthier and less educated.
The sectoral composition is very similar. The only small di¤erences are that …rms where
the founder dies are more likely to be in real estate and transportation, and less likely to
be in business services and …nancial intermediation. This might re‡ect the fact that the
’treated’ founders are less educated and therefore more prone to be in more traditional
industries.
INSERT TABLE 1 HERE
Table 2 shows the timing of entry and the timing of death for the treated …rms. Firms
where the founder dies enter in all years between 1999 and 2007 inclusive. Founders
of these …rms die in all years between 2000 and 2009 inclusive.15 Another interesting
descriptive is …rm age at founder death. Founder death occurs at any …rm age, from year
1 through year 10 (the maximum …rm age possible given our sample). In our analysis,
amongst others, we will look into the question of whether founder death has di¤erent
implications for younger versus older …rms.
INSERT TABLE 2 HERE
14About one-half of the …rms in our database have an individual with at least 50% initial ownership.
The remaining …rms are either started up by a team of individuals or (more frequently) by a …rm. The latter category is likely to be spin-o¤s of divisions of established …rms, rather than start-ups proper. This is also re‡ected in the …rm size distribution at …rm foundation. On average, start-ups have 2 employees. The median number of employees is 1 and the 90th percentile is 5 and the 99th percentile is 19. As a rough estimate, we expect our analyses to cover a solid majority of the proper startups.
15Remember that we deliberately excluded observations where the founder dies in 2010 because we
IV.
Empirical strategy
IV.A.
Estimation sample
It is naturalnot to compare the 341 …rms with founder death to all 36,670 …rms without
founder death, but to limit the analysis to those …rms (and their founders) in the control
group who are most comparable in terms of their observable characteristics. We use
propensity score matching to select the …rms in the control group who are most similar to
the …rms in the treatment group. More speci…cally, we use nearest neighbor matching to
select those …rms in the control group whose ex ante probability of experiencing founder
death is closest to that of the 341 …rms where the founder dies.16 Our further analysis
then proceeds on this matched sample.17
The propensity score is the probability of treatment (i.e., founder death) conditional
on pre-treatment characteristics. The idea of propensity score matching is to match
treated and controls whose ex ante probability of receiving treatment (i.e., to experience
founder death) – as predicted by their pre-treatment characteristics – is ‘identical’ (see
Rosenbaum and Rubin, 1983). By ‘pre-treatment characteristics’we mean characteristics
at …rm foundation, i.e., the variables shown in Table 1. Characteristics measured at a
later point, e.g., in the year before founder death, might already be subject to endogeneity
bias because of the foreshadowing of (later) founder death.
To estimate the propensity score, we run a probit model of founder death on the
characteristics from Table 1. The results are reported in Table A.2. We obtain estimated
propensity scores for all 341 founders and for 36,567 controls.18 Ex ante, the treated
make up less than 1 percent of our sample. Based on the estimated propensity score,
we use nearest-neighbor matching (without replacement) to combine treated and control
observations.19 We impose a caliper (i.e., radius) of 0.05, i.e., treated …rms that have
16In unreported analysis, we use two-nearest neighbor matching and obtain very similar results. 17For comparison, we also perform the analysis using OLS on all 37,011 …rms in our database. Those
results are presented in Table A.1.
18Some control units are automatically dropped in the propensity score estimation because they have
predicted probabilities of zero, i.e. their characteristics perfectly predict non-treatment.
19We use a version of Edwin Leuven and Barbara Sianesi’s Stata modulepsmatch2(2010, version 4.0.4,
no comparison unit and whose estimated propensity score is within 0.05 of their own
estimated propensity score are discarded to avoid bad matches. Imposing this caliper, we
only lose 2 of the 341 treated founders.20 Importantly, we impose exact matching on the
year the …rm starts activities. This is to make sure that we are comparing pairs of treated
and control …rms that are of the same age in the same calendar year.
In line with the di¤erences detected in Table 1 between treatment and control group,
the pre-treatment characteristics have substantial explanatory power in predicting founder
death. Table A.2 shows that the pseudo-R2 is 0.11 and that the variables entering the
propensity score are jointly signi…cant at the 1%-level. Another indicator of di¤erences
between treatment and control group before matching is the so-called median absolute
standardized bias, de…ned by Rosenbaum and Rubin (1985) as the comparison between
(standardized) means of treated and control units, where the standardized di¤erences
(standardized biases) between the means for a covariatexi are de…ned as:
Bbef ore(xi) = 100
xi1 xi0
q
1
2(V1(xi) +V0(xi))
where xi1 denotes the treated unit mean and xi0 the control unit mean for covariate xi
and where V1(xi) and V0(xi) are the sample variances in the treated group and control
group, respectively. The median absolute standardized bias before matching is 18.04.
Rosenbaum and Rubin (1985) suggest that a value of 20 is ’large’, i.e., in line with the
other two indicators above, treated and control groups do di¤er considerablyex ante.
On the basis of the estimated propensity score, for each treated …rm we search for the
control whose propensity score is closest to that of the treated …rm (‘nearest neighbor
matching’). All control …rms that do not qualify as a nearest neighbor are discarded from
the further analysis.
Matching gives us a better control group and reduces the bias in comparing treated
and control groups to the extent that it manages to largely remove the pre-treatment
di¤erences between the treatment and control group. We can formally test this, using the
same three indicators of imbalance between the treatment and control group, but now
20We also looked at results without imposing a caliper and the results are very similar, so imposing
using the matched sample. To do so, we re-run the same propensity score speci…cation on
the matched sample, i.e., on the sample of treated andmatched controls. After matching,
the pseudo-R2 drops to .02. Similarly, the variables entering the propensity score are no
longer jointly signi…cant, with a p-value of .957. The median absolute standardized bias
drops from 18.04 before matching to 2.90 after matching.21 Matching thus appears to
be very successful at removing di¤erences in observable pre-treatment characteristics. In
other words, our matched sample consists of …rms where the founder dies and a set of
‘twin …rms’who areex ante observationally identical, but where the founder does not die.
We consider the matched control group as a useful comparison group that approximates
the counterfactual outcome of the treated …rms.
IV.B.
Di¤erence-in-di¤erences setup
We ask whether individual entrepreneurs have a causal e¤ect on …rm performance. To
answer this question, we want to understand whether …rms where the founder dies
per-form di¤erently from …rms where the founder does not die. We are mainly interested in
di¤erences after founder death. However, we also look into performance di¤erences before
founder death. Di¤erences in performance before founder death would indicate a
deteri-oration in the condition of the founder and his …rm before his death. As we will show,
there are no di¤erences between treated and control …rms before founder death, which is
consistent with two possible explanations. Either founder death comes as a surprise, in
which case it is natural not to detect any pre-death di¤erences in performance;
alterna-tively, even if the founder already has health issues before his year of death, they do not
seem to a¤ect …rm performance. In fact, when comparing …rm performance measures in
the year before founder death, we can again use the median absolute standardized bias
and the pseudo-R2 of a regression of the treatment dummy on …rm performance
mea-21The median absolute standardized bias after matching is de…ned as
Baf ter(xi) = 100
xi1M xi0M
q
1
2(V1(xi) +V0(xi))
;
sures as indicators of di¤erences between treated and control …rms.22 We …nd the median
absolute standardized bias to be 2.06, so very small. Similarly, the pseudo-R2 from a
regression of the treatment dummy on these performance measures is 0.005, an indication
that treated …rms and controls do not di¤er at all in their performance in the year before
founder death. In fact, when looking at t-tests for di¤erences in means between treated
…rms and matched controls for each and every performance variable, we …nd no
signi…-cant di¤erences in the year before founder death. All t-statistics are below 1. We take
this as clear evidence that treated and control founders/…rms are not only comparable at
…rm foundation (see the results from propensity score estimation discussed above), but
that matched pairs of treated …rms and controls founded in the same year also develop
similarly until the year right before founder death.
Our main focus from now on is on understanding whether founder death a¤ects …rm
performance after founder death. Why do we not perform a standard regression analysis
using the whole sample? There are two reasons. First, as shown above, treated …rms
and controls are not necessarily comparableex ante, and matching allows us select those
controls that are best matches. Yet, Angrist (1998) shows that matching and regression
analysis using a fully saturated (=interacted) model di¤er only in the (implicit) weighting
attached to treatment e¤ects within cells de…ned by combinations of X characteristics.
So, matching is not fundamentally di¤erent from a fully saturated OLS model and this
is not the main reason for using matching. In fact, in Table A.1, we also present OLS
results, for comparison. Second, and most importantly, for control observations, the year
of founder death is not de…ned. Matching is key to …nding comparable controls who
started business in the same year as individual observations of treated …rms. We then use
year of founder death at treated …rms to impute the counterfactual year of founder death
of the matched control.23 Based on this, we can de…ne ’before’and ’after’founder death
for both treated …rms and matched controls. Our estimation sample consists of the 339
treated …rms and 339 matched controls.
22We use the same …rm performance measures that we use later on in our main analysis: (log) assets,
(log) number of employees, pro…ts, return on assets and (log) sales.
23The analysis described above, where we looked into the comparison of treated …rms and controls
We start by looking at very basic di¤erences-in-di¤erences panel regressions, where
we compare treated and matched controls to assess how …rm performance is a¤ected by
founder death:
P erf ormanceit = + 1 treatedi+ 2 af terit treatedi+ 3 af terit+ Xit+ t+ (1)
2 is our main coe¢ cient of interest, measuring the di¤erence between treated …rms and
control …rms after founder death.24 However,
1 is also of interest because it provides
for a test of (a lack of) pre-treatment e¤ects. We routinely control for all variables that
entered the original matching procedure, i.e., founder and …rm characteristics pertaining
to the year in which the …rm started operations, as well as year dummies. Adding control
variables adjusts for any small residual bias and increases e¢ ciency. This ‘bias-corrected’
matching has been found in Abadie and Imbens (2006) to work well in practice.
Later, we extend this analysis in various ways. First, we look in more detail at how
performance varies year by year after founder death, i.e., we replace the simple ’after’
dummies by indicators for ’one year after founder death’, ’two years after founder death’
etc. Second, we look into heterogeneity of the treatment e¤ect by founder and …rm
characteristics. The idea is that, for instance, the death of a highly educated founder
might be a bigger loss to the …rm than the death of a less educated founder. Similarly,
founder death may be more detrimental for young …rms than for mature …rms. Third, we
look into quantile regressions to see whether the results are driven by things that happen
at the lower, middle or upper end of the performance distribution. We turn to these issues
below.
Startup performance can be measured by growth, survival, and pro…tability. We
analyze how entrepreneur death a¤ects all these aspects of …rm performance. To assess
growth, we examine the e¤ect of entrepreneur death on sales, on human assets as measured
by employment, and on the (book) value of physical assets. For …rms that close down,
we set the relevant variables equal to zero to measure the e¤ect on sales, employment
24Note that, in the basic di¤erences-in-di¤erences regressions, we exclude the year of founder death
and assets.25 To assess pro…tability, we use two measures. The …rst is net pro…ts. The
second is operating return on assets (OROA). OROA is de…ned as the ratio of earnings
before interest and taxes (EBIT) to the total asset base used to generate them, and is the
standard performance measure in a large accounting and …nancial economics literature
(see Bennedsen et al. 2007 and references therein).26 Firms that cease to exist have zero
earnings and zero assets, and OROA is unde…ned. We impute OROA equal to zero for
these observations.27 Survival is assessed by whether a …rm is active in given year or
not.28
V.
Do entrepreneurs matter?
V.A.
Main results
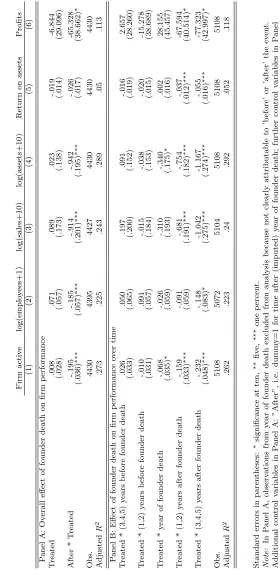
Table 3, Panel A, presents the results from the di¤erence-in-di¤erence estimation described
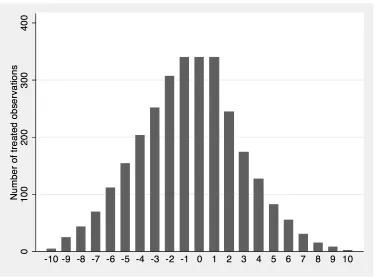
in Section IV. We consider a window from …ve years before to …ve years after founder
death (including all years slightly strengthens the results).29 The second row reports the
estimated 2 coe¢ cient for the outcome variables.
INSERT TABLE 3 HERE
The results presented in Panel A of Table 3 show that entrepreneurs have signi…cant
e¤ects on …rm growth and survival. The e¤ects, especially for …rm growth, are large;
for example, the mean e¤ects on sales are about 60 percent, while the mean employment
25One might be tempted to exclude …rm-year observations after …rm closure, but that would introduce
a bias.
26Unlike returns to equity or returns to capital employed, OROA compares …rm pro…tability relative
to total assets. In contrast to net income-based measures such as return on assets, OROA is not a¤ected by capital structure or dividend policy di¤erences across …rms. The asset base we use to compute yearly OROA is the average of assets at the beginning and the end of the calendar year. To prevent outliers from driving our results, we winsorize the yearly pro…ts and OROA values at the 5% level.
27We impute pro…ts to zero. In an alternative speci…cation, we impute OROA equal to the average
OROA in our data (about 6.1 percent). Under this alternative imputation, we obtain no e¤ects on OROA at the mean but obtain very similar results in quantile regressions at the third quantile.
28A …rm is not active if it (a) has gone bankrupt, (b) closed down for other reasons, (c) has less than
NOK 50,000 in sales.
29Appendix Figure A.1 shows that the number of observations outside this time window rapidly
e¤ects are about 17 percent.30 The large e¤ect on sales but lesser e¤ect on employees
suggest that entrepreneurs contribute to the productivity of the …rm’s employees through
spillover e¤ects.31 The estimated e¤ects on pro…tability are quite modest compared to
growth, which is likely due to asset sales after founder death. The data do not allow us
to determine whether the reduction in assets are ’forced’, i.e., due to …nancial distress, or
whether it is due to ’voluntary’reallocation of resources to more productive usage outside
the …rm. That …nancial distress plays some role is suggested by the bankruptcy rates:
in unreported regressions we …nd that 20 percent of the treated …rms and 10 percent of
the matched control …rms go bankrupt before 2010 (the di¤erence is signi…cant at the 1
percent level).
For comparison, we also perform the analysis using OLS on all 37,011 …rms in our
database.32 The estimated coe¢ cients, reported in Table A.1, are somewhat larger than
in the main matching analysis.33 For reasons explained earlier we tend to put more weight
on the matching results of Panel A than those OLS results.
It is possible that the main reason for the negative e¤ects on …rm performance
doc-umented in Panel A could be turbulence created by entrepreneur death. If turbulence
drives the results, we would expect entrepreneur death to have a large short-run e¤ect on
…rm performance, and a partial or full reversal over time (for example, …nding a
substi-tute for the entrepreneur could be easier in the longer than in the shorter run). On the
other hand, if the entrepreneur is a critical resource for the …rm, as outlined in Section
II, we would expect the negative performance e¤ects to be long-lasting. To examine this
question, in Panel B of Table 3 we estimate separately the e¤ect 1-2 years after founder
death, and 3-5 years after founder death. The sample size is larger than in Panel A
be-cause we also include the year of founder death. The fourth and …fth rows of Panel B
30Remember that with log dependent variables, coe¢ cients on dummy variables need to be transformed
asexp(coe¢ cient) 1to yield percentage e¤ects.
31The evidence is merely suggestive on this account: The drop in labor productivity may be partly
accounted for by the large negative e¤ect on …rm assets after founder death.
32OLS estimates are based on the following regression: P erf ormance
it = + 1 treatedi+ 2
af terit treatedi+ Xit+ t+ , whereaf teritis equal to 1 in the years after founder death in …rms
where the founder dies. Note thataf terit is set equal to zero in all periods for …rms where the founder
does not die.
33The likely reason for the larger OLS estimates is that they are not based on a fully saturated model,
show that compared to the control group, the performance for the treatment group of
…rms deteriorates over time; our point estimates suggest that the immediate e¤ects of
entrepreneur death are quite modest relative to the e¤ects that accumulate over time.
For example, the e¤ect on survival is about 16 percentage points 1-2 years after founder
death, and 23 percentage points 3-5 years after founder death. Thus entrepreneur death
leads to large and sustained negative e¤ects on …rm performance.
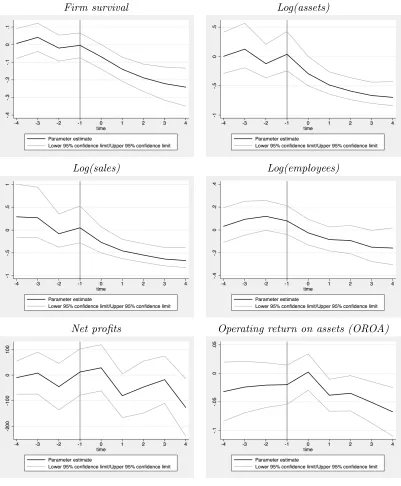
The following …gure plots the estimated di¤erence between treated …rms and control
…rms across all years of event time, summarizing the regression results.
INSERT FIGURE 1 HERE
The graphs illustrate that over time, the di¤erence between the control and treated
group is accentuated.
V.B.
Are there pre-treatment di¤erences?
We showed in Section IV that there are no di¤erences between control and treated …rms
in the year of incorporation. We want to highlight that the results reported in Table 3
also address the important issue whether indeed the post-treatment e¤ect is causal in the
sense that they are the result of an exogenously timed death. Similar to Jones and Olken
(2005), we look at whether there are pre-treatment di¤erences between treated and control
…rms. We have done so in the context of the regression estimates presented in Table 3 and
in the context of the graphs presented in Figure 1. In all cases, there is no evidence of any
pre-treatment di¤erences between treated and control …rms. The timing of founder death
therefore seems to come as a surprise and we interpret di¤erences after founder death as
the result of (largely unexpected) founder death. We discussed above that the …nding of
no pre-treatment e¤ects is consistent with the alternative interpretation that even if the
founder was ill before his death, on average that illness does not seem to have a¤ected
…rm performance.34
It is possible that unobserved factors in the years leading up to founder death a¤ect
both the founder’s death probability and …rm performance after founder death (for
exam-34Under the second interpretation, one can speculate that it is not essential that the founders spend a
ple, an ailing marriage). We should emphasize, therefore, that the performance regressions
include only pre-determined controls, i.e., …rm characteristics from the year of foundation.
Our results should therefore be interpreted as the e¤ects of founder death conditional on
initial …rm characteristics, not on any intermediate characteristics that might have been
a¤ected by illness. Our results below show that actual …rm performance is not a¤ected
by such potential unobserved di¤erences prior to death, because treated and control …rms
do not di¤er in their performance in any of the years before founder death.
The coe¢ cient 1 estimated in the …rst row of Table 3, Panel A, shows that there
are no overall pre-treatment e¤ects. The interaction terms with pre-treatment dummies
{-5,-4,-3} and {-2,-1}, reported in Panel B of Table 3, give further evidence that there are
no pre-treatment e¤ects, i.e., that founder death has no e¤ect on …rm performance in the
years preceding death. This is an important ’placebo’test supporting our identi…cation
strategy.
V.C.
Distributional e¤ects
The above results indicate that, on average, entrepreneurs have a large and sustained
causal e¤ect on …rm performance. One possibility, consistent with the strong negative
e¤ect on …rm survival, is that entrepreneur death ’merely’speeds up evolution by weeding
out weak …rms. We are therefore interested in whether entrepreneur death has an e¤ect
across the …rm performance distribution, not only for weak …rms.
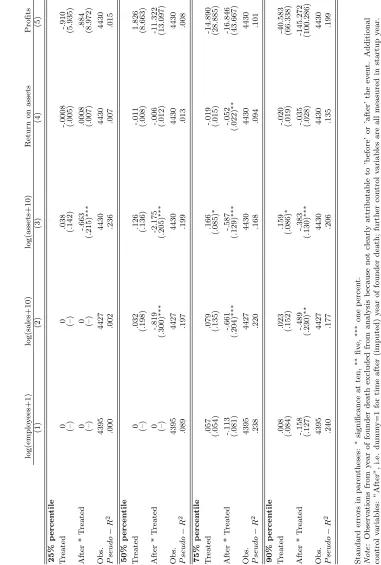
To address this issue, we look at quantile regressions for the same type of speci…cation
as in Table 3, but where we compare the performance of treated and control …rms at
various quantiles of the performance distribution. Our evidence in Table 4 suggests that,
at the lower quartile, there are no di¤erences between treated and control …rms, except
for negative treatment e¤ect on assets. The results at the lower end of the distribution
are largely explained by the fact that both treated and control …rms at the lower quantiles
of the distribution are going out of business.
INSERT TABLE 4 HERE
There are, however, e¤ects at the 50th, 75th and at the 90th percentiles. There are
– on return on assets. At both quantiles, the e¤ects are stronger 3, 4 and 5 years after
founder death (not reported). At the 95th percentile (not reported), di¤erences between
treated and control …rms seem to disappear. This result has to be taken with caution
because Chernozhukov and Fernandez-Val (2011) suggest that, for data sets of a sample
size like ours, a normal distribution approximation at the 95th percentile might not be
appropriate. We conclude that entrepreneur death appears to have a negative e¤ect across
the …rm performance distribution. In fact, one way to view our results is that founder
death shifts the distribution of …rm outcomes to the left (towards weaker outcomes).
For …rms around median quality the consequence will be a much higher probability of
closing down, while for …rms higher up in the performance distribution, the e¤ect will be
a signi…cant reduction in …rm growth.
VI.
Interaction e¤ects
So far, we have for the most part concentrated on homogeneous treatment e¤ects. One
exception were the quantile regressions where we looked at di¤erences in the e¤ect of
founder death over di¤erent parts of the outcome distribution. Now, we want to focus on
whether certain types of entrepreneurs matter more or less, and in what type of …rms.
We approach these questions by introducing interaction terms between the treatment
dummies and certain binary characteristics, like whether the founder is highly educated
or not. Likewise, we interact the before/after dummies and the di¤erence-in-di¤erences
parameter 2 with binary indicators of founder or …rm characteristics. This informs us
whether treatment a¤ects some …rms more than others, i.e., whether there is heterogeneity
in treatment e¤ects.
As discussed previously, it is possible that unobserved factors in the years leading
up to founder death could a¤ect founder or …rm characteristics. We should emphasize,
therefore, that we interact treatment only with pre-determined controls, i.e., founder and
…rm characteristics from the year of foundation. Our results in the following section
should therefore be interpreted as the e¤ects of founder death broken down on di¤erent
initial founder and …rm characteristics, not on any intermediate characteristics that might
VI.A.
Individual and …rm characteristics
Part of the explanation for the strong e¤ects of founder death could be that post-death,
the control of the …rm is transfered to less competent family members.35 Perez-Gonzales
(2006) and Bennedsen et al. (2007) document negative e¤ects on performance from family
CEO appointments inside mature …rms. To examine this question, we examine whether
entrepreneur death a¤ects family and non-family …rms di¤erently. We de…ne a family …rm
as a …rm where at least one of the founding minority owners is a child, parent, sibling or
spouse of the entrepreneur.
INSERT TABLE 5 HERE
In Table 5, we …nd no di¤erence in results for family and non-family …rms. Although
the estimated coe¢ cients are negative, they are quite far from being signi…cant. Both
family …rms and non-family …rms seem to be equally a¤ected by death of a majority
owner.
As an alternative way to test whether the strong e¤ects of founder death could be due
to transfer of control to less competent family members, we split …rms into two groups,
those where the founder has children aged 16 or older when the …rm is founded and those
where not. In unreported regressions, we do not …nd any di¤erence in treatment e¤ects
for founders with and without children.36
Based on the endogenous growth literature (e.g., Glaeser et al., 1992), we ask whether
the causal e¤ect of individual entrepreneurs is lesser in urban areas, where the supply of
entrepreneurs is denser. We …nd however, no di¤erence in causal e¤ect of entrepreneurs
in rural and urban areas.37 This might indicate that, even if there is a larger supply of
(potential) entrepreneurs in a city, there could be mitigating demand-side e¤ects, such
35Alternatively, family members might be subject to inheritance tax, which in turn might force them
to sell o¤ (parts of) the …rm. As we discussed in section III.A., inheritance tax issues only play a minor role.
36To examine this question in more detail, we modi…ed the matching function to match exactly on
the number of children of the founder. Neither this approach gave di¤erences in treatment e¤ect. An alternative way to analyze the role played by within-family transitions is to link post-death performance to whether children of the founder are employed by the …rm. This empirical strategy is problematic because the employment decision is endogenous to the performance of the …rm.
37An interesting question is whether the causal e¤ect of entrepreneurs is smaller in urban areas with
as the alternative entrepreneurs’opportunity cost of time being higher. Another
dimen-sion of interest is education of the founder. Ideally we would like to have a measure of
entrepreneurial ability. Some measure of IQ, although not necessarily capturing
entrepre-neurial ability, might be of interest, but is only available for a very small subsample. But
education as measured by schooling attainment is of interest in itself. We de…ne highly
educated as having completed at least upper-secondary education, i.e., having at least 12
years of education. While we …nd additional negative e¤ects of founder death for highly
educated founders for …rm survival, employment, sales and assets, they are statistically
signi…cant only in the case of assets. In unreported regressions, we …nd similar results for
average education level in the sector the …rm is active in. The coe¢ cients on individual
human capital and on sector human capital change only marginally if we include both as
explanatory variables.
We also looked at whether founder death matters less for old founders (60 years or
more in the startup year) because they might be less dynamic than younger founders
and therefore potentially more easily replaceable. However, we …nd no di¤erences in
treatment e¤ects by age (not reported). We also looked at the gender dimension, but …nd
no heterogeneity of the treatment e¤ect by gender (not reported). One concern is that
many …rms in our sample could be vehicles for cutting the tax bill for essentially
self-employed individuals, or …rms started up as a ’consumption good’for the entrepreneur.
In both these cases, it would be no surprise to see the …rm to vanish with the founder.
We therefore investigated whether the e¤ect of entrepreneur death depends on startup
size, the idea being that small startups are more likely to have founders with these types
of motivations. We …nd only minor di¤erences in results for startups below and above
median size in terms of initial equity.38 We then split …rms up depending on whether they
had two or more employees at the end of the …rst year or not, or whether the entrepreneur
was the sole owner at the incorporation date or not. Again the di¤erences are minor.
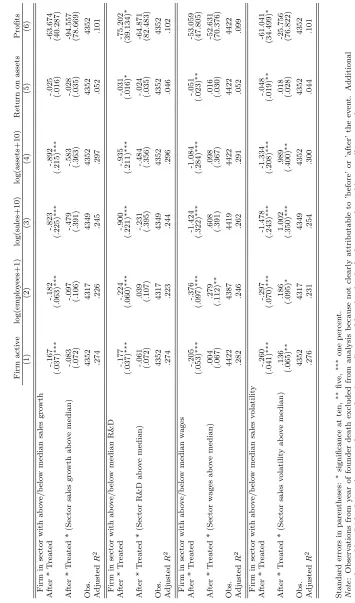
To investigate industry e¤ects further, we classi…ed industries according to growth,
R&D and volatility, in a manner similar to Bennedsen et al. (2007); the results did not
reveal a clear pattern, a sign of the universality of the importance of founders across
38The estimated results are weak for the largest 10-15 percent of the …rms in our sample, but this
di¤erent types of …rms.
VI.B.
Firm age
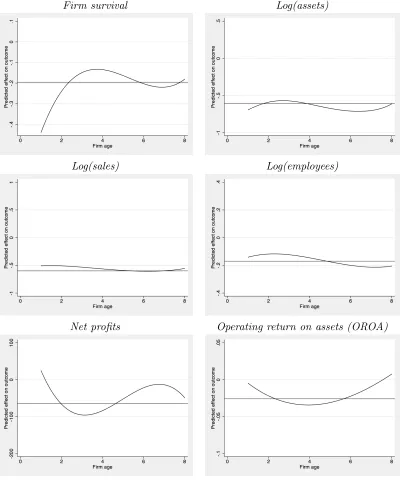
Does the importance of the entrepreneur diminish as the …rm matures? We analyze
whether the drop in …rm performance depends on …rm age when the entrepreneur dies.
We depict these results graphically by showing the treatment e¤ects as a function of …rm
age in the year when the founder dies. The plots are based on a third-order polynomial in
…rm age, interacted with the treatment e¤ect. We depict the predicted e¤ects up to …rm
age 8 years (recall that there are few …rms at …rm age larger than 8 years in our sample).
INSERT FIGURE 2 HERE
Figure 2 shows a very strong negative e¤ect of founder death on the survival of very
young …rms, and a smaller but still signi…cant negative e¤ect on survival for more mature
…rms. For …rm growth, the time pattern is less clear –…rm age at founder death seems to
play less of a role. These results are particularly interesting against the background that
the majority of …rms reach a more ’mature’phase with moderate growth after about …ve
or six years of existence. Thus the founder also has a large e¤ect when the …rms have
reached this more mature stage and beyond.39
VI.C.
50-percent owners
We have con…ned the sample to owners that have a majority share in the company. We
now consider how the treatment e¤ects vary with the entrepreneur being a majority owner
or not. We would expect owners that have a substantial ownership fraction in the …rm,
but less than a majority, to have a smaller impact on the …rm. To test this hypothesis, we
performed a separate analysis of the importance of founders that have 50 percent share
in the …rm.
We have 204 …rms where a 50 percent owner dies. Of those, 150 are …rms with two
equal partners, i.e., both holding 50 percent; 54 are …rms where the 50 percent owner
39Foster et al. (2008) analyze the universe of manufacturing plants in the U.S. over a 20-year period.
has more than one co-owner holding less than 50 percent each. We adopt the same
methodology as in the majority-owner sample, but we add the number of 50-percent
owners (i.e., one or two) as a matching variable in the propensity score matching and as a
control variable in the regressions. The results, reported in Table A.3, suggest that these
founders are important but not as important as the majority owners; the coe¢ cients on
the causal e¤ect of the founder are about half the estimated e¤ect of majority owners.
We can take this one step further and look at minority owners (495 death events).
In unreported regressions, we …nd that the point estimates are very close to half of the
e¤ect that we get from the 50% founders, i.e., 1/4 of the e¤ect for the founders with more
than 50% ownership share; taking into account standard errors, a zero e¤ect of death of
minority owners cannot be rejected for the majority of outcome variables. This …nding
shows that death of those with a more limited role in the …rm has a substantially smaller
e¤ect on …rm performance than death of majority owners.
VII.
Conclusion
In the large literature on …rm performance, economists have given little attention to
the founders of …rms. While the idea of entrepreneurs being important is old, other
factors have been the focus of most empirical work. This paper uses exogenously timed
entrepreneur deaths as a natural experiment to identify the causal e¤ect of entrepreneurs
on …rm performance.
We …nd large and sustained e¤ects of entrepreneurs. Entrepreneurs strongly a¤ect …rm
survival and growth patterns, and matter even for …rms that have passed their infancy and
begun to mature. One way to view our results is that founder death shifts …rm quality to
the left. For …rms in the lower part of the quality distribution the consequence is a higher
probability of closing down, while for …rms higher up in the quality distribution, the
e¤ect will be a signi…cant reduction in …rm growth. We do not …nd signi…cant di¤erences
between small and larger …rms, family and non-family …rms, nor between …rms located in
urban and rural areas, but do …nd stronger e¤ects for founders with high human capital,
and weaker e¤ects for individuals that are part of an entrepreneurial team. Overall, the
role in a¤ecting …rm performance.
Surprisingly little is know about the importance of individuals for …rm performance.
One takeaway from the present paper is to provide causal evidence that individual
entre-preneurs have a large quantitative impact on …rm performance. Why do entreentre-preneurs
matter so much? Although our …ndings are consistent with large direct e¤ects, they are
also suggestive of spillover e¤ects; we …nd very large negative e¤ects on sales after founder
death but smaller negative e¤ects on …rm employment. Thus, reminiscent of the Azoulay
et al. (2010) study on the death of research superstars, entrepreneurs could contribute
to the productivity of the …rm’s employees. We also inform a separate and old literature
on the nature of the …rm, stemming from Coase (1937). Some theoretical views suggest
that human factors are more important than physical assets. Using exogenously timed
entrepreneur deaths, we …nd that one human factor - the entrepreneur - plays a large and
persistent role.
VIII.
References
Abadie, A. & G. W. Imbens (2006). Large Sample Properties of Matching Estimators for
Average Treatment E¤ects. Econometrica, 74, 235–267.
Andersen, S. & K. M. Nielsen (2012). Ability or Finances as Constraints to
Entrepre-neurship? Evidence from Survival Rates in a Natural Experiment. Review of Financial
Studies, forthcoming.
Angrist, Joshua D. (1998). Estimating the Labor Market Impact of Voluntary Military
Service Using Social Security Data on Military Applicants. Econometrica, 66, 249–288.
Azoulay, P., J. S. G. Zivin, & J. Wang (2010). Superstar Extinction. Quarterly
Journal of Economics, 125, 549–589.
Bartelsman, E. J., & M. Doms (2000). Understanding Productivity: Lessons from
Longitudinal Microdata. Journal of Economic Literature, 38, 569–94.
Bennedsen, M., K. M. Nielsen, F. Pérez-Gonzáles & D. Wolfenzon (2007). Inside the
Family Firm. the Role of Families in Succession Decisions and Performance. Quarterly
Journal of Economics, 122, 647-691.
Firm Policies. Quarterly Journal of Economics, 118, 1169–1208.
Bertrand, M., S. Johnson, K. Samphantharak & A. Schoar (2008). Mixing Family
with Business: A Study of Thai Business Groups and the Families behind Them. Journal
of Financial Economics, 88, 466–498.
Bloom, N. & J. Van Reenen (2007). Measuring and Explaining Management Practices
across Firms and Countries. Quarterly Journal of Economics, 122, 1351-1408.
Campbell, J. Y. (2006). Household Finance. Journal of Finance, 61, 1553–1604.
Chernozhukov, V. & I. Vernandez-Val (2011). Inference for Extremal Conditional
Quantile Models, with an Application to Market and Birthweight Risks. Review of
Eco-nomic Studies, 78, 559–589
Coase, R. H. (1937). The Nature of the Firm. Economica, 4, 386–405.
Evans, D. S. & B. Jovanovic (1989). An Estimated Model of Entrepreneurial Choice
under Liquidity Constraints. Journal of Political Economy, 97, 808–827.
Foster, L., J. Haltiwanger & C. Syverson (2008). Reallocation, Firm Turnover, and
E¢ ciency: Selection on Productivity or Pro…tability? American Economic Review, 98,
394–425.
Glaeser, E. L., H. D. Kallal, J. A. Scheinkman and A. Shleifer (1992). Growth in
Cities. Journal of Political Economy, 100, 1126–1152.
Glaeser, E. L., S. S. Rosenthal, and W. C. Strange (2010). Urban Economics and
Entrepreneurship. Journal of Urban Economics, 67, 1-14.
Grossman, S., and O. Hart (1986). The Costs and Bene…ts of Ownership: A Theory
of Vertical and Lateral Integration. Journal of Political Economy, 94, 691–719.
Hamilton, B. (2000). Does Entrepreneurship Pay? An Empirical Analysis of the
Returns to Self-Employment. Journal of Political Economy, 108, 604–631.
Hart, O. & J. Moore (1994). A Theory of Debt Based on the Inalienability of Human
Capital. Quarterly Journal of Economics, 109, 841–879.
Hart, O. (1995). Corporate Governance: Some Theory and Implications. Economic
Journal, 105, 678–689.
Hellmann, T. (2007). When do Employees Become Entrepreneurs? Management
Science, 53 , 919–933.
Liquidity Constraints. Rand Journal of Economics, 25, 334–347.
Hvide, H. K. (2009). The Quality of Entrepreneurs. Economic Journal, 119, 1010–
1035.
Hvide, H. K. & J. Møen (2010). Lean and Hungry or Fat and Content? Entrepreneur
Wealth and Start-up Performance. Management Science, 56, 1242–1258.
Hurst, E. & A. Lusardi (2004) Liquidity Constraints, Household Wealth, and
Entre-preneurship. Journal of Political Economy, 112, 319–347.
Johnson, B. W., R. Magee, N. Nagarajan & H. Newman (1985). An Analysis of the
Stock Price Reaction to Sudden Executive Death: Implications for the Management Labor
Market. Journal of Accounting and Economics, 7, 151–174.
Jones, B. F. & B. A. Olken (2005). Do Leaders Matter? National Leadership and
Growth Since World War II.Quarterly Journal of Economics, 120, 835–864.
Kaplan, S., B. A. Sensoy & P. Stromberg (2009). Should Investors Bet on the Jockey
or the Horse? Evidence from the Evolution of Firms from Early Business Plans to Public
Companies,Journal of Finance, 64, 75–115.
Kihlstrom, R. E. & J.-J. La¤ont (1979). A General Equilibrium Entrepreneurial
The-ory of Firm Formation Based on Risk Aversion. Journal of Political Economy, 87, 719–
748.
Lazear, E. P. (2005). Entrepreneurship. Journal of Labor Economics, 23, 649–680.
Lerner, J. & U. Malmendier (2011). With a Little Help from My (Random) Friends:
Success and Failure in Post-Business School Entrepreneurship. NBER Working Paper
16918. Forthcoming, Review of Financial Studies.
Lucas, R. E. (1978). On the Size Distribution of Business Firms. The Bell Journal of
Economics, 9, 508–523.
Moskowitz, T. & A. Vissing-Jorgensen (2002). The Returns to Entrepreneurial
Invest-ment: A Private Equity Premium Puzzle? American Economic Review, 92, 745–778.
Nguyen, B. D. & K. M. Nielsen (2010). The Value of Independent Directors: Evidence
from Sudden Deaths. Journal of Financial Economics, 89, 550–567.
Pérez-González, F. (2006). Inherited Control and Firm Performance. American
Eco-nomic Review, 96, 1559–1588.
of Economics, 113, 387–432.
Rajan, R. G. & L. Zingales (2001). The Firm as a Dedicated Hierarchy: A Theory of
the Origins and Growth of Firms. Quarterly Journal of Economics, 116, 805–851.
Rosenbaum, P. R. & D. B. Rubin (1983). The Central Role of the Propensity Score
in Observational Studies for Causal E¤ects. Biometrika, 70, 41–55.
Rosenbaum, P. R. & D. B. Rubin (1985). Constructing a Control Group Using
Multi-variate Matched Sampling Methods That Incorporate the Propensity Score. The
Ameri-can Statistician, 39, 33–38.
Schumpeter, J. A. (1934). The Theory of Economic Development, Harvard University
Press, Cambridge, MA.
Syverson, C. (2011) What Determines Productivity? Journal of Economic Literature
49, 326–365.
Wernerfelt, B. (1984). A Resource-based View of the Firm. Strategic Management
Journal, 5, 171–180.