requirements, are also included along with a remark to the cases and fields, where their application is reasonable. Knowing that a solution is not fully suitable is also a helpful realization in the search for the most appropriate one. Additionally, the presented research could be helpful for other companies with slightly different needs as well.
Figure 4.1.: Solutions Overview
Figure 4.1 shows an overview of products and solutions fulfilling the research criteria. Representative products, having advantages over other products of their category are discussed in greater detail. Features, which have already been described are referred to in the descriptions of other tools as well. Greater attention is given to the distinctive features and concepts. A summary of the analysis is provided in section 4.8 at the end of the current chapter, including a requirements matrix, cost analysis and discussion.
4.1. IBM Rational Insight
IBM Rational Insight [IBM11b] is a business intelligence solution (see section 2.3.7 Business Intelligence) for project performance measurement and man-agement, implementing the high-priority central requirements of figure 3.3. It aims at providing an insight into project performance through dashboards, such
4.1. IBM Rational Insight
as the one presented in figure 4.2). Project management metrics, Variance and Earned-Value analysis among others, are part of the project dashboards. Out-of-the-box dashboards and standardized reports are included in Rational Insight. The solution claims to reduce costs and time-to-market by assisting in the processes of cost, risk and quality management. "Live" data reports offer a view into the current project performance. IBM Rational Insight therefore fulfills the requirements to dashboarding functionality.
Figure 4.2.: View of IBM Rational Insight [IBM11b]. The figure presents the "look-and-feel" of a project dashboard.
Data historization provides guidance for decision-making and analysis. Support for the choice of corrective actions is not available. The solution was not found to assist the interpretation of the metrics and diagrams beyond providing legends. Rational Insight supports collaboration among team members by giving the
possibility to start a discussion, report a problem, make requests and rate an assets [Jaz11]. Automatic notifications about changes and availability of new or updated assets through e-mail subscriptions and RSS feeds can be set up. The requirements forconsistency and transparency have strong influence on the decision for the choice of a tool. The data warehouse, included in Rational Insight realizes the requirements to consistency and transparency.
Rational Insight is presented below based on its architecture. The main com-ponents of Rational Insight are:
• Rational Insight data warehouse • Rational Insight Data Services
• Rational Insight XML data configuration
• Cognos Business Intelligence Server/Rational Insight report server • Cognos Framework Manager
• Cognos Data Manager
Rational Insightdata warehousestores a copy of the operational data, which is used only for the purposes of project performance measurement and manage-ment (see section 2.4 for more information on data warehousing and its ben-efits). The data warehouse can be hosted on most of the traditional database servers, such as Oracle, IBM DB2 or Microsoft SQL Server. As already dis-cussed, data warehouses use a star schema for data storage. Rational Insight’s schema is open and can be accessed by other business intelligence applica-tions for reports creation if they implement the REpresentational State Transfer (REST) architecture. The latter is a layered client-server architecture for state-less communications, typical for distributed systems such as the World Wide Web. Non-IBM business applications can access data from the data warehouse using Rational Insight Data Services.
Rational Insight XML data configuration assists the extraction of data from external sources. It maps XML data to Rational Insight data tables. The other three components are part of the Cognos Business Intelligence solu-tion. The Rational Insight report server is an instance of the Cognos Business Intelligence Server. The next section addresses Cognos Business Intelligence shortly.
4.1.1. Cognos Business Intelligence
Similar to other business intelligence solutions, Cognos Business Intelligence (Cognos BI) [IBM11a] is an advanced system for enterprise reporting, analysis
4.2. Oracle Primavera P6 Analytics and Primavera P6 Reporting Database 2.0
and monitoring business performance. The architecture of Cognos BI is service-oriented, which allows the expansion of its functionality as the needs of the users evolve.
A central component of Cognos BI is the BI Server, which enables reporting, connecting to and querying the underlying database as well as user administra-tion. The generation of queries can be done with the metadata modeling tool Framework Manager.
The latest version 10 of Cognos BI, available on the market since October 2010, broadens the scope of the system in the areas of non-IBM products integration, collaboration, real time monitoring and advanced analytics.
Cognos Business Intelligence can be seen as an alternative to IBM Rational In-sight offering further aspects, but lacking the pre-configured Extract-Transform-Load (ETL) tools (see section 2.4) and the customized star schema. An eval-uation prepared for GDIS shows that extending Cognos BI to meet the given requirements is possible, but very time and resource consuming.
4.2. Oracle Primavera P6 Analytics and Primavera P6
Reporting Database 2.0
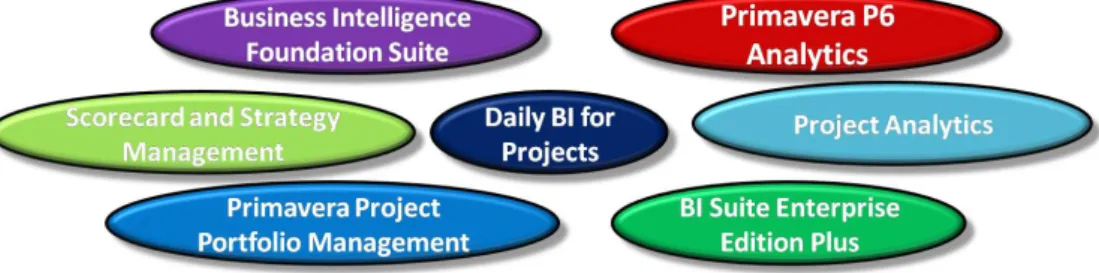
Oracle offers multiple different solutions that could be of interest. Their very similar sets of features complicated the analysis of the products. The products in the overview (see figure 4.3) fulfill the requirements, specified in section 3.5, to different extents. They range from project portfolio management solutions, over project analysis solutions to executive dashboards and business intelligence suites. Potential solutions are discussed in the following subsections. The Oracle product, which was found to best fulfill the requirements, summarized in figure 3.3, isPrimavera P6 Analytics [Ora11d].
Figure 4.3.: Overview of Oracle’s project management and business intelligence solutions
ware-house, project dashboards, project portfolio management, advanced reporting and a web portal.
A pre-configured set of dashboards and best-practice metrics are offered. Users are able to define own metrics, design reports and dashboards. The dashboards are project-centric. Historized data, statistics and trends assist the user in mak-ing decisions. Those features – custom metrics, project-orientated dashboards and "to-date" information – are typical only for P6 Analytics as compared with other Oracle products. Within the dashboard, drill-down capability allows an-alyzing project performance from the portfolio level down to the project’s work breakdown structure (WBS) and daily project progress. P6 Analytics is in-tended for project members, project managers and executives. Controlling is supported by resource, variance, Earned-Value management analysis and cost and schedule performance.
Figure 4.4.: Hierarchical dependency of Primavera P6 Analytics on other project management and business intelligence products. The information on the right points out some of the central features and properties of the corresponding solutions.
Data can be imported from XML, from Excel and from every traditional database. Primavera P6 Analytics is built on top of Primavera P6 Reporting Database – a data warehouse solution. The dependencies of P6 Analytics on other Oracle tools is displayed in figure 4.4. Therefore, P6 Analytics offers the benefits of a data warehouse as well (the features of data warehouses are explained in section 2.4). No additional license for P6 Reporting Database needs to be purchased [Ora11d].
Primavera P6 Analytics builds on top of the other products, depicted in figure 4.4. Primavera P6 Analytics is an independent product that requires the pur-chase of a special license. It includes a Restricted Use License (RUL) of the
4.2. Oracle Primavera P6 Analytics and Primavera P6 Reporting Database 2.0
Primavera P6 Reporting Database. Oracle BI is an enabling technology and is therefore a necessary component as well. On the one hand, the figure can be used to better understand the features of P6 Analytics. On the other hand, the dependencies presented in figure 4.4 are helpful for the analysis of the Oracle productsand to realize their interconnections. Those products and their features are shortly addressed in the following subsection.
4.2.1. Oracle Primavera P6 EPPM
From the technology point of view, Oracle Primavera P6 Enterprise Project Portfolio Management (EPPM) [Ora11e] is a contents repository-based web ap-plication, which does not include a data warehouse. It is a platform, that can be used as a stand-alone solution or can be extended by various applications, such as P6 Analytics and P6 Reporting Database.
Primavera P6 EPPM supports project-intensive companies during the whole project management lifecycle. This includes prioritizing, planning, managing and executing projects and project portfolios. The solution is intended to help companies manage a set of projects, determine those carrying high risk and the reasons for possible delays. Project team members can communicate status up-dates, issue resolution, scope changes and document revisions. Since version 8.0 (introduced in September 2010) Primavera P6 EPPM offers a workflow engine for business process automation.
4.2.2. Oracle Business Intelligence Foundation Suite
Oracle Business Intelligence Foundation Suite [Ora11b] is a BI platform which can be used independently or could provide the enabling technology for other applications. It comprises of BI Suite Enterprise Edition Plus, BI Standard Edition One, BI Standard Edition, Oracle Essbase and Oracle BI Publisher (XML Publisher). The above solutions have various restrictions with respect to user count and functionality. BI Standard Edition One supports up to 50 users. There are limitations to the number of the used CPUs as well. The standard edition is comparable to IBM Cognos 8 Report Studio and SAP BusinessObjects Web Intelligence and Desktop Intelligence. Of interest for the case at hand is Oracle Business Intelligence EE Plus, which is presented next.
Oracle Business Intelligence Enterprise Edition Plus (OBIEE)
OBIEE [Ora11a] provides the largest set of functionalities among the solutions of the Business Intelligence Foundation Suite. Primavera P6 Analytics relies on it for the traditional business intelligence functionality (see figure 4.4).
As noted on the right side of the figure, OBIEE includes a query and analysis server as well as a multi-dimensional online analytical processing (OLAP) server (refer to section 2.4.3 for more information about OLAP). Business intelligence and applications content can then be accessed by the user over the interactive dashboards. A set of more than 70 pre-configured dashboards with drill-down functionality is included. A feature, not supported by the other versions is the generation of offline dashboards, brought by the Oracle BI Briefing Books com-ponent. Other features, specific to OBIEE only, are the automatic distribution of information and alerts, provided by the BI Delivers component and the sup-port for Microsoft Office products. The latter is realized via plug-ins, allowing, among others, the creation of MS Office presentations using data from the BI server.
Oracle Scorecard and Strategy Management
The relatively complex Oracle product and solutions portfolio includes the Or-acle Scorecard and Strategy Management. It offers functionality that can be of interest to bigger enterprises, such as GDIS. It is an extension to the Oracle BI Enterprise Edition (OBIEE), which creates a stronger connection between project dashboard data and strategic goals. Oracle Scorecard and Strategy Man-agement is also a platform used for gathering and dissemination of the progress information to and from the project members and tracking this information over time. The application could be used to clarify strategic goals and define success criteria. Oracle Scorecard and Strategy Management provides scorecards for the strategic goals, but does not meet the central requirements elicited in chapter 3.
4.2.3. Oracle Project Analytics
Oracle Project Analytics [Ora11f] is an alternative Oracle business intelligence solution. It contains a data warehouse, ETL tools, data models, dashboards, metrics and other concepts which are very similar to the concepts of Primavera P6 Analytics.
Finding the small differences in the comparison of the two solutions was a chal-lenge. Oracle Project Analytics generally offers a higher level view in terms of key performance indicators (KPIs). It supports other additional areas, such as financing, which are not supported by P6 Analytics. The latter offers more sup-port for capacity management and scheduling. The difference between the two products, according to Oracle, is that P6 Analytics is aPrimavera-only product and is not part of the formal Oracle BI application taxonomy [Ora11d], while Oracle Project Analytic is.
4.3. Microsoft SharePoint
4.2.4. Oracle Daily Business Intelligence for Projects
Oracle Daily Business Intelligence for Projects (Project Intelligence) [Ora11c] is similar to the above solutions to the extent that it offers support for projects. It includes metrics, summarized in dashboards, which are accessible over the web through a portal. Project controlling functionalities, such as data historization, analysis and forecasting are supported as well.
Although similar, there are some aspects of the solution that make it unsuitable for the case at hand (see section 3.5). Daily BI for Projects is part of the Oracle E-Business Suite and is therefore primarily targeted at executives and not for operational analysis. It offers a different set of metrics, most of which are for financial analytics. Oracle Daily Business Intelligence for Projects provides the executive’s daily summary of key performance indicators, such as revenue, cost, margin, capital projects cost, contract projects cost, bookings, backlog, and utilization. Instead of using a data warehouse, the solution uses batch programs to routinely collect data changes.
4.3. Microsoft SharePoint
Microsoft SharePoint [Mic11] is a rather generic multi-purpose product that can be used for project controlling and performance management using dashboards and metrics. This description refers to SharePoint 2010, which is said to be technologically very different from previous versions of SharePoint. SharePoint can be used for various purposes, including as a pure document management system, as a portal, for team collaboration and process automation. It can also be used for business intelligence, project controlling and performance manage-ment, which are the fields of highest interest for this work. SharePoint has a conceptually different approach to enterprise computing. It offers a platform for collaboration, storage, search, management and visualization of data, which can be used for different purposes in different areas. A characteristic of Share-Point is its high degree of integration with Microsoft Office Products, such as Excel, which are perhaps the most widely-spread business intelligence tool to date. Next, SharePoint is described based on the requirements, which were summarized in figure 3.3.
Figure 4.5 shows the BI stack aspect of SharePoint. At the basis is the data warehouse, which includes an SQL Server 2008 R2, a report builder, a database management system and ETL tools. It includes adapters (as part of the business connectivity services) for accessing data from Oracle, IBM and SAP systems. On top of the warehouse are components, such as PerformancePoint, Excel and Visio Services, PowerPivot, Web Analytics and Chart Web Part as well as integration services that build SharePoint.
Figure 4.5.: SharePoint BI Stack (the "BI Burger"). Source: [Sha11]
Analysis Services. A metric is defined by specifying its data source, range, calcu-lation formula, etc. and can be stored centrally in a metrics library. Dashboards are created by adding combinations of the created metrics, which can also be related. The created cubes enable multi-dimensional views and drill-downs. Ad-ditionally, using PerformancePoint, Excel Services, PowerPivot, a pivot diagram can be created in Excel. Data can be imported to Excel from various databases. The horizontal and vertical slicing dimensions of the OLAP cube can be defined in Excel. The resulting diagram and cube can be published to the dashboard. A Web Part is a modular unit of information, which can be put in specified web part zones within a SharePoint site. Web parts allow the user, among other, to edit a dashboard from the browser and to customize its view. Chart web parts are out-of-the-box web parts, which can be used for quick configuration of advanced visualization of data from many sources. A drawback of chart web parts is that they do not support drill-down analysis.
Although the creation of dashboards does not require programming, it is sup-ported. Handlers can be attached to events, Windows Communication Founda-tion (WCF) services can be used to add specialized funcFounda-tionality to SharePoint. Many companies offer connectors to third party systems.
4.4. Jaspersoft BI Suite
of collaboration are discussed in section 2.5. It is up to the dashboard designer to decide which collaboration capabilities are reasonable. Live chat and team member profiles are supported. A profile could contain details to the team members, such as the projects they participated in, their position, expertise and interests.
4.4. Jaspersoft BI Suite
Jaspersoft BI Suite 4 (Jaspersoft 4) [Jas11] is a commercial open-source BI solu-tion. It provides reporting, interactive end-user query and analysis, dashboards and data integration. Jaspersoft 4 exposes public APIs enabling customization, extensibility and integration. It is available as a free community edition and as a paid professional edition. Jaspersoft 4 fulfills a large subset of the requirements, listed in figure 3.3. A summary of the compliance of Jaspersoft 4 to the re-quirements is provided in section 4.8 at the end of this chapter as it is provided for the other solutions. Next, central aspects of the product are discussed. Jaspersoft 4 does not include a data warehouse, but supports the usage of a data warehouse by providing Extract-Transform-Load (ETL) tools (see section 2.4). The ETL graphical designer shown on figure 4.6 allows the modeling of ETL "jobs", which include data sources, data sinks and transformation components. Custom ones can be added as well. Pre-configured connectors for SQL Server, mySQL and some Micorsoft, Oracle and SAP systems are included. The ETL tools are used to extract data from various sources, process it and merge it into a data container, such as a data warehouse.
JasperReports is the component of Jaspersoft 4 responsible for handling the creation of web reports and static pixel-perfect reports. Built on JasperReports, JasperServer is an interactive report server, allowing the modeling of reports by dragging-and-dropping components from a report library, such as classical pie and bar charts, and then specifying their properties and data sources. Reports creation and distribution can be automated. Interactive dashboards can be built based on reports and then published on a web server.
OLAP data analysis is supported, giving the analyst the ability to view, slice and dice, drill and filter data. The OLAP cube is realized as a metadata mapping onto relational databases. Data analysis with Jaspersoft 4 can be done in-memory as well. Compared to accessing a hard drive, processing data in RAM is much faster. This technique could allow dynamic data analysis without a traditional data warehouse. The functions that were mentioned above can be performed live over a web interface. Reports, dashboards and analysis views are referenced through parameterized URLs, which allows their embedding into other applications as well.
Figure 4.6.: Jaspersoft BI 4 ETL [Jas11]. The process of extraction, transfor-mation and saving of data is modeled graphically using the ETL designer. Connection details can be defined for source and target components, among others.
4.5. Pentaho
Pentaho [Pen11] is a commercial open-source BI solution. It is very similar to Jaspersoft 4 with respect to data integration, reporting, dashboarding and analysis. A summary of the features is provided in figure 4.7, showing the functional architecture of Pentaho. Only the aspects, which distinct Pentaho from other solutions are discussed next.
Pentaho goes further than all other analyzed solutions regarding decision-making support by providing a data mining tool. Data mining is the process of
dis-4.6. Dundas Dashboard
Figure 4.7.: Pentaho Functional Architecture [Pen07]
covering meaningful correlations, patterns and trends by sifting through large amounts of data stored in repositories and applying statistical and mathemati-cal techniques [Gar11]. For details on the usage of data mining for advanced business intelligence refer to [SPB10]. Data mining is a predictive analysis tech-nique, which supports performance improvement. For example, it could warn a project manager of the possible occurrence of a problem, based on the analysis of risk characteristics and past experience.
4.6. Dundas Dashboard
Dundas Dashboard [DDV11] is a commercial product, focused on visualization of data in dashboards. It does not include a data warehouse nor ETL tools. Dundas Dashboard features connectors to popular data providers, such as MS SQL Server, MySQL, MS Access, Oracle 10g/11g, SAP Business Warehouse, Teradata Database, ExcelServices (SharePoint), CSV files, Excel files and
oth-ers. The open dashboard API allows the addition of other connectors, custom visualization types and controls. Dundas Dashboard provides a drag-and-drop web-based dashboard designer.
Figure 4.8.: Dundas Dashboard annotations [DDV11]
A distinctive feature of Dundas Dashboard are annotations (see figure 4.8). They allow to mark a point or a region in a diagram and discuss it with other project members. Different types of annotations are available, including text, callouts (discussable comments), arrows from one point to another and polygon markers.
Dundas differentiate between metrics and "stubbed" metrics. Those are metrics without specified data connectors, OLAP cubes or virtual tables. Once created, they can be used for dashboard design. Dimension values for stubbed metrics are populated with randomly generated data. The purpose of stubbed metrics is to shorten the time for dashboard creation by enabling the parallel design of metrics and definition of the data sources. Metrics experts would not need to wait for IT specialists to make the required changes in the data warehouse. Instead, metrics experts could design stubbed metrics and later fill their dashboards with the real data.
4.7. CenterView
4.7. CenterView
Corda CenterView [Cor11] is a dashboarding product. It comprises of a dash-board Builder, Server and Administrator console. Corda Mobile is a mobile application for viewing CenterView dashboards on the iPhone. Builder is a Java-based application for creating dashboards, which is, unlike Dundas 4.6, a desktop application. The CenterView Server publishes the created dashboard as a web application. CenterView Administrator manages the server application as well as the accessibility to dashboards and to specific metrics for the different user roles.
4.8. Discussion
A wide variety of products exists on the market. Each has its set of provided features, covering the elicited central requirements to a different extent. The li-censing policy of the providers pose a problem for the comparison of the prospec-tive solutions. Another problem is sometimes the insufficiency of information, required by the technical evaluator or system architect. Many companies con-centrate on the marketing side of their products and provide less information, regarding the product technology stack, architecture diagram, the integration with other products and the types of interfaces.
A third issue, posing a challenge for a comparison of project performance man-agement products is that features are organized differently and often assigned to different components. Often multiple solutions are offered by the same com-pany, such as Oracle and SAP, where their common and unique components are not clearly defined. Reasons for that are often company mergers and marketing policies. The last couple of years have been marked by some major mergers in the field of dashboarding and performance management. The result is a signif-icant market consolidation. Oracle acquired Hyperion in March 2007, as well as JD Edwards, PeopleSoft and Siebel. Integrating different products, based on different technologies into one suite has probably been a challenge for Oracle. Currently Oracle offer Primavera and Project Analytics, which have very similar features, but are marketed separately.
SAP followed by acquiring BusinessObjects. In February 2011, SAP applied an initiative to rename, re-brand and reorganize its business intelligence products with the intention to better describe their functionality, which has evolved over the years and mergers. Besides the positive effects, the initiative has created some broken links in the products’ documentation, confusion with respect to the mapping of the names and the actual features of their products. Some SAP products are still available on the market, but will no longer be developed as a consequence of the acquisition of BusinessObjects. Additionally, IBM acquired Cognos in oder to secure its position as one of the market leaders.
4.8.1. Overview of the Analyzed Products
The performed market research included the analysis of different types of prod-ucts, ranging from flat Excel-based dashboards and cockpits, through data vi-sualization tools, commercial and open-source business intelligence products to sophisticated analysis and decision-making support products, delivering a data warehouse. Products were marketed as dashboards, cockpits, project portfo-lio management tools, business intelligence products, measurement and perfor-mance management products.
The performed analysis includes products, such as IBM Rational Insight, IBM Cognos BI, Oracle Primavera, Oracle Project Analytics, Oracle Daily Intel-ligence for Projects, Microsoft SharePoint, Jaspersoft BI, Pentaho BI, Dundas Dashboard, Corda CenterView, SAP BusinessObjects, SAS solutions, ActanoR-Plan, Parseto cockpit, CAST Governance Dashboard, SCCH SoftCockpit, Mar-velIT Dash, Atos Origin Management Cockpit and others. The products were evaluated based on the requirements and existing infrastructure of GDIS. There-fore Excel-based templates and products of research projects were not focused on. Badly supported projects with no recent development were filtered out. As little or no own development was required, the focus was put on commercial products. Not all of the mentioned were described in detail, as they provide similar functionality to already presented products. This is the case with SAP BusinessObjects [SAP11] and SAS BI [SAS11], which provide a feature set and solution paradigm very similar to Oracle’s. CenterView as addressed as a repre-sentatives from the data visualization area. Other products, such as MarvelIT DASH [DAS11] are very similar to CenterView.
An overview of the representative products, fulfilling the specified requirements, is offered in section 4.8.2.
4.8.2. Requirements Fulfillment
The results of the analysis is presented in the matrix of figure 4.9 , showing representative products and their degree of fulfillment of the elicited central re-quirements (see chapter 3). Those products realize the required functionality in different ways and often offer additional features. Those features might be very helpful for business intelligence projects, although they do not explicitly belong to the central requirements. For details refer to the corresponding sections of this chapter.
Figure 4.9 is discussed starting from Microsoft Excel through IBM Rational Insight. This reversed order intends to provide a further aspect of the products overview. Microsoft Excel is included in the comparison as it is the platform currently used in GDIS. It supports data analysis and pivoting. Drill-downs can be realized, but are not innately supported by Excel. More features are provided by CenterView, which allows the creation of more sophisticated dashboards over
4.8. Discussion IBM Ratio n al In sig h t Oracle An alyt ics M S Sh areP o in t Jasp erso ft BI P entah o D u n d as Co rd a Ce n te rVi ew M S Exc el
Support for data analysis x x x x x x x x
Support for reporting x x x x x x x x*
Role-specific data views x x x x x x x
Customizable views x x x x x x
Common interface for data
collection/warehouse x x x x* x*
Centralized system to avoid migration issues x x x Automatic versioning and historization x x Integration with other IBM tools and systems x
Developed by an established, reliable company x x x x x x x x
Collaboration x x x x
Multi-dimensional analysis, drill-down, data mining
x* x x* x* x x* x* Legend:
x = requirement fulfilled
x* = requirement partially fulfilled
Dasboard functionality
Consistency and transparency
Easy maintenance
Advanced functionality
Requirement/Sub-requirement
Figure 4.9.: Requirements fulfillment matrix
the web browser. Different roles are available and access rights can be set. The administration of metrics and dashboard visibility is managed from a central point.
Dundas Dashboard goes a step further by promoting communication in the team. Jaspersoft provides a business intelligence solution with ETL tools and extended features. Pentaho on the other side adds decision-making support by providing data mining. Microsoft SharePoint, Oracle Analytics and IBM Rational Insight take dashboarding to another level by including data warehouse technology. The main advantages of those products are summarized in the next section.
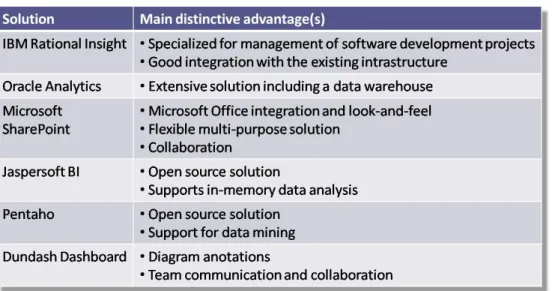
4.8.3. Advantages
Figure 4.10 displays a compact view of the advantages, distinguishing the cor-responding products from their competitors. Those features describe a further aspect of the tools, which are not visible from the matrix in figure 4.9.
Figure 4.10.: Main advantages of the solutions
Perhaps the most distinctive feature of IBM Rational Insight is its specialization for assisting the management of software development projects as well as for process improvement. While IBM’s competitors primarily provide solutions for executives in the manufacturing, financial, gas-and-oil, educational, government and other branches, IBM has noticed the need to assist software development companies. Instead of providing a wide-ranged portfolio of services, Rational Insight concentrates on the needs of the industry. It envisions the role of the process improvement expert, which is not supported by its competitors. In the case of GDIS, Rational Insight has a further strong advantage, namely that the already existing software infrastructure including requirements and test management systems is comprised of IBM products. This aspect implies good integration with those tools without the need for own development, as connectors to those systems are provided by IBM.
Oracle offers platform consisting of a wide range of products with advanced functionality. It is an extensive solution, including features needed by executives and sales managers for example. In the case of GDIS however, non-Oracle systems covering some aspects of Oracle’s products are already in place. Microsoft SharePoint 2010 has a conceptually different view on enterprise com-puting. It is not specialized for a specific industry, but instead offers the tools that most industries need – a data warehouse, a platform for creation of perfor-mance dashboards and other visualizations, tools for collaboration and a server to provide the contents in an editable form to web users. It leverages Excel ’s capabilities and extends them to create a flexible multi-purpose solution. Dashboards can be created in a SharePoint environment with the MS Office look-and-feel. Analysis can be performed in a web environment and dashboards can be exported to Excel or to PowerPoint for reporting and communication
4.8. Discussion
purposes. The collaboration opportunities go beyond those of any other of the analyzed products.
Jaspersoft and Pentaho offer commercial open-source solutions and therefore price and visibility into the API are one of their main advantages. Jaspersoft BI performs in-memory analysis, thus achieving quick access to data without an underlying data warehouse. Pentaho’s advantage is the support for data mining. Dundas Dashboard is a comparatively less complex solution, specialized in dash-boards. It does not provide advanced business intelligence and decision-making support, but can be integrated in such environments if needed. Distinctive fea-tures of Dundas Dashboard are the annotations and the implementation of team communication and collaboration capabilities.
Apart from providing advantages, project measurement and management prod-ucts could also pose challenges to companies. The challenges discussed in the next section refer not only to the presented products, but also to the choice of such products in general.
4.8.4. Considerations and Risks with BI initiatives
Many aspects need to be taken into account when considering the purchase or development of a business intelligence product. For dashboard projects the de-pendence on an underlying data warehousecould be a source of problems. A dashboard relies on the assumption that the needed information is available. In the cases when the data warehouse has to be adapted to include new data, dashboard teams often need to wait. A solution to this problem could be the use of stubbed metrics, which allow the separation of metrics description from their data sources, as implemented by Dundas Dashboard (see section 4.6). A critical consideration is that the data warehouse needs to be built in order to provide the needed information instead of designing dashboards, which visualize what the data warehouse contains.
In his article calledWhy 70% of Dashboard Projects Fail [GA08], Greg Aldridge expresses the opinion that the choice of a bigger vendor for dashboard softwareis often the main reason for failure of dashboard initiatives. He argues that big vendors are report-oriented and therefore their systems aim to deliver backward-looking information. Future-oriented information may not always be available in a data warehouse or in a database, but could originate from internet sources, operational applications and spreadsheets. While this suggestion may not always be true, it is a factor that needs to be considered in the choice of a business intelligence solution.
The scalability of a product’s licensing policy is another very important factor when that should be taken into account when considering a BI initiative. As dashboards and cockpits are intended to be used by many people, the licensing
policy should provide for growth. Productivity should not be bound by techno-logical barriers or the pricing model of a product. In the next section the costs aspect is addressed.
4.8.5. Costs
This section aims to provide an orientation with respect to the costs. Many vendors treat information regarding costs as a trade secret and provide it only after discussions with a sales representative. Other factors, which make the cost analysis a challenging task, include the different packaging of product features, as discussed in the beginning of section 4.8. The following guideline is based on a prise study from 2010 (see [Con10]), which compared the licensing policies of the business intelligence suites of IBM Cognos, Micorstrategy, Oracle, Pentaho and SAP.
Figure 4.11.: Average cost per user over three years, by vendor (source [Con10])
The study considers a small configuration one, which has 25 users, a medium-sized one has 100 users and a large configuration is one with 500 users. According to this classification, GDIS requires a medium to large configuration with up to 200 anticipated users at the beginning. Growth beyond this number is expected in the future. As noted in the previous section, the pricing model is a central factor for the choice of a product. Figure 4.12 shows the average cost per user over three years by vendor.
Note that switching from a medium to a large configuration could even double the costs, as is the case with SAP, according to the study. Other vendors, such as IBM and Pentaho, offer models, which scale better from the buyer’s point of view.
4.8. Discussion
Figure 4.12.: Division of BI costs over three years (source [Con10])
What can also be derived from this diagram is that the cost for licenses for medium-sized open source commercial configurations is between 40% and 20% of the cost of "traditional" vendor products. The study takes into account that the total cost of ownership of a business intelligence product comprises to 70% of labor, 20% for software and 80% for hardware as shown on figure 4.12. The presented information could only be used as a guideline. It shows the price ranges of some of the popular products in the market. Licensing costs could vary dramatically based on the type of vendor (commercial, commercial open source), the expected configuration size, the particular vendor, the desired set of features, etc.

![Figure 4.2.: View of IBM Rational Insight [IBM11b]. The figure presents the](https://thumb-us.123doks.com/thumbv2/123dok_us/8596108.2330473/2.892.158.723.323.922/figure-view-ibm-rational-insight-ibm-figure-presents.webp)

![Figure 4.5.: SharePoint BI Stack (the "BI Burger"). Source: [Sha11]](https://thumb-us.123doks.com/thumbv2/123dok_us/8596108.2330473/9.892.177.741.165.590/figure-sharepoint-bi-stack-bi-burger-source-sha.webp)
![Figure 4.6.: Jaspersoft BI 4 ETL [Jas11]. The process of extraction, transfor- transfor-mation and saving of data is modeled graphically using the ETL designer](https://thumb-us.123doks.com/thumbv2/123dok_us/8596108.2330473/11.892.180.742.156.747/figure-jaspersoft-process-extraction-transfor-transfor-graphically-designer.webp)
![Figure 4.7.: Pentaho Functional Architecture [Pen07]](https://thumb-us.123doks.com/thumbv2/123dok_us/8596108.2330473/12.892.182.693.168.671/figure-pentaho-functional-architecture-pen.webp)
![Figure 4.8.: Dundas Dashboard annotations [DDV11]](https://thumb-us.123doks.com/thumbv2/123dok_us/8596108.2330473/13.892.178.738.289.680/figure-dundas-dashboard-annotations-ddv.webp)