Research Note
Optimization of Withering Time and
Fermentation Conditions During the
Manufacture of Black Tea Using
a Response Surface Methodology
L. Emdadi
1, B. Nasernajad
1, S.T. Shokrgozar
2,
M. Mehranian
1and F. Vahabzadeh
1;Abstract. The Central Composite Design (CCD) technique, a Response Surface Methodology (RSM), was used to study the eect of the withering time and fermentation conditions of tea leaves on black tea quality parameters. A three level, three variable, design was adopted. The three independent variables investigated in this experiment, each at three levels, were; withering time, fermentation duration and fermentation temperature. Responses were represented mathematically by a second-order quadratic equation and assessed, using a polynomial multiple regression model. The highest level of the theaavins (TFs) formation ( 1:25%) was with the withering time at about 19-20 hrs, while the fermentation duration was about 25-30 min (fermentation temperature = 25C). The gradual increase in
the thearubigins (TRs), as the function of the withering time and the fermentation temperature, was noticeable. The increase in TR content at > 11:5% was minor and related to the narrower ranges of the two parameters studied (x1 and x3). The predicted dependence of the TLC evaluation (%)
(spectrophotometric measurement) on the fermentation duration (x2) and on the fermentation temperature
(x3) was statistically signicant. The results of this study suggest that the CCD and RSM can be eciently
used in the fermentation process in the manufacture of black tea.
Keywords: Black tea fermentation; Theaavins; Thearubins; Total liquor color; Response surface methodology; Experimental design.
INTRODUCTION
Although all the processing stages contribute greatly to the nal quality of black tea, the fermentation step is the most critical in view of a number of crucial biochemical events occurring in this process. The endogenous avanols in the tea leaves undergo various oxidative types of enzymatic reaction. Catechins, as the major component of the polyphenolic fraction of
1. Department of Chemical Engineering, Food Engineering and Biotechnology Group; Food Process Engineering and Biotech-nology Research Center, Amirkabir University of TechBiotech-nology, Tehran, P.O. Box 15875-4413, Iran.
2. Iran's Tea Research Oce, Lahijan, Guilan, P.O. Box 1163/34, Iran.
*. Corresponding author. E-mail: [email protected].
Received 1 January 2007; received in revised form May 2007; accepted 8 october 2007
green tea leaves, are the substrates of polyphenol oxi-dase (PPO), which is the key enzyme in the formation of black tea components, namely theaavins (TFs) and thearubigins (TRs). PPO catalyzes the oxidation of hydroxyphenols to their quinone derivatives which, thereafter, polymerize spontaneously [1]. The contribu-tion of tea leaf peroxidase (POD) to the fermentacontribu-tion process is also known to be considerable [1,2]. The possible role of POD in the oxidative breakdown of TFs and in the formation of TRs has been pointed out, though in this coordinated action of PPO and POD enzymes, PPO is shown to be of prime importance in terms of the oxidation of avan-3-ol substrates [2,3]. The ratios of these two enzymes in the tea leaves could vary widely and the fate of catalase as the third enzyme in the tea leaf is also important in these biochemical events, i.e. the catalytic action of catalase leads to the rapid removal of POD [3].
The positive health benets of aqueous extracts of black and green teas due to properties such as antimutagenic, hypocholesterimic antidiabetic, anti-bacterial, anti-tumor and anti-UV induced oxidative DNA damage, have been demonstrated in many stud-ies [4]. In fact, tea contains antioxidant nutrients and non-nutrient phytochemicals commonly known as avonoids, which have been regarded as safe by the US Food and Drug Administration [4,5].
In addition to the physical and genetic properties of tea leaves and the conditions of withering and rolling processes, factors such as temperature and time of fermentation and the availability of O2 are among
the known factors to aect these enzymatic reactions. There is a strong correlation between the quality of black tea (i.e. total liquid color, TLC) and the quantity of TF and TR pigments [6]. In fact, the use of the TF value of black tea as a measurable parameter for the evaluation of tea quality has been proposed in the literature. A variety of biochemical reactions occurring during black tea fermentation are critical for evaluating this process and the quality of black tea is quantied by the presence or absence of chemical substances that impart color, brightness, briskness, strength and avor to the infusion. Beverage black tea made from green tea leaves is the most popular drink in Iran. The annual production of black tea was about 61000 tons in the year 2000 and the area of cultivation in Guilan as the major tea manufacturing region in Iran was about 35000 hectares [7]. The usual practice in tea plant cultivation is to use plants having some agronomic advantages such as high yields, or resistance to some adverse environmental conditions or hazards of some chemical used for plant growth. It is obvious that such agronomic advantages are of economic value. Attempts in most tea plant breeding programmes are directed toward selecting plants which possess a combination of these described characteristics. A special hybrid of the Camellia variety, named clone 100, has been developed in the Iran Tea Research Center and has been introduced to local tea producers in the last two years, in order to improve the quality values of black tea (i.e. high levels of polyphenols), while upon cultivation, this hybrid demonstrates less sensitivity to seasonal temperature changes typical of Guilan's climate. A temperature decrease during winter is the most obvious climatic factor aecting tea plants. The exposure of plants to low temperatures causes oxidative stress, which is revealed by the production of a Reactive Oxygen Species (ROS). Levels of these species in plants increase at low temperature and it is in light and chilling-induced photoinhibition that the fate of the process lies; the interaction of ROS with the biomolecules causes intense cellular damage [8]. On the basis of the applied rolling stage of the fer-mentation process during black tea manufacture, tea
production is carried out in either one of the two processes, namely conventional rolling or unconven-tional rolling, i.e. CTC (Cut, Tear, Curl) methods. The rolling stage in black tea manufacturing in Iran is almost exclusively carried out by a conventional process. Despite the high level of tea consumption in Iran (the amount of annual consumption is around 11000 tons), the national sale market, regarding the cultivation and production of Iranian tea, is at a low level and Iran's tea industry faces huge and very real problems.
Experimental design considers several factors si-multaneously and attempts to characterize the rela-tionship between the independent variable and one or more dependent or response variables. The Response Surface Methodology (RSM) is an eective tool for optimizing a process, in which several factors and their interactions aect the desired response [9-11]. RSM uses an experimental design such as the Central Com-posite Design (CCD) to t a mathematical model by the least squares technique [10]. The adequacy of the proposed model is then revealed using the diagnostic checking tests provided by the analysis of variance (ANOVA). Response surface plots can be employed to study the surfaces and locate the optimum. CCD is a response surface regression, which can deal with quadratic terms or, equivalently, with curvature in the response surface. In recent years, the use of RSM in the evaluation of enzymatic and biological processes has gained importance and is becoming an innovative ap-proach in many research studies and even in industrial operations [11,12]. The objective of the present work is to assess the black tea quality parameters, i.e. TF, TR and TLC of Iranian cultivated and produced tea, using the statistical design of an experiment. In fact, there are a few methods available to detect optimum fermentation time directly or indirectly; quite recently, an electronic nose was developed to monitor volatile emission patterns during black tea manufacture [4]. The peaks that appeared in the sensor outputs were the basis for detecting the optimum fermentation time in that study. In the present study, a CCD and RSM were used to develop a mathematical equation providing a quantitative evaluation of the black tea quality parameters as a means of optimizing the fermentation process, while a conventional rolling process being the most common practice in Iranian tea manufacturing has been employed. Withering time, fermentation duration and fermentation temperature were selected as the controllable factors aecting the quality of black tea. Application of the statistical design to the manufacturing of black tea provides a systematic procedure for obtaining repeatable results, in order to obtain high quality black tea. This approach might be used as a way of nding the quality of tea in Iranian and international markets.
MATERIALS AND METHODS Leaf and Black Tea Manufacture
Tea leaves (the tip and two to three small delicate leaves) were collected from the experimental plantation tea farm in Guilan (altitude 7 m below sea level). The tea leaves were then spread out on wire trays (600 g) and withered by passing cool air over them at about 25C for a pre-determined time. The withered tea
leaves were processed using the conventional method. The humidity of the air at the site of the tea leaf collec-tion and during the withering process was 60-80% and 75-80%, respectively. During the fermentation process, the humidity was controlled at 90%. The macerated leaves were then spread out in trays and placed in a fermentation cabinet for a pre-determined period of time of oxidative fermentation while the fermentation temperatures were set at those levels used in this work. The fermented tea leaves were dried in a mini-uid bed drier at 105C for 26 min; the dried black tea,
after reaching room temperature, was packed in plastic bags and stored until further analysis. For every 15 experiments, according to the CCD arrangement and as it is shown in Tables 1a and 1b, 2.9 g of dried black tea were packed. The dried black tea was subjected to chemical analysis. The quality parameter studies were theaavin, thearubigin, highly polymerized substances and total liquor color. The solvent extraction of tea was carried out according to a procedure described elsewhere [1]. For each experiment, 600 fresh green leaves were used (duplicate). The dried black tea was subjected to chemical analysis without sorting. A tea infusion was made with 200 ml of boiling water into a tared ask having 4 g of tea. The ask was held in the water bath for 10 min; the infusion ltered using whatman #1 lterpaper and an appropriate volume was taken for chemical analysis.
Experimental Design and Data Analysis
A CCD in the form of 23 full factorial designs was
used. The rst eight treatment combinations form a 23
factorial design. The next six treatment combinations are referred to as axial runs, because they lie on the axes dened by the design variables. The last treatment combination represents the center run and
Table 1a. Selected independent variables and their ranges.
Variables Coded and Actual Lavel -1 0 1 Withering Time (x1, hrs) 10 15 20
Fermentation Duration (x2, min) 30 90 150
Fermentation Temperature (x3,C) 20 25 30
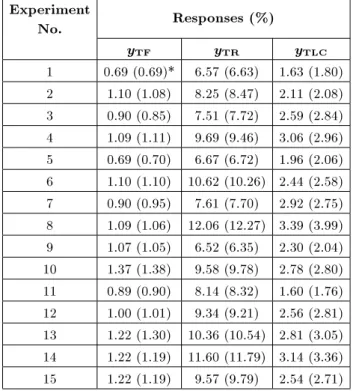
Table 1b. Experimental and predicted values of the three responses.
Experiment
No. Responses (%)
yTF yTR yTLC
1 0.69 (0.69)* 6.57 (6.63) 1.63 (1.80) 2 1.10 (1.08) 8.25 (8.47) 2.11 (2.08) 3 0.90 (0.85) 7.51 (7.72) 2.59 (2.84) 4 1.09 (1.11) 9.69 (9.46) 3.06 (2.96) 5 0.69 (0.70) 6.67 (6.72) 1.96 (2.06) 6 1.10 (1.10) 10.62 (10.26) 2.44 (2.58) 7 0.90 (0.95) 7.61 (7.70) 2.92 (2.75) 8 1.09 (1.06) 12.06 (12.27) 3.39 (3.99) 9 1.07 (1.05) 6.52 (6.35) 2.30 (2.04) 10 1.37 (1.38) 9.58 (9.78) 2.78 (2.80) 11 0.89 (0.90) 8.14 (8.32) 1.60 (1.76) 12 1.00 (1.01) 9.34 (9.21) 2.56 (2.81) 13 1.22 (1.30) 10.36 (10.54) 2.81 (3.05) 14 1.22 (1.19) 11.60 (11.79) 3.14 (3.36) 15 1.22 (1.19) 9.57 (9.79) 2.54 (2.71)
*: The actual values are also given in parentheses.
accordingly 15 dierent experiments were performed (Table 1b). CCD method in this arrangement allows the development of appropriate empirical equations (i.e., the second-order polynomial multiple regression equation) [9-11]. The model for predicting the quality of the black tea (response variable) was expressed as:
^yi= 0+ n
X
i=1
ixi+ n
X
i=1
iix2i + n 1X
i=1 n
X
j=i+1
ijxixj;
(1) where ^yi represents the response variable; 0 is the
intercept coecient; i, ii and ij are the regression
coecients; n is the number of variables studied; and xi and xj represent the regressor variables. The
Design Expert version 7 software was used for the data analysis.
RESULTS AND DISCUSSION Central Composite Design and Fitted
Regression Models as Related to the Black Tea Quality Assessment
In the present work, the relationship between three criteria of tea quality evaluation, namely TF, TR and TLC, and three controllable factors, namely Withering Time (WT), Fermentation Duration (FD) and Fer-mentation Temperature (FT) was studied. A CCD arrangement as a general concept based on the arrange-ment presented in the relevant references [9-11] allows
the development of mathematical equations where each response variable, y, in the present study is assessed as a function of withering time (x1) fermentation duration
(x2) and temperature of fermentation (x3) according to
the following equation:
^y = 0+ 1x1+ 2x2+ 3x3+ 11x211+ 22x222
+ 33x333+ 12x1x2+ 13x1x3+ 23x2x3; (2)
where the regression coecients are the intercept, (0),
linear, (1, 2, 3), interaction, (12, 13, 23, 123)
and quadratic, (11, 22, 33).
The results obtained were then analyzed by ANOVA to assess the goodness of t. Only terms found statistically signicant were included in the model. Therefore, a new ANOVA was performed for the reduced mathematical model. The result of ANOVA (statistical parameter) is shown in Table 2. The models for TF and TR formation and TLC assessment were signicant by the F test at a 5% condence level (Prob> F < 0:05). Table 3 also shows those regression coecients that remained in the models, while the statistically non-signicant terms have been dropped. The relative contribution of each of the controllable variables to each of the three response variables studied in the present work was directly measured by the respective coecient in the reduced (i.e., tted) model. The following
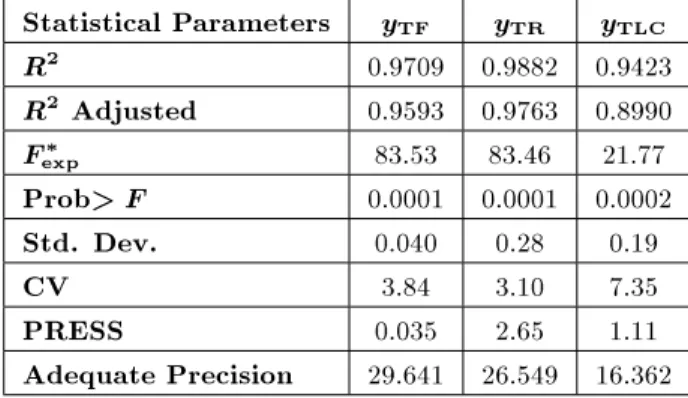
Table 2. Statistical parameters obtained from ANOVA for the tted models.
Statistical Parameters yTF yTR yTLC
R2 0.9709 0.9882 0.9423
R2 Adjusted 0.9593 0.9763 0.8990
F
exp 83.53 83.46 21.77
Prob> F 0.0001 0.0001 0.0002 Std. Dev. 0.040 0.28 0.19 CV 3.84 3.10 7.35 PRESS 0.035 2.65 1.11 Adequate Precision 29.641 26.549 16.362
Fexpdened as the ratio of the mean square of the model
to mean square of the error.
tted regression models were used to quantitatively investigate the eects of withering time, fermentation duration and temperature of fermentation on the characterization of the black tea quality, considering the clone 100 and use of the conventional rolling stage for the manufacture of black tea:
TF formation:
yTF= 1:22 + 0:15x1+ 0:051x2 0:053x1x2 0:28x22:
TR formation:
yTR= 9:71 + 1:51x1+ 0:60x2+ 0:59x3+ 0:57x1x3
1:62x2
1 0:92x22+ 1:48x23:
TLC evaluation:
yTLC= 2:60 + 0:29x1+ 0:51x2+ 0:20x3+ 0:17x1x3
0:43x2
2+ 0:49x23:
Statistical parameters obtained from the ANOVA for the reduced model of the black tea quality assessment are given in Table 2. Since R2always decreases when a
regressor variable is dropped from a regression model in statistical modeling, the adjusted R2, which takes the
number of regressor variables into account is usually selected [13]. The R2 coecient gives the proportion
of total variation in the response variable explained or accounted for by the predictors (xs) included in the model. In the present study, the adjusted R2 were
0.96 and 0.98 for TF and TR formation, respectively. The adjusted R2 for the TLC evaluation was 0.89.
The R2 coecient in this study ensured a satisfactory
adjustment of the quadratic model to the experimental data and more than 85% of the variations in the obtained data can be explained by the suggested math-ematical equations. High R2 values do not necessarily
mean that the formation of TF and TR during black tea manufacture proceeds through the appearance of the same individual intermediates, and are strongly correlated. As given in Table 2, the coecient of variance (CV) for the TF and TR formation and TLC evaluation has been found to be 3.84, 3.10 and 7.35,
Table 3. TF/TR ratios obtained based on each one of the three independant variables used at the selected levels in this study.
TF/TR Ratio
Withering Time (hrs)
Fermentation Duration (min)
Fermentation Temperature (C)
10 15 20 30 90 150 20 25 30 Ref. 0.1214 0.1159 0.1124 0.1101 0.1304 0.1104 0.1164 0.1206 0.1043 Present study
The TF/TR ratios for several popular teas are: 0.0789 for Assam (CTC); 0.0822 for Kenya (CTC);
respectively. The CV, as the ratio of the standard error of estimate to the mean value of the observed response (as a percentage), is a measure of reproducibility of the model and, as a general rule, a model can be considered reasonably reproducible if its CV is not greater than 10%. The adequate precision value is a measure of `signal to noise' and was found to be in the range of 16 to 29, which indicates an adequate signal (see Table 2); a ratio > 4 is desirable. The predicted models can be used to navigate the space dened by the CCD. The experimental results obtained are given in Table 1b and the predicted values for the dependent variables are included in the same table. This would allow an evaluation of the reliability of the empirical models. Moreover, in order to gain a better understanding of the results, the predicted models are presented in Figures 1 to 3, as three-dimensional response surface plots.
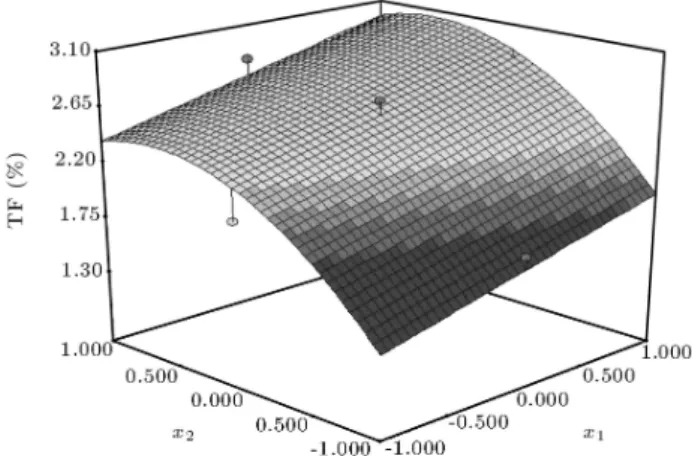
Figure 1. Second-order response surface plot in TF formation. Dependence of yTF on the withering time (x1)
and fermentation duration (x2) is shown (fermentation
temperature, x3= 0).
Figure 2. Second-order response surface plot in TR formation. Dependence of yTRon the withering time (x1)
and fermentation temperature (x3) is shown (fermentation
duration, x2= 0).
Figure 3. Second-order response surface plot in TLC evaluation. Dependence of yTLC on the withering time
(x1) and fermentation duration (x2) is shown
(fermentation temperature, x3= 0).
Response Surface Plotting and Optimization of Black Tea Quality Assessment
For the graphical interpretation of interactions between controllable variables (i.e. joint eect(s) of two or more factors), the use of three-dimensional plots of the regression model is highly recommended [10,11]. Variables giving quadratic and interaction terms with the largest absolute coecients in the tted models were chosen for the axes of the response surface plots to account for the curvature of the surfaces. The 3-D plots obtained from RSM analysis are shown in Figures 1, 2 and 3. Two independent variables; namely, withering time and fermentation duration, were selected for TFs and TLC, while the third remaining variable i.e., temperature of fermentation, had the value that led to the assessment of the black tea quality parameters for TRs formation; the selected variables for the axes were x1and x3. Figure 1 shows that in one axis (the axis was
identied by the withering time, x1) there is a linear
increase in theaavin formation, while in the other axis (the axis was indicated by the fermentation duration, x2) there is an increase in TFs only up to a certain
extent, which decreases thereafter. This indicates that a critical duration of fermentation is involved up to which TF formation is increased, and which is not so after that critical time of fermentation. TFs, as the black tea quality criterion (major contribution to the color of the liquor), decreases during the course of the fermentation [14]. Orange-colored pigments of black tea, TFs, are oxidized products of PPO, the enzyme which catalyzes the condensation of gallocatechin (GC) and a simple catechin. The occurrence of this bio-chemical reaction results in the formation of a avanol with a benzotropolone ring system [15]. There are four main TFs and the amount of each individual TF varies with the clones [5]. Therefore, the TF compositional variations, due to country of origin, could also be
related to climatic and genetic variations, while the fermentation duration always plays a key role in the process [15]. It is not known whether the pattern of TF distribution is genetically controlled and is stable under the dierent environment/growing conditions [16]. The degree of wither is also important to the activity of polyphenol oxidase. The lowest level of TF formed (< 0:8%) was with x1 being at about 10-12 hrs and
fermentation duration being (FD 30) min. TF levels ranged between 0.9-1% when withering time increased to 15-18 hrs with FD at about 70 min. The highest levels of TF formation ( 1:25%) was at x1= 19 20
hrs, when FD = 90-100 min. The statistical analysis of results obtained by the work reported elsewhere, using dierent clones, showed that the longer the wither time, the lower the TF levels. In that study, the withering condition was under hot and dry atmospheres (36C
dry bulb and 18C wet bulb), while the tea leaves were
macerated using the CTC method. In experimental design it is important to plan the experiment(s) in advance and treat data according to a pre-determined logical order. An experimental design has not been used in the work of other researchers assessing black tea quality parameters [6]. The relationship between total TFs and individual theaavins has been studied for Kenyan black tea [17]. The levels of all individual TFs did not necessarily correlate well with total TFs. Based on the results, the authors concluded that higher levels of total TFs are likely to have a high content of theaavin monogallates.
The decreasing trend of the enzyme activity during withering and also the mechanical injury of the fresh tea leaves is a serious problem, while the need to control the moisture content of green leaves has also been emphasized [17,18]. The increase of enzyme activity at the rolling stage is found to be due to the occurrence of biochemical events in the tea leaves such as the release of PPO, because of the gradual dissolution of the chloroplast membrane. Although, increased level of enzyme activity at the beginning of the fermentation is quite possible, but the activity decreases as the fermentation proceeds. In a separate study the optimum fermentation time for Turkish black tea was found to be related to the time of the formation of colored tea pigments when a combination of orthodox, rotorvane and orthodox systems was used. The TF content as the sole criterion of the tea characteristics, was used for the quality determination [19]. With two leaves and a bud, the TF content was at the highest level while decrease in TF levels due to the additional leaves was suggested to be related to lower levels of polyphenols and PPO activity although the enzyme activity was not measured in that work.
The response surface plot of thearubigin forma-tion as a funcforma-tion of withering time and fermentaforma-tion
temperature is shown in Figure 2. The plot shows a uctuating nature; the levels of TR formation at about 7-8% correspond to a withering time of less than 12 hrs, while the temperature of fermentation was in about the investigated range (20-30C). When
withering time rises to 15 hrs, the TR content increases to about 9.5%, considering the same range for the x3
variable. The highest amount of TR as a small fraction was about 11:47% and occurred when the withering interval was about 16-20 hrs and the temperature range for fermentation was about 28-30C (see Figure 2).
The TR content for Kenyan black tea ranged from (%) 4.8 to 19 and the authors [4] found that a rise in the levels of the total TR within 10-20 hrs wither was less than that found within 20-35 hrs of withering time. In the present study, the gradual increase in the TR levels at 10-14 hrs of withering time and at the range of fermentation temperature investigated (20
-30C) was noticeable (see Figure 2). The rise in
TR content at 11:47% was minor and related to the narrower range(s) of the withering interval (16-20 hrs) and the fermentation temperature (28-30C).
Statistical analysis of the results reported by other researchers showed that the thearubigins reduced black tea brightness scores and, as the authors pointed out, the results of those spectrophotometric measurements were in agreement with the brightness results obtained through sensory evaluation studies [6]. The work of the other researchers shows that in the production of bright black teas, cultivars need to be selected with a potential of leading to low TR levels [6,17]. The use of TF formation as a way of predicting optimum fermentation conditions has been found to be unsatisfactory for some black tea, since the presence of other chemical components in black tea are also important in the tea quality assessment [15]. Though the levels of TFs and TRs (on a dry weight basis) are dierent ranging from 0.3-2% and 10-20%, respectively, both of these phenolic pigments together contribute to tea brew characteristics such as color, strength and body [5]. The extensive work of other researchers [20,21] on the eect of tea variety on the avonoid content of black tea, with emphasis on TF and TR content, showed that Assam and Kenya (both Indian-hybrid teas) had higher levels of TF as compared to that of other black teas. The CTC method of rolling was used for the above named varieties, whereas for China and Darjeeling varieties with a conventional method of rolling, the teas had the lowest TFs. In the present study, the values of TF and TR in the form of ratios are given in Table 3. The lowest level of the TF/TR ratio was for 20 hrs as the withering time, 150 min as the fermentation duration and 30C as the fermentation temperature;
although the ratio was > 0:1 in all the experiments. The TF/TR ratios for those black teas produced by the conventional method of rolling were low about 0.035 to
0.037 (Ceylon, China, Darjeeling), while the ratios for the Assam and Kenyan black teas produced by using the CTC method of rolling were high about 0.08 [20]. In the present work, the ratio of TF/TR was more comparable to the ratio obtained for teas processed by CTC, when the conventional type of process has been used.
Figure 3 shows the predicted dependence of the TLC spectrophotometric evaluation (%) on the fermen-tation duration and temperature when the withering time was kept constant at 15 hrs. The response surface plot for the TLC is shown in Figure 3. It shows that the highest level of TLC measurement at about 2.76% corresponded to the fermentation duration of between 100-140 min, while the withering time was at about 15-20 hrs. A statistical analysis of the results obtained on Kenyan black tea showed that TF and TR content accounted for 90% of the variations of TLC measured spectrophotometrically, although the coecients of TF and TR were positive and negative, respectively [6]. The authors pointed out that in order to study the contribution of TR to TLC evaluation, it is important to fractionate TR. Two fractions of it, namely TRSI and TRSII, have been found to play key role(s) in assessing TLC. Moreover, TF, TRSI and TRSII together could give a better prediction of liquor brightness than TF and total TR alone [6].
The concept of using a composition of green tea leaves in predicting black tea quality has been extended and the possible role of the ratio of gallated to non-gallated avan-3-ols in the quality of Kenyan plain black tea has been studied [17,22]. The avan-3-ols are the major avonoid class in tea [20,21]. High amounts of theaavin digallate equivalent to low levels of TR and the scores of brightness lead to increased levels of the sensory evaluation. Based on the results obtained, the authors suggested that an amount of some fractions of avan-3-ol present in the green tea leaf could be used to predict black tea quality [21]. For clone 100 used in the present work, more systematic approaches are needed to study not only the avonoid content of the green tea leaf, but also the pattern of the avan 3-ols distribution. The need for establishing a database for monitoring the quality of Iranian grown and produced black tea is thus emphasized.
CONCLUSIONS
The eect of some processing conditions during black tea manufacture on assessment of the quality param-eters of tea was studied, using a central composite design experiment. The RSM was used aiming to extend our knowledge of the optimization process for black tea manufacture. The results obtained in this work show that the statistical design of the experiment can be an interesting approach and a useful tool, not
only in optimizing the tea fermentation process, but also in explaining qualitatively and quantitatively the fermentation behavior of tea leaves of the clone 100 used in this work, employing the conventional rolling stage. This approach might be useful in providing an acceptable quality of tea in Iranian and international markets.
ACKNOWLEDGMENT
The authors sincerely thank the valuable assistance of Alireza Monazzami, director of the Computer Center of the Chemical Engineering Department.
REFERENCES
1. Angayarkanni, J., Palanis Wamy, M., Mrugesan, S. and Swaminathan, K. \Improvement of tea leaves fermentation with Aspergillus spp. Pectinase", J. Bio-science and Bioengineering, 94(4), pp. 299-303 (2002). 2. Finger, A. \In vitro studies on the eect of polyphe-noloxidase on the formation of polyphenolic black tea constituents", J. Sci. Food Agric, 66, pp. 293-305 (1994).
3. Haslam, E. \Thoughts on thearubigins", Phytochem-istry, 64, pp. 61-73 (2003).
4. Bhattacharyya, N., Seth, S., Tuda, B., Tamuly, P., Jana, A., Ghosh, D., Bandyapadhyay, R., Bhuyan, M. and Sabhapandit, S. \Detection of optimum fermen-tation time for black tea manufacture using electronic nose", Sensors and Actuators B- Chemical, 122(2), pp. 627-634 (2006).
5. Wang, H., Provan, G. and Helliwell, K. \Tea avonids: Their functions, utilization and analysis", Trends in Food Science and Technology, 11, pp. 152-160 (2000). 6. Obanda, M., Owuor, P., Mangoka, R. and Kevoi, M. \Changes in theaoubigin fractions and theaavin levels due to variations in processing conditions and their inuence on black tea liquor brightness and total colour", Food Chemistry, 85, pp. 163-173 (2004). 7. Anonymous, Shargh Daily Newspaper, (an article
pre-sented about the status of Iran's tea industry) (Aug. 2005).
8. Vyas, D. and Kumar, S. \Tea (Camellia sinensis (L.) O. Kuntze) clone with lower period of winter dormancy exhibit lesser cellular damage in response to low temperature", Plant physiology and Biochemistry, 43, pp. 383-388 (2005).
9. Lapin, L.L., Modern Engineering Statistics, Belmont, CA, USA, Wardsworth Publishing Company (ISBN 0-534-50883-9) (1997).
10. Vining, G.G., Statistical Methods for Engineers, Duxburg Press, An International Thomason Publish-ing, Europ, London 1V7AA (2003).
11. Mason, R.L., Gunst, R.F. and Hess, J.J., Statistical Design and Analysis of Experiments-with Applications
to Engineering and Science, John Wiley and Sons Inc., Hoboken, New Jersey, An International Thomason Publishing, Europe, London 1V7AA (2003).
12. Ahmadi, M., Vahabzadeh, F., Bonakdarpour, B., Mofarrah, E. and Mehranian, M. \Application of the central composite design and response surface methodology to the advanced treatment of olive oil processing wastewater using Fenton's peroxidation", J. Hazardous Materials, 123(1-3), pp. 187-195 (2005). 13. Parajo, J.C., Alonso, J.L., Lage, M.A. and Vazquez, D.
\Empirical modeling of eucalyptus wood processing", Bioprocess Engineering, 8, pp. 129-136 (1992). 14. Opie, S., Robertson, A. and Cliord, N. \Black tea
thearubigins-their HPLC separation and preparation during in-vitro oxidation", J. Sci. Food Agric., 50, pp. 247-561 (1990).
15. Owuor, P. and McDowell, I. \Changes in theaavin composition and astringency during black tea fermen-tation", Food Chemistry, 51, pp. 251-254 (1994). 16. Owuor, P. and Obanda, M. \Clonal variation in
the individual theaavin levels and their impact on astringency and sensory evaluation", Food Chemistry, 54, pp. 273-277 (1995).
17. Owuor, P. and Obanda, M. \The use of green tea (Camellia sinensis) leaf avan-3-ol composition in predicting plain black tea quality potential", Food
Chemistry, doi: 10.1016/j. food chem. 2005. 10.030 (2006).
18. Ravichandran, R. and Parthiban, R. \Changes in en-zyme activities (polyphenol oxidase and phenylalanine ammonia lyase) with type of tea leaf and during black tea manufacture and the eect of enzyme supplemen-tation of dhool on black tea quality", Food Chemistry, 62(3), pp. 277-281 (1998).
19. Tufekci, M. and Guner, S. \The determination of optimum fermentation line in Turkish black tea man-ufacture", Food Chemistry, 60(1), pp. 53-56 (1997). 20. Peterson, J., Dwyer, J., Jacques, P., Rand, W., Prior,
R. and Chui, K. \Tea variety and brewing techniques inuence avonoid content of black tea", J. Food Composition and Analysis, 17, pp. 397-405 (2004). 21. Peterson, J., Dwyer, J., Bhagwat, S., Haytowitz, D.,
Holden, J., Eldridge, A., Beecher, G. and Aladesanmi, J. \Major avonoids in dry tea", J. Food Composition and Analysis, 18, pp. 487-501 (2005).
22. Owuor, P., Obanda, M., Nyirenda, H., Mphangwe, N., Wright, L. and Apostolides, Z. \The relationship between some chemical parameters and sensory evalu-ations for plain black tea (Camellia sinensis) produced in Kenya and position with similar teas from Malawi and South Africa", Food Chemistry, 97(4), pp. 644-653 (2006).