https://doi.org/10.5194/acp-17-9019-2017 © Author(s) 2017. This work is distributed under the Creative Commons Attribution 3.0 License.
Estimation of bubble-mediated air–sea gas exchange from
concurrent DMS and CO
2
transfer velocities at
intermediate–high wind speeds
Thomas G. Bell1, Sebastian Landwehr2, Scott D. Miller3, Warren J. de Bruyn4, Adrian H. Callaghan5,a, Brian Scanlon2, Brian Ward2, Mingxi Yang1, and Eric S. Saltzman6
1Plymouth Marine Laboratory, Prospect Place, The Hoe, Plymouth, PL1 3DH, UK 2School of Physics, National University of Ireland, Galway, Ireland
3Atmospheric Sciences Research Center, State University of New York at Albany, NY, USA 4Schmid College of Science and Technology, Chapman University, Orange, California, CA, USA
5Scripps Institution of Oceanography, University of California San Diego, 9500 Gilman Drive, La Jolla, CA 92093, USA 6Department of Earth System Science, University of California, Irvine, CA, USA
anow at: Department of Civil and Environmental Engineering, Imperial College London, South Kensington Campus, London, SW7 2AZ, UK
Correspondence to:Thomas G. Bell ([email protected])
Received: 30 January 2017 – Discussion started: 9 February 2017
Revised: 7 June 2017 – Accepted: 28 June 2017 – Published: 27 July 2017
Abstract. Simultaneous air–sea fluxes and concentration differences of dimethylsulfide (DMS) and carbon dioxide (CO2)were measured during a summertime North Atlantic cruise in 2011. This data set reveals significant differences between the gas transfer velocities of these two gases (1kw) over a range of wind speeds up to 21 m s−1. These differences occur at and above the approximate wind speed threshold when waves begin breaking. Whitecap fraction (a proxy for bubbles) was also measured and has a positive relationship with1kw, consistent with enhanced bubble-mediated trans-fer of the less soluble CO2relative to that of the more sol-uble DMS. However, the correlation of 1kw with whitecap fraction is no stronger than with wind speed. Models used to estimate bubble-mediated transfer from in situ whitecap fraction underpredict the observations, particularly at inter-mediate wind speeds. Examining the differences between gas transfer velocities of gases with different solubilities is a use-ful way to detect the impact of bubble-mediated exchange. More simultaneous gas transfer measurements of different solubility gases across a wide range of oceanic conditions are needed to understand the factors controlling the magni-tude and scaling of bubble-mediated gas exchange.
1 Introduction
Air–sea exchange is a significant process for many com-pounds that have biogeochemical and climatic importance. Approximately 25 % of the carbon dioxide (CO2)released into the atmosphere by anthropogenic activities has been taken up by the world oceans, which has tempered its cli-mate forcing while leading to ocean acidification (Le Quéré et al., 2015). The biogenic gas dimethylsulfide (DMS) is a major contributor to the mass of marine atmospheric aerosol (Virkkula et al., 2006). Volatile organic compounds (VOCs) such as isoprene, acetone and acetaldehyde alter the oxidis-ing capacity of the troposphere (Carpenter et al., 2012). The solubility differences between these VOCs mean that their exchange is controlled to differing degrees by processes on the water and air side of the air–sea interface (Yang et al., 2014). Many of the factors influencing air–sea gas exchange will be altered by future changes in climate, ocean circula-tion and biology. Earth system models and air quality mod-els require more accurate understanding of the processes that influence air–sea gas transfer.
Air–sea gas exchange is typically parameterised as a func-tion of the ocean–atmosphere bulk concentrafunc-tion difference (1C)and the physical mixing induced by wind stress at the
interface (Liss and Slater, 1974). The air–sea flux is typically described using the expression
Flux=K(Cw−αCa), (1)
whereCwandCaare the trace gas bulk concentration on ei-ther side of the interface, α is the dimensionless water/air solubility of the gas in seawater andKis the gas transfer ve-locity. The physics of gas transfer are implicitly represented by the gas transfer velocity, which is commonly expressed in water-side units of velocity (cm h−1)and parameterised as a function of wind speed (U10)and Schmidt number (Sc). The simplicity of Eq. (1) belies the complexity of the pro-cesses involved in air–sea gas transfer. These propro-cesses in-clude diffusion, surface renewal and bubble-mediated trans-port. In turn, turbulence can be generated by wind stress, wave-induced mixing, buoyancy, currents and wave break-ing. A variety of theoretical, laboratory and field approaches have been used to study the processes that control air–sea transfer, but we do not yet have a firm understanding of their relative importance under a range of atmospheric and oceanic conditions.
The gas-transfer–wind-speed relationships for gases of different solubility may be affected by breaking waves and bubbles (Keeling, 1993; Woolf, 1993, 1997). Gas invasion and evasion via bubbles (kbub)is sensitive to the void frac-tion (ratio of air volume to total volume) of the bubble plume as well as the bubble size distribution. Bubble injection depth and cleanliness of the surface (influenced by surfactants) af-fect bubble rise velocity and residence time. Bubble resi-dence time determines the time available for equilibration to occur while bubble volume, pressure and gas diffusivity (Sc) govern the time needed for a bubble to equilibrate. The magnitude of kbub is expected to be greater for sparingly soluble gases (e.g. CO2, dimensionless solubility∼1) than for more soluble gases such as DMS (dimensionless solubil-ity ∼15), particularly when bubbles are fully equilibrated. Bubble-mediated gas transfer has been studied in the labora-tory (Asher et al., 1996; Rhee et al., 2007) and using models (e.g. Woolf, 2005; Woolf et al., 2007; Fairall et al., 2011; Goddijn-Murphy et al., 2016).
Deliberate, dual-tracer techniques have estimated gas transfer by measuring the evasion of a pair of sparingly solu-ble gases with different diffusivity (3He and SF6, dimension-less solubility≤0.01). These studies observed a non-linear wind speed dependence of the gas transfer velocity, in qual-itative agreement with earlier studies in wind–wave tanks (e.g. Wanninkhof et al., 1985; Liss and Merlivat, 1986; Wat-son et al., 1991). Direct, shipboard measurements of water-side gas transfer have also been made by eddy covariance (e.g. McGillis et al., 2001; Huebert et al., 2004; Marandino et al., 2007; Miller et al., 2010; Bell et al., 2013). These measurements typically show DMS gas transfer velocities that are lower and exhibit more linear wind speed depen-dence than the CO2 transfer velocity–wind speed relation-ship inferred from dual-tracer studies (e.g. Yang et al., 2011;
Goddijn-Murphy et al., 2012; Bell et al., 2015). It has been suggested that the difference between the open-ocean gas transfer velocities of CO2and DMS is due to the reduced im-portance of bubble-mediated exchange for DMS (Blomquist et al., 2006; Fairall et al., 2011; Goddijn-Murphy et al., 2016).
Only one set of concurrent CO2and DMS gas transfer ve-locity measurements have been published to date (Miller et al., 2009). In that study, no data were collected for winds greater than 10 m s−1and no statistically significant differ-ence was observed in the CO2and DMS gas transfer–wind speed relationships after normalising both gases to a com-mon diffusivity. This study presents a more extensive set of CO2and DMS gas transfer velocities that were measured si-multaneously aboard the R/VKnorrin the 2011 summertime North Atlantic in both oligotrophic and highly productive waters. The DMS gas transfer velocities are discussed sep-arately in detail by Bell et al. (2013). Here we focus specif-ically on what can be learned about gas transfer from the differences in behaviour of two different solubility gases at intermediate and high wind speeds.
2 Methods
2.1 Seawater, atmospheric and flux measurement systems
The measurement setups for DMS and CO2 concentrations in air and water and the eddy covariance flux systems have been discussed in detail elsewhere (Miller et al., 2008; Saltz-man et al., 2009; Miller et al., 2010; Bell et al., 2013, 2015; Landwehr et al., 2014; Landwehr et al., 2015). We provide a summary plus some additional details in the Appendix.
2.2 Gas transfer velocity calculations
In this section we describe the calculation of DMS and CO2 gas transfer velocities from the Knorr_11 cruise data. Mea-sured gas transfer velocities are transformed into water-side-only gas transfer velocities in order to remove the influence of air-side resistance. The relative contribution of air-side re-sistance to the total rere-sistance is a function of solubility and thus different for the two gases. Finally, we discuss the most appropriate approach for comparing the water-side gas trans-fer velocities, given that the two gases have diftrans-ferent molec-ular diffusivity and solubility.
Total gas transfer velocities (K)are calculated for CO2 and DMS for each 10 min flux interval of the Knorr_11 cruise using Eq. (1). The temperature-dependent dimensionless sol-ubilities of CO2and DMS in seawater are calculated follow-ing Weiss (1974) and Dacey et al. (1984) respectively. These gas transfer velocities reflect the result of resistance on both sides of the interface (Liss and Slater, 1974). The water-side
contribution to the total resistance is determined as follows:
kw= 1 K− α ka −1 , (2)
wherekw andkaare the air-side and water-side gas transfer velocities and αis dimensionless water/air solubility. Note that we use the αreported by Dacey et al. (1984) in these calculations rather than the Henry law constant (H, units of atm L mol−1)as there appears to be an error in conversion betweenαandH in that study (see Supplement discussion). CO2 solubility is sufficiently low that air-side resistance is negligible and the water-side gas transfer is assumed equal to the total transfer velocity (kCO2 =KCO2). The air-side
re-sistance for DMS needs to be accounted for because it is a moderately soluble gas (McGillis et al., 2000). Air-side gas transfer velocities (ka) for DMS were calculated for each 10 min flux interval with the NOAA COAREG 3.1 model, us-ing sea surface temperature (SST) and horizontal wind speed measured during the cruise. The NOAA COAREG 3.1 model (Fairall et al., 2011) is an extension of the COARE bulk pa-rameterisation for air–sea energy and momentum fluxes to parameterise gas transfer (Fairall et al., 1996, 2000). The air-side resistance contributes about 5 % on average to the total resistance for DMS. NOAA COAREG 3.1 model cal-culations were carried out using a turbulent/molecular co-efficient,A=1.6, and bubble-mediated coefficient,B=1.8 (Fairall et al., 2011). Knorr_11 measurements of SST, air temperature, relative humidity, air pressure, downward radi-ation and wind speed were used as input parameters to the model. Note that the use of the COAREG 3.1 model intro-duces a small uncertainty in our estimates of water-side DMS gas transfer velocity (approximately±2 % when wind speed =20 m s−1).
To facilitate comparison of transfer coefficients for the two gases across a range of sea surface temperatures, gas trans-fer velocities are corrected for changes in molecular diffusiv-ity and viscosdiffusiv-ity. The correction typically involves the nor-malisation of water-side gas transfer velocities to a common Schmidt number (Sc=660), equivalent to CO2in seawater at 20◦C:
kX,660=kX· 660
ScX −0.5
, (3)
where subscript X refers to CO2 or DMS (i.e. kDMS,660 and kCO2,660). Temperature-dependent ScCO2 and ScDMS
were obtained using the in situ seawater temperature from the ship’s bow sensor and parameterisations from Wan-ninkhof (1992) and Saltzman et al. (1993).
The Scnumber normalisation (Eq. 3) is commonly used across the whole range of wind speeds. In fact, it is only appropriate at low or moderate winds when interfacial gas transfer dominates over bubble-mediated gas exchange. If bubbles are an important component of gas transfer then sol-ubility also plays a role and normalisation based onScalone may not be sufficient.
To develop a more rigorous comparison ofkDMSandkCO2,
we normalised the water-side transfer velocities of DMS to the Schmidt number of CO2at the in situ sea surface temper-ature of each 10 min flux interval, as follows:
kDMS,Sc=kDMS·
Sc
CO2
ScDMS −0.5
, (4)
whereScCO2 andScDMS are the Schmidt numbers of CO2
and DMS at the in situ sea surface temperature. Compared to normalising both DMS and CO2toSc=660, this approach has the advantage of correcting onlykDMS, with no correc-tion tokCO2. TheSccorrection for DMS should be reason-ably accurate, assuming that the bubble-mediated transfer for the more soluble DMS is relatively small.
On the Knorr_11 cruise, the variability in sea surface tem-perature was small (1σ= ±1◦C). As a result, there is little difference in the variability or wind speed dependence ofSc -correctedkCO2 compared tokCO2 at the in situ temperature (Fig. 5 vs. Fig. S5 in Supplement). In Sect. 3.4, the relation-ship between CO2and DMS gas transfer velocities and wind speed is examined usingkDMS,ScandkCO2.
2.3 Calculation ofkbub,CO2
The flux of a water-side controlled gas is equal to the sum of the interfacial flux and the bubble-mediated flux. For gases with significant air–sea disequilibrium these processes are often considered as parallel transfer velocities, i.e. total trans-fer velocitykw=kint+kbub. See Woolf (1997) for a more complete discussion of bubble-mediated transfer for gases close to ocean–atmosphere equilibrium. We assume that tur-bulence and diffusive mixing at the sea surface operate sim-ilarly upon the interfacial air–sea transfer of CO2and DMS (i.e.kint,CO2=kint,DMS), given appropriate normalisation for
the differences in molecular diffusivity. Observed differences betweenkDMS,ScandkCO2 should therefore be a measure of
the difference between the bubble-mediated contributions to DMS and CO2gas transfer:
1kw=kbub,CO2−kbub,DMS. (5)
Strictly speaking, Eq. (5) should also account for the influ-ence of bubble overpressure, which alters the gas flux due to bubbles when the concentration gradient is into the ocean. The extra pressure on the gas in the bubbles is calculated following Woolf (1997):1=(U10/Ui)2% whereUi is the wind speed at which the supersaturation of a particular gas equals 1 % (49 m s−1in the case of CO
2). A high wind speed (20 m s−1)gives1=0.167 %, which would lead to only a ∼2 % enhancement of the CO2flux when the air–sea con-centration gradient is 30 ppm (minimum for this study) and into the ocean. The magnitude of this effect would be larger for gases less soluble than CO2but we are able to ignore it for the purposes of this study.
kbub,CO2 andkbub,DMSare related by the influence of
pa-rameterise this relationship simply askbub,DMS=f kbub,CO2.
Substitution into Eq. (5) yields
kbub,CO2=
1kw
1−f. (6)
The value of f depends on seawater temperature and the complex dynamics of bubble formation and cycling (size dis-tributions, surfactants, etc.). At the mean SST encountered in this study (9.8◦C), the bubble gas transfer models of Woolf (1997) and Asher (Asher and Wanninkhof, 1998; Asher et al., 2002) yield values forf of 0.14 and 0.28, respectively (see Supplement for model equations).
2.4 Sea surface imaging
Whitecap areal fraction was measured using images of the sea surface recorded with a digital camera (5-megapixel Are-cont Vision, 16 mm focal length lens) mounted 14.6 m above the ocean surface at an angle of∼75◦from the nadir. Image footprints represent∼7600 m2of sea surface. Images were collected at a sample interval of about 1 s and post-processed for whitecap fraction according to the automated whitecap extraction algorithm method (Callaghan and White, 2009). More detail on the methodology, camera exposure settings and data comparability are provided in the Supplement. Im-ages were further processed to distinguish whitecap pixels as either stage A or stage B whitecaps by applying a spatial separation technique (Scanlon and Ward, 2013). The white-cap fraction measurements were averaged in the same way as the gas transfer velocities (i.e. time-averaged mean values as well as 2 m s−1wind speed bins).
3 Results
3.1 Cruise location and environmental conditions
This study took place in the summertime North Atlantic (24 June–18 July 2011; DOY 175–199), departing and returning to Woods Hole, MA. Most of the data were collected north of 50◦N, including the occupation of four 24–36 h stations – ST181, ST184, ST187 and ST191 (Fig. 1). The cruise track was designed to sample regions with high biological produc-tivity and phytoplankton blooms, with large air–sea concen-tration differences for CO2and DMS. The cruise meteorol-ogy and physical oceanography is discussed in detail by Bell et al. (2013). A series of weather systems travelling from West to East passed over the region during the cruise. Wind speeds ranged from ∼1 to 22 m s−1, with strongest winds during the frontal passages at stations ST184 and ST191 (Fig. 1b). Atmospheric boundary layer stability was close to neutral for most of the cruise (|z/L|r< 0.07; 75 % of the time), with infrequent stable conditions (z/L> 0.05; < 8 % of the time, Fig. 1a). There was no evidence that the stable peri-ods affected the flux measurements (Bell et al., 2013).
White-cap areal fraction increased up to a maximum of∼0.06 in response to high wind speeds (Fig. 1b).
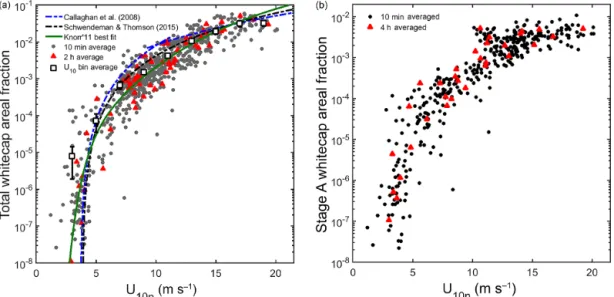
3.2 Whitecaps
Whitecaps were observed during Knorr_11 when wind speeds exceeded 4.5 m s−1, a typical wind speed thresh-old for whitecap formation in the open ocean (Callaghan et al., 2008; Schwendeman and Thomson, 2015). White-cap areal fraction is a strong, non-linear function of wind speed (Fig. 2a). The whitecap vs. wind speed relationship for Knorr_11 is similar in shape to recently published wind-speed-based whitecap parameterisations (Callaghan et al., 2008; Schwendeman and Thomson, 2015). At intermedi-ate wind speeds the Knorr_11 whitecap data are lower than the parameterisations (Fig. 2a). Total whitecap coverage is a function of (i) active “stage A whitecaps” (WA)produced from recent wave breaking and (ii) maturing “stage B white-caps” (WB)that are decaying foam from previous breakers. The Stage A whitecap fraction data are highly variable at ∼11 m s−1wind speeds (Fig. 2b), which is driven by the dif-ference in the wind–wave conditions during Knorr_11 (see discussion in Supplement).
3.3 Concentrations, fluxes and gas transfer velocities
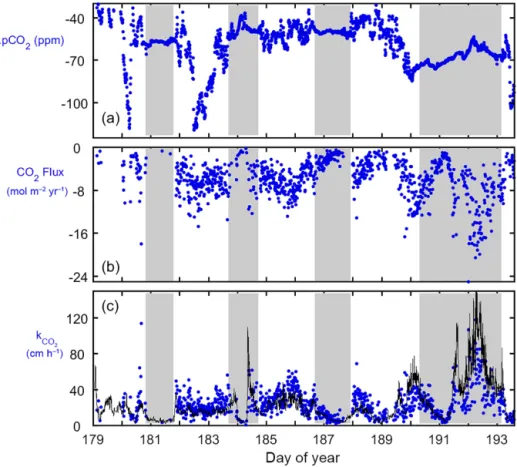
Seawater pCO2 was consistently lower than the overlying atmosphere throughout the study region due to biological uptake (Fig. 3a). As a result, the air–sea concentration dif-ference (1pCO2)was large and always into the ocean, with
1pCO2<−45 ppm for more than 80 % of the measurements. Periods with particularly enhanced 1pCO2 into the ocean were during the transit between ST181 and ST184 (1pCO2 as large as−120 ppm) and during ST191 (1pCO2 consis-tently−75 ppm).
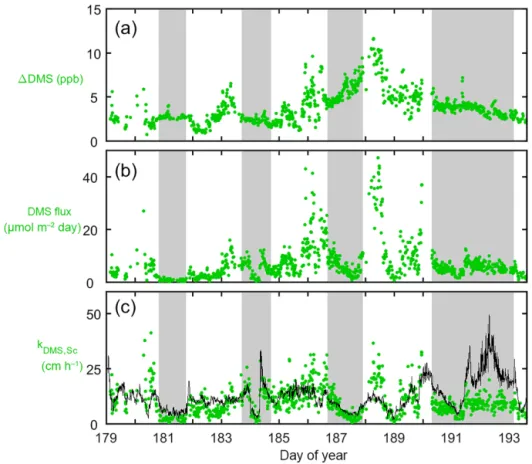
Seawater DMS levels were much higher than atmospheric levels, reflecting the biogenic sources in seawater and the rel-atively short atmospheric lifetime (∼1 day; Kloster et al., 2006). The largest air–sea DMS concentration differences (1DMS) of 6–12 ppb were observed during DOY 185–190 (Fig. 4a). The1DMS and1pCO2 did not co-vary (Spear-manρ=0.11,n=918,p< 0.001). This is not surprising be-cause, although seawater DMS and CO2signals are both in-fluenced by biological activity, they are controlled by dif-ferent processes. Seawater CO2levels reflect the net result of community photosynthesis and respiration, while DMS production is related to metabolic processes that are highly species-dependent (Stefels et al., 2007).
CO2 fluxes (FCO2)were generally into the ocean, as ex-pected given the direction of the air–sea concentration dif-ference (Fig. 3b). The variability inFCO2 observed on this cruise reflects dependence on both wind speed and1pCO2. For example, during DOY182 air-to-sea CO2fluxes increase due to a gradual increase in1pCO2with fairly constant wind speed. More commonly, 1pCO2 was fairly constant and
Figure 1.Time series of 10 min averaged data collected during the Knorr_11 cruise. Dashed black line in panel(a)indicates neutral at-mospheric stability (z/L=0). Grey shaded regions represent intervals when the ship occupied stations ST181, ST184, ST187, and ST191. Measured wave properties (see Bell et al., 2013) are presented in panels(c)and(d): significant wave heightHs(c)and inverse wave age(d).
U10n/Cp≥1 represent younger seas andU10n/Cp< 1 represent older seas.
Figure 2.Semi-log plots of whitecap areal fraction as a function of mean horizontal wind speed at 10 m above the sea surface (U10n) during the Knorr_11 cruise. 10 min average (grey dots) and 2 h average (red triangles) data are shown on both panels.(a)Total whitecap area (WT)versusU10nbin-averaged data (open squares, 2 m s−1bins). The best fit line to Knorr_11 2 h average data (green; log10(WT)=
−42.19e(−0.95U )−6.5e(−0.0886U ))and wind speed parameterisations from the recent literature are shown for reference.(b)Whitecap area considered to be solely from wave breaking (Stage A whitecaps (WA); see text for definition).
Figure 3.Knorr_11 cruise time series of 10 min averaged CO2:(a)air–sea concentration difference (1pCO2),(b)flux (FCO2)and(c)gas transfer velocity (kCO2; water side only, noSccorrection). Panel(c)also showskCO2calculated using the NOAA COARE model (black line). Note that negativekCO2data points in(c)were omitted for clarity (see Fig. S6 for full data set). Grey shaded regions represent periods on station.
variability inFCO2 reflected changes in wind speed. For ex-ample, from DOY 185 to 187 wind speeds gradually declined from ∼10 to 5 m s−1 with a concurrent decline in F
CO2. DMS eddy covariance fluxes were always out of the ocean. The 10 min averaged DMS fluxes (FDMS)clearly show the influence of 1DMS (e.g. DOY 188) and wind speed (e.g. DOY 184).
Gas transfer velocities of CO2and DMS from this cruise exhibit two systematic differences: (i)kDMSvalues are gen-erally lower thankCO2, particularly during episodes of high
wind speed; and (ii) kCO2 is characterised by much larger
scatter thankDMS. We attribute the large scatter inkCO2to the
greater random uncertainty associated with the eddy covari-ance measurement of air–sea CO2fluxes compared to those of DMS. As shown by Miller et al. (2010), the analytical approach used in this study (dried air, closed path LI7500) has sufficient precision to adequately resolve the turbulent fluctuations in atmospheric CO2associated with the surface flux over most of the cruise (1pCO2<−30 ppm). The scat-ter in the CO2flux measurements is more likely due to envi-ronmental variability resulting from fluctuations in boundary layer CO2 mixing ratio arising from horizontal and/or ver-tical transport unrelated to air–sea flux (Edson et al., 2008;
Blomquist et al., 2014). These effects likely have a much smaller effect on air–sea DMS fluxes, because the air–sea DMS concentration difference is always much larger than the mean atmospheric DMS concentration (due to the short atmospheric lifetime of DMS). For example, a1pCO2 of 100 ppm at a wind speed of 10 m s−1 will produce turbu-lent fluctuations that are∼0.02 % of the background CO2 on average. In contrast, a typical seawater DMS concentra-tion (2.6 nM) at a wind speed of 6 m s−1generates fluctua-tions that are 20 % of the background (Table 1; Blomquist et al., 2012). Thus,FCO2 measurements are highly sensitive to small fluctuations in background CO2and the relative uncer-tainty is expected to be much larger than that forFDMS.
3.4 Comparison ofkCO2 andkDMS,Sc
The differences between CO2and DMS gas transfer veloci-ties observed in the time series are also evident when the data are examined as a function of wind speed. From the 10 min averaged data, it is clear thatkCO2 is greater thankDMSand
has a stronger wind speed dependence over most of the wind speed range (Fig. 5a, b). These broad trends are also easily seen in longer time-averaged data. Flux and 1C
measure-Figure 4.Knorr_11 cruise time series of 10 min averaged DMS:(a)air–sea concentration difference (1DMS),(b)flux (FDMS)and(c)gas transfer velocity normalised to the in situ CO2Scnumber (kDMS,Sc). Panel(c)also showskDMS,Sccalculated using NOAA COARE model output (black line). Grey shaded regions represent periods on station.
ments were averaged into 2 h periods (minimum of three flux intervals per 2 h period), which reduced the scatter inFCO2 while preserving the temporal variability (see Fig. S7). Gas transfer velocities were then recalculated from the 2 h aver-aged data. 10 minkCO2 andkDMS,Scdata were also averaged
into 2 m s−1wind speed bins, with a minimum of five 10 min periods per bin. The 2 h averaged data and the wind speed binned data showkCO2 andkDMS,Scdiverging at
intermedi-ate wind speeds, differing by a factor of roughly 2 at 10 m s−1 (Fig. 5c, d).
DMS gas transfer velocities on this cruise exhibit complex behaviour at intermediate to high wind speeds, as discussed in Bell et al. (2013). kDMS,Sc increases linearly with wind speed up to∼ 11 m s−1(Fig. 5). Under the sustained high-wind, high-wave conditions encountered during ST191, the wind speed dependence ofkDMS,Scwas lower than expected, with a slope roughly half that of the rest of the cruise data. This effect was not observed at ST184 – for detailed discus-sion, see Bell et al. (2013). Such coherent spatial-temporal variation means that wind speed bin averaging of the higher wind speedkDMS,Scmay mask real variability in the relation-ship with wind speed. Relationrelation-ships developed from wind speed bin-averaged gas transfer data should be interpreted
with caution, especially when it comes to developing gener-alisable air–sea gas transfer models.
The Knorr_11 kCO2 data also demonstrate a clear wind
speed dependence (Fig. 5). The NOAA COARE model for CO2 has been tuned to previous eddy covariance flux mea-surements (McGillis et al., 2001), with bubble-mediated transfer determining the non-linear relationship with wind speed (Fairall et al., 2011). There is reasonable agreement between the COARE model gas transfer velocity predictions and the Knorr_11kCO2 data up to ∼11 m s
−1 wind speed. Above 11 m s−1, the COARE model overpredictskCO2. This
could be interpreted as indicating high wind speed suppres-sion of gas transfer for CO2 as observed for DMS (as dis-cussed by Bell et al., 2013). However, it is important to note that the number of high wind speed (> 15 m s−1)gas transfer measurements in this study is limited to 9 and 16 h of data for DMS and CO2 respectively. Much more data are needed in order to firmly establish the high wind speed behaviour.
The COAREG 3.1 model parameterises interfacial gas transfer by scaling toScand friction velocity and estimates bubble-mediated gas transfer following Woolf (1997). The lower solubility of CO2leads to enhanced gas transfer rel-ative to that of DMS at high wind speeds where bubble transport is significant (Fairall et al., 2011). There is good
Figure 5.Gas transfer velocities plotted against mean horizontal wind speed (U10)from the Knorr_11 cruise: 10 min average data for CO2
(a)and DMS(b). DMS gas transfer velocities are normalised to the in situ CO2Scnumber.Data are averaged into 2 h periods(c)and 2 m s−1 wind speed bins(d). Note that negativekCO2data in(a) have not been plotted for clarity (see Fig. S8 for full data set). For reference, the NOAA COAREG3.1 model output for CO2(magenta line) and DMS (green line) is plotted on all four panels. The COARE model was run with the turbulent/molecular coefficient,A=1.6, and the bubble-mediated coefficient,B=1.8, and used mean Knorr_11 data for the input parameters.
agreement between the COAREG model gas transfer veloc-ity predictions and the Knorr_11kCO2 andkDMSdata until
∼11 m s−1wind speed.
Earlier in this paper we introduced the quantity1kwas an observational measure of the difference in gas transfer veloc-ities of CO2and DMS (Sect. 2.3, Eq. 6). The relationship be-tween1kwand wind speed is positive and shows no system-atic differences related to temporal variability (Fig. 6). Sea surface temperature (SST) is indicated by symbol size. Some of the scatter in Fig. 6 could be driven by changes inScdue to SST variability. Nearly all of the data in Fig. 6 are from periods when SST was relatively constant (9.7±1.1◦C). Many of the kCO2 data with warm seawater (i.e. ST181,
SST > 12◦C) were rejected by our quality control criteria (see Appendix A3). These data were collected when wind
speeds were low, which resulted in small CO2 fluxes with large variability at low frequencies. Of the periods with SST > 12◦C that passed the quality control criteria, the majority contributed fewer data within a 2 h averaging period than the minimum threshold (three 10 min averaged data points).
4 Discussion
The bubble-mediated component of gas transfer is a strong function of wind speed and breaking waves. Previous esti-mates of bubble-mediated air–sea gas exchange have used data from laboratory experiments (Keeling, 1993; Asher et al., 1996; Woolf, 1997). The differences between gas trans-fer velocities for DMS and CO2 provide a unique way to constrain the importance of bubble-mediated transfer under
Figure 6.Difference (1kw)between 2 h averagekCO2andkDMS,Sc
plotted againstU10. Data are coloured by the date of measurement (Day of Year). Sea surface temperature (SST) is indicated by sym-bol size (range is 7.1 to 12.5◦C). The solid grey line describes the power law fit to the data (see Eq. 7).
natural conditions. This study shows that1kw is near zero (< 4.5 cm h−1)at low wind speeds (U10≤4.5 m s−1), which is consistent with the wind speed at which whitecap fraction becomes significant (WT> 10−5, Fig. 2a). Above 4.5 m s−1,
1kw increases non-linearly, consistent with an increase in bubble-mediated CO2transfer associated with wave break-ing. The relationship between 1kwand wind speed is non-linear, and a power law wind speed dependence yields a good fit (R2=0.66; Fig. 6):
1kw=0.177U101.928. (7) The functional form of this relationship is qualitatively consistent with those found between U10 and breaking waves/wave energy dissipation (Melville and Matusov, 2002) and U10 vs. whitecap areal fraction (e.g. Callaghan et al., 2008; Schwendeman and Thomson, 2015). Bubble-mediated gas transfer is the only viable explanation for the magnitude and wind speed dependence of1kw. The only alternative ex-planation would require a large systematic bias in the mea-surement of relative gas transfer velocities of DMS and CO2. There are no obvious candidates for such biases.
During strong wind/large wave conditions, the Knorr_11 data suggest that bubble-mediated exchange is a dominant contributor to the total transfer of CO2. For example, when wind speeds were 11–12 m s−1,1k
w was about 50 % of the total CO2gas transfer (kCO2). A significant contribution by
bubbles to the total gas transfer velocity means that bubble-mediated exchange must be included and adequately param-eterised by gas transfer models. The Schmidt number (Sc) normalisation (Eq. 4) assumes that the gas transfer velocity is purely interfacial. An alternative normalisation (involvingSc and solubility) is required when bubble-mediated transfer is significant. Our data suggest that the currentScnormalisation
Figure 7.Knorr_111kwdata plotted against total whitecap areal fraction(a)and against Stage A whitecap areal fraction(b). Each point is a 2 h average of coincident measurements of whitecap frac-tion and DMS and CO2gas transfer.
should be applied with caution to gas transfer data for differ-ent solubility gases at wind speeds greater than 10 m s−1.
If 1kw reflects the difference between the bubble-mediated contribution to the transfer of CO2 and DMS, one would expect1kwto correlate with wave-breaking, and hence with the areal coverage of whitecaps. Breaking waves generate plumes of bubbles (Stage A whitecaps,WA), which then rise to the surface and persist for a short period as foam (Stage B whitecaps,WB). Almost all whitecap mea-surements represent the fraction of the sea surface that is cov-ered by bubble plumes and/or foam – i.e.WT=WA+WB. The1kw is positively correlated with bothWT (Spearman
ρ=0.65, n=43, p< 0.001) and WA (Spearman ρ=0.74,
n=32,p< 0.001; Fig. 7a, b). These correlations are approx-imately the same strength as the correlation between1kw and wind speed (Spearmanρ=0.73,n=88,p< 0.001). The functional form of the relationship between1kwand white-cap areal extent appears to be linear forWT> 0.005. How-ever, the Knorr_11 data set is small and quite scattered, par-ticularly whenWT< 0.005. More data are required to fully test the validity of whitecap areal fraction as a proxy for bub-bles and bubble-mediated exchange.
Observations of the decaying white cap signal (WB) sug-gest that the persistence of surface foam is related to both bubble plume depth (deeper bubble plumes take longer to degas) and sea surface chemistry (Callaghan et al., 2013). As measured here,WBis approximately an order of magnitude larger thanWA and thus dominates theWT signal. It is of-ten assumed that gas exchange takes place in bubble plumes formed by active wave breaking (i.e.WA), while WB may vary widely due to surfactant concentration with little or no impact upon bubble-mediated gas exchange (e.g. Pereira et al., 2016). In this case,1kwshould be more strongly corre-lated withWA than WBor WT. The Knorr_11 data do not suggest thatWAis an improvement upon eitherWT or even wind speed as a measure of bubble-mediated exchange. This may be because whitecaps do not fully represent the bub-bles facilitating gas exchange as these may dissolve before
Figure 8.Bubble-mediated transfer velocity of CO2(kbub,CO2)as
a function of wind speed. Individual points are Knorr_11 obser-vations using solubility and diffusivity scaling from Woolf (1997) (black squares) and Asher et al. (2002) (red circles). Continuous lines are model calculations ofkbub,CO2 using the Knorr_11 wind
speed versus whitecap areal fraction relationship (see Fig. 2) and mean SST (Woolf, 1997: black; Asher et al., 2002: red). Model cal-culations were also performed using the Schwendeman and Thom-son (2015) wind speed versus whitecap areal fraction relationship (dashed lines).
they reach the sea surface. Alternatively,WTandWAmay be equally good (or poor) proxies for bubbles because: (i) sur-factant activity was either insignificant or sufficiently invari-ant in the study region (despite high biological productivity) thatWBdoes not confound the relationship betweenWTand
WA; (ii)WAis no better thanWTat representing the volume of air entrained by breaking waves; and/or (iii) bubbles re-siding at the surface (i.e.WB)continue to contribute to gas transfer (Goddijn-Murphy et al., 2016).
As shown earlier, the bubble-mediated contribution to gas transfer (kbub,CO2) can be obtained from1kw using
infor-mation from mechanistic bubble gas transfer models (f; see Sect. 2.3). Thekbub,CO2data sets derived from the Knorr_11
data using the Asher (Asher and Wanninkhof, 1998; Asher et al., 2002) and Woolf (1997) models differ by about 15 % (Fig. 8). The field-based estimates of kbub,CO2 can also be
compared to model-only estimates for the Knorr_11 con-ditions using the Asher and Woolf models. Both models are based on total whitecap areal fraction, WT. A non-linear fit of the Knorr_11 WT and wind speed measure-ments (WT=1.9×10⁻⁶U10n3.36)was used to drive both mod-els (Fig. 8). The Asher et al. (2002) model is based on labo-ratory tipping bucket gas evasion experiments (Asher et al., 1996) and the model was then adjusted to represent the flux of CO2into the ocean (invasion). Woolf (1997) scaled a sin-gle bubble model to the open ocean based on laboratory ex-periments.
Both models significantly underestimatekbub,CO2 at wind
speeds below about 11 m s−1. At higher wind speeds, the Asher et al. (2002) model increases rapidly with wind speed to agree better with the Knorr_11 data. In contrast, Woolf (1997) consistently underestimates kbub,CO2 at all
wind speeds. Both kbub,CO2 models depend on the choice
of wind speed versus whitecap parameterisation. Using the Schwendeman and Thomson (2015) whitecap parameterisa-tion instead of the Knorr_11 best fit makes some difference to the model output, but not enough to adequately fit to the data (Fig. 8). A “dense plume model” was also developed by Woolf et al. (2007) to take account of the interaction of a bubble plume with the interstitial water between bubbles. This model yields estimates ofkbub,CO2 that are even lower
than the original Woolf (1997) “single bubble model” (data not shown).
It is likely that the Knorr_11 cruise data will be com-pared with estimates of kbub,CO2 derived from future field
campaigns, which will be conducted under different envi-ronmental conditions. Our kbub,CO2 data are at in situ
sea-water temperature (∼10◦C) and thus in situ CO2 solubil-ity (α=1.03) and diffusivity (Sc=1150). We use the Asher et al. (2002) and Woolf (1997) bubble models to make esti-mates ofkbub,CO2 normalised to a standard seawater
temper-ature of 20◦C (kbub,CO2,20◦C, whereα=0.78 andSc=666).
The 2 h averaged Knorr_11 cruise data, including estimates of1kw, kbub,CO2 andkbub,CO2,20◦C, are provided in
Supple-mental Table S1.
The approach used in this study to estimate 1kw and
kbub,CO2 from the Knorr_11 field data neglects the effect of
sea surface skin temperature and CO2 chemical enhance-ment. Skin temperature is typically only a few tenths of a degree less than bulk seawater under the conditions encoun-tered in this study (Fairall et al., 1996). The impact uponkCO2
due to skin temperature effects on CO2solubility and carbon-ate speciation is probably of the order of 3 % (Woolf et al., 2016). There is a chemical enhancement of the CO2flux due to ionisation at the sea surface (Hoover and Berkshire, 1969). The effect onkCO2 has been estimated to be up to about 8 %
at a wind speed of 4–6 m s−1(Wanninkhof and Knox, 1996), which amounts to a maximum impact of a few cm h−1. By neglecting these effects we have slightly overestimated1kw andkbub,CO2, but the magnitude of these corrections would
be small relative to the environmental scatter or measurement uncertainty.
5 Conclusions
The Knorr_11 concurrent measurements of DMS and CO2 gas transfer velocities show significant differences in gas transfer between the two gases at intermediate–high wind speeds. These data indicate that (i) bubble-mediated gas transfer becomes significant for CO2at or above the thresh-old for wave-breaking and (ii) the wind speed dependence is
non-linear, with a similar functional form to proposed rela-tionships predicting whitecap areal extent from wind speed. However, existing models of bubble-mediated gas transfer using the Knorr_11 in situ observations of whitecap fraction significantly underestimate the importance of this process.
There are a number of assumptions behind model esti-mates of bubble-mediated gas exchange (Goddijn-Murphy et al., 2016). Model bias can be crudely split into (i) un-certainties in the scaling of whitecap fraction to the bubble population (e.g. using Cipriano and Blanchard, 1981) and (ii) the relationship between gas exchange and bubble proper-ties, which are predicted as a function of air entrainment into the surface ocean by a breaking wave, bubble injection depth, size distribution and mobility through the water (a function of surface cleanliness and surfactants). The underestimation of bubble-mediated CO2gas transfer by both models is par-ticularly apparent at low–intermediate wind speeds and low whitecap fraction. This could indicate either that bubble pro-duction during microscale breaking is an important process for gas transfer or that the relationship between whitecap fraction and bubble population is poorly constrained.
In summary, the approach of using simultaneous measure-ments of multiple gases with different solubility appears to be a viable way to constrain the magnitude of bubble-mediated gas transfer. Analysis of additional sparingly soluble gases, such as methane or oxygenated hydrocarbons, would further strengthen this approach. A much larger data set, under a wider range of oceanographic conditions, is certainly needed. In particular, it would be useful to examine DMS and CO2 gas transfer velocities in ocean regions with different tem-peratures, where the solubility of each gas is significantly different from this study.
Data availability. Relevant data for this paper can be found in Ta-ble S1 of the Supplement.
Appendix A
A1 Seawater CO2and DMS measurements
Seawater CO2 and DMS were monitored in the supply of seawater pumped continuously through the ship from an in-take on the bow located 6 m below the sea surface. CO2was equilibrated with air in a recirculating showerhead type sys-tem. Alternate air- and water-sidepCO2were each measured for 5 min by the same infrared gas analyser (IRGA). Sea-water DMS was equilibrated with DMS-free air in a tubu-lar porous membrane equilibrator, operated in a single-pass, counterflow mode. DMS was measured at 1 Hz using chem-ical ionisation mass spectrometry and bin-averaged at 1 min intervals (UCI miniCIMS; Saltzman et al., 2009). DMS was calibrated by continuously pumping an internal standard of tri-deuterated, DMS (d3-DMS) into the seawater flow just before the equilibrator. Details of the methods and instru-mentation used for equilibration and detection of seawater DMS are described in Saltzman et al. (2009).
A2 Mast-mounted instrumentation and data acquisition
The eddy covariance system was mounted 13.6 m above the sea surface on the bow mast. Platform angular rates and accelerations were measured by two Systron Donner Mo-tion Pak II (MPII) units. Three-dimensional winds and sonic temperature were measured by two Campbell CSAT3 sonic anemometers. Air sampling inlets for DMS and CO2 were located at the same height as the anemometers and within 20 cm of the measurement region. GPS and digital compass output were digitally logged at 1 Hz. Winds were corrected for ship motion and orientation as described in Miller et al. (2008) and Landwehr et al. (2015). The eddy covariance data streams were logged in both analogue and digital format as described in Bell et al. (2013).
A3 High-frequency atmospheric DMS and CO2
measurements
Atmospheric DMS measurements were made at 10 Hz using an atmospheric pressure chemical ionisation mass spectrom-eter located in a lab van (UCI mesoCIMS; Bell et al., 2013). Air was drawn to the instrument through a 28 m long 1/2 in OD Teflon tube. A subsample of the air stream was passed through a Nafion drier prior to entering the mass spectrom-eter. The measurement was calibrated using an internal gas standard of tri-deuterated DMS added to the inlet (see Bell et al., 2013).
Atmospheric CO2measurements were made on air drawn at 8 L min−1through a filtered inlet (90 mm diameter with 1 micron pore size, Savillex) near the sonic anemometers on the bow mast, through 5 m of 5.9 mm ID polyethylene-lined Dekabon tubing to two fast-response CO2/H2O IRGAs in an enclosure on the bow mast. The IRGAs were open-path-style sensors (LI7500, Licor Inc.) converted to a closed-path con-figuration (see Miller et al., 2010) and were plumbed in se-ries. A Nafion multi-tube membrane drier (PD-200T, Perma-Pure) with 6 L min−1dry air counter flow was installed be-tween the two IRGAs such that the upstream IRGA sampled undried air and the downstream IRGA sampled the same air after drying. This technique removes 97 % of the Webb Cor-rection from the measured CO2flux (first shown by Miller et al., 2010, and confirmed by Landwehr et al., 2014).
The air flow through both the CO2 and DMS inlets was fully turbulent (Re> 10 000). The inlets used in this study introduced a small delay (1t=2.2 s for DMS, 1t=1.2 s for CO2)between measured wind and atmospheric measure-ments, as well as minor loss of covariance at high frequencies (< 5 %). The methods used to estimate the delay and loss of flux are given in Bell et al. (2013).
Eddy covariance fluxes were computed for DMS and CO2 asFDMSorFCO2=σairhw0c0i, whereσairis the dry air den-sity,w0is the fluctuation in vertical winds andc0is the delay-adjusted fluctuation in gas concentration. Average covariance fluxes were processed in 10 and 9.5 min intervals for DMS and CO2, respectively (hereafter referred to as 10 min inter-vals). Momentum and sensible heat fluxes were also com-puted for 10 min intervals (see Bell et al., 2013).
Sampling intervals with a mean wind direction relative to the bow of > 90◦were excluded from the final data set. CO
2 fluxes were also excluded from intervals when either (i) rel-ative wind direction changed excessively (SD > 10◦), (ii) rel-ative wind speed was low (< 1 m s−1)or (iii)1CO2was low (<|30|ppm). DMS and CO2 fluxes were quality controlled for excessive low-frequency flux as described in the Supple-ment of Bell et al. (2013). These quality control criteria ex-cluded 62 % of the intervals for CO2and 55 % for DMS and significantly reduced the scatter in the data.
The Supplement related to this article is available online at https://doi.org/10.5194/acp-17-9019-2017-supplement.
Competing interests. The authors declare that they have no conflict of interest.
Acknowledgements. We thank the captain and crew of the R/V
Knorrand the Woods Hole Marine Department for their assistance in carrying out this cruise. Funding for this research was provided by the NSF Atmospheric Chemistry Program (AGS-0851068, -0851472, -0851407 and -1134709) and the NSF Independent Research and Development Program. Adrian H. Callaghan ac-knowledges support from a Royal Society Shooter International Fellowship and from the National Science Foundation under grant OCE-1434866. Brian Ward acknowledges support from Science Foundation Ireland under grant 08/US/I1455 and from the FP7 Marie Curie Reintegration programme under grant 224776. We are grateful for constructive comments from our reviewers (Byron Blomquist, Ian Brooks and Bill Asher), which helped improve the paper. This study is a contribution to the international Surface Ocean Lower Atmosphere Study (SOLAS) programme. Edited by: Jennifer G. Murphy
Reviewed by: Ian Brooks and William E. Asher
References
Asher, W. E. and Wanninkhof, R.: The effect of bubble-mediated gas transfer on purposeful dual-gaseous tracer experiments, J. Geophys. Res.-Oceans, 103, 10555–10560, https://doi.org/10.1029/98jc00245, 1998.
Asher, W. E., Karle, L. M., Higgins, B. J., Farley, P. J., Monahan, E. C., and Leifer, I. S.: The influence of bubble plumes on air-seawater gas transfer velocities, J. Geophys. Res.-Oceans, 101, 12027–12041, 1996.
Asher, W. E., Edson, J., McGillis, W., Wanninkhof, R., Ho, D. T., and Litchendor, T.: Fractional area whitecap coverage and air-sea gas transfer velocities measured during GasEx-98, in: Gas Transfer at Water Surfaces, American Geophysical Union, 199– 203, 2002.
Bell, T. G., De Bruyn, W., Miller, S. D., Ward, B., Christensen, K. H., and Saltzman, E. S.: Air-sea dimethylsulfide (DMS) gas transfer in the North Atlantic: evidence for limited interfacial gas exchange at high wind speed, Atmos. Chem. Phys., 13, 11073– 11087, https://doi.org/10.5194/acp-13-11073-2013, 2013. Bell, T. G., De Bruyn, W., Marandino, C. A., Miller, S. D., Law, C.
S., Smith, M. J., and Saltzman, E. S.: Dimethylsulfide gas trans-fer coefficients from algal blooms in the Southern Ocean, At-mos. Chem. Phys., 15, 1783–1794, https://doi.org/10.5194/acp-15-1783-2015, 2015.
Blomquist, B. W., Fairall, C. W., Huebert, B. J., Kieber, D. J., and Westby, G. R.: DMS sea-air transfer velocity: Direct mea-surements by eddy covariance and parameterization based on the NOAA/COARE gas transfer model, Geophys. Res. Lett., 33, L07601, https://doi.org/10.1029/2006gl025735, 2006.
Blomquist, B. W., Fairall, C. W., Huebert, B. J., and Wilson, S. T.: Direct measurement of the oceanic carbon monoxide flux by eddy correlation, Atmos. Meas. Tech., 5, 3069–3075, https://doi.org/10.5194/amt-5-3069-2012, 2012.
Blomquist, B. W., Huebert, B. J., Fairall, C. W., Bariteau, L., Ed-son, J. B., Hare, J. E., and McGillis, W. R.: Advances in air-sea CO2flux measurement by eddy correlation, Bound.-Lay. Meteo-rol., 152, 245–276, https://doi.org/10.1007/s10546-014-9926-2, 2014.
Callaghan, A. H. and White, M.: Automated processing of sea surface images for the determination of white-cap coverage, J. Atmos. Ocean. Tech., 26, 383–394, https://doi.org/10.1175/2008jtecho634.1, 2009.
Callaghan, A. H., de Leeuw, G., Cohen, L., and O’Dowd, C. D.: Relationship of oceanic whitecap coverage to wind speed and wind history, Geophys. Res. Lett., 35, L23609, https://doi.org/10.1029/2008gl036165, 2008.
Callaghan, A. H., Deane, G. B., and Stokes, M. D.: Two regimes of laboratory whitecap foam decay: Bubble-plume controlled and surfactant stabilized, J. Phys. Oceanogr., 43, 1114–1126, https://doi.org/10.1175/Jpo-D-12-0148.1, 2013.
Carpenter, L. J., Archer, S. D., and Beale, R.: Ocean-atmosphere trace gas exchange, Chem. Soc. Rev., 41, 6473–6506, https://doi.org/10.1039/c2cs35121h, 2012.
Cipriano, R. J. and Blanchard, D. C.: Bubble and aerosol spectra produced by a laboratory ‘break-ing wave’, J. Geophys. Res.-Oceans, 86, 8085–8092, https://doi.org/10.1029/JC086iC09p08085, 1981.
Dacey, J. W. H., Wakeham, S. G., and Howes, B. L.: Henry’s law constants for dimethylsulfide in fresh water and seawater, Geo-phys. Res. Lett., 11, 991–994, 1984.
Edson, J. B., DeGrandpre, M. D., Frew, N. M., and McGillis, W. R.: Investigations of air-sea gas exchange in the CoOP Coastal Air-Sea Chemical Exchange Project, Oceanography, 21, 34–45, https://doi.org/10.5670/oceanog.2008.03, 2008.
Fairall, C. W., Bradley, E. F., Godfrey, J. S., Wick, G. A., Edson, J. B., and Young, G. S.: Cool-skin and warm-layer effects on sea surface temperature, J. Geophys. Res.-Oceans, 101, 1295–1308, https://doi.org/10.1029/95jc03190, 1996.
Fairall, C. W., Hare, J. E., Edson, J. B., and McGillis, W.: Param-eterization and micrometeorological measurement of air-sea gas transfer, Bound.-Lay. Meteorol., 96, 63–105, 2000.
Fairall, C. W., Yang, M., Bariteau, L., Edson, J. B., Helmig, D., McGillis, W., Pezoa, S., Hare, J. E., Huebert, B., and Blomquist, B.: Implementation of the Coupled Ocean-Atmosphere Response Experiment flux algorithm with CO2, dimethyl sulfide, and O3, J. Geophys. Res.-Oceans, 116, C00F09, https://doi.org/10.1029/2010jc006884, 2011.
Goddijn-Murphy, L., Woolf, D. K., and Marandino, C.: Space-based retrievals of air-sea gas transfer velocities using altimeters: Calibration for dimethyl sulfide, J. Geophys. Res.-Oceans, 117, C08028, https://doi.org/10.1029/2011jc007535, 2012.
Goddijn-Murphy, L., Woolf, D. K., Callaghan, A. H., Nightin-gale, P. D., and Shutler, J. D.: A reconciliation of em-pirical and mechanistic models of the air-sea gas trans-fer velocity, J. Geophys. Res.-Oceans, 121, 818–835, https://doi.org/10.1002/2015jc011096, 2016.
Hoover, T. E. and Berkshire, D. C.: Effects of hydration on carbon dioxide exchange across an air-water interface, J. Geophys. Res., 74, 456–464, 1969.
Huebert, B. J., Blomquist, B. W., Hare, J. E., Fairall, C. W., Johnson, J. E., and Bates, T. S.: Measurement of the sea-air DMS flux and transfer velocity using eddy correlation, Geophys. Res. Lett., 31, L23113, https://doi.org/10.1029/2004gl021567, 2004.
Keeling, R. F.: On the role of large bubbles in air-sea gas exchange and supersaturation in the ocean, J. Marine Res., 51, 237–271, https://doi.org/10.1357/0022240933223800, 1993.
Kloster, S., Feichter, J., Maier-Reimer, E., Six, K. D., Stier, P., and Wetzel, P.: DMS cycle in the marine ocean-atmosphere system – a global model study, Biogeosciences, 3, 29–51, https://doi.org/10.5194/bg-3-29-2006, 2006.
Landwehr, S., Miller, S. D., Smith, M. J., Saltzman, E. S., and Ward, B.: Analysis of the PKT correction for direct CO2 flux mea-surements over the ocean, Atmos. Chem. Phys., 14, 3361–3372, https://doi.org/10.5194/acp-14-3361-2014, 2014.
Landwehr, S., O’Sullivan, N., and Ward, B.: Direct flux measure-ments from mobile platforms at sea: Motion and airflow dis-tortion corrections revisited, J. Atmos. Ocean. Tech., 32, 1163– 1178, https://doi.org/10.1175/jtech-d-14-00137.1, 2015. Le Quéré, C., Moriarty, R., Andrew, R. M., Peters, G. P., Ciais, P.,
Friedlingstein, P., Jones, S. D., Sitch, S., Tans, P., Arneth, A., Boden, T. A., Bopp, L., Bozec, Y., Canadell, J. G., Chini, L. P., Chevallier, F., Cosca, C. E., Harris, I., Hoppema, M., Houghton, R. A., House, J. I., Jain, A. K., Johannessen, T., Kato, E., Keel-ing, R. F., Kitidis, V., Klein Goldewijk, K., Koven, C., Landa, C. S., Landschützer, P., Lenton, A., Lima, I. D., Marland, G., Mathis, J. T., Metzl, N., Nojiri, Y., Olsen, A., Ono, T., Peng, S., Peters, W., Pfeil, B., Poulter, B., Raupach, M. R., Regnier, P., Rö-denbeck, C., Saito, S., Salisbury, J. E., Schuster, U., Schwinger, J., Séférian, R., Segschneider, J., Steinhoff, T., Stocker, B. D., Sutton, A. J., Takahashi, T., Tilbrook, B., van der Werf, G. R., Viovy, N., Wang, Y.-P., Wanninkhof, R., Wiltshire, A., and Zeng, N.: Global carbon budget 2014, Earth Syst. Sci. Data, 7, 47–85, https://doi.org/10.5194/essd-7-47-2015, 2015.
Liss, P. S. and Merlivat, L.: Air-sea gas exchange rates: introduction and synthesis, in: The role of air-sea exchange in geochemical cycling, edited by: Buatmenard, P., Reidel, 113–127, 1986. Liss, P. S. and Slater, P. G.: Flux of gases across the air-sea interface,
Nature, 247, 181–184, 1974.
Marandino, C. A., de Bruyn, W. J., Miller, S. D., and Saltzman, E. S.: Eddy correlation measurements of the air/sea flux of dimethylsulfide over the North Pacific Ocean, J. Geophys. Res.-Atmos., 112, D03301, https://doi.org/10.1029/2006jd007293, 2007.
McGillis, W. R., Dacey, J. W. H., Frew, N. M., Bock, E. J., and Nel-son, R. K.: Water-air flux of dimethylsulfide, J. Geophys. Res.-Oceans, 105, 1187–1193, 2000.
McGillis, W. R., Edson, J. B., Hare, J. E., and Fairall, C. W.: Direct covariance air-sea CO2 fluxes, J. Geophys. Res.-Oceans, 106, 16729–16745, 2001.
Melville, W. K. and Matusov, P.: Distribution of breaking waves at the ocean surface, Nature, 417, 58–63, 2002.
Miller, S. D., Hristov, T. S., Edson, J. B., and Friehe, C. A.: Plat-form motion effects on measurements of turbulence and air-sea exchange over the open ocean, J. Atmos. Ocean. Tech., 25, 1683– 1694, https://doi.org/10.1175/2008jtecho547.1, 2008.
Miller, S. D., Marandino, C., de Bruyn, W., and Saltzman, E. S.: Air-sea gas exchange of CO2 and DMS in the North At-lantic by eddy covariance, Geophys. Res. Lett., 36, L15816, https://doi.org/10.1029/2009gl038907, 2009.
Miller, S. D., Marandino, C., and Saltzman, E. S.: Ship-based measurement of air-sea CO2 exchange by eddy covariance, J. Geophys. Res.-Atmos., 115, D02304, https://doi.org/10.1029/2009jd012193, 2010.
Pereira, R., Schneider-Zapp, K., and Upstill-Goddard, R. C.: Sur-factant control of gas transfer velocity along an offshore coastal transect: results from a laboratory gas exchange tank, Biogeo-sciences, 13, 3981–3989, https://doi.org/10.5194/bg-13-3981-2016, 2016.
Rhee, T. S., Nightingale, P. D., Woolf, D. K., Caulliez, G., Bowyer, P., and Andreae, M. O.: Influence of ener-getic wind and waves on gas transfer in a large wind-wave tunnel facility, J. Geophys. Res.-Oceans, 112, C05027, https://doi.org/10.1029/2005jc003358, 2007.
Saltzman, E. S., King, D. B., Holmen, K., and Leck, C.: Experimen-tal determination of the diffusion coefficient of dimethylsulfide in water, J. Geophys. Res.-Oceans, 98, 16481–16486, 1993. Saltzman, E. S., De Bruyn, W. J., Lawler, M. J., Marandino,
C. A., and McCormick, C. A.: A chemical ionization mass spectrometer for continuous underway shipboard analysis of dimethylsulfide in near-surface seawater, Ocean Sci., 5, 537–546, https://doi.org/10.5194/os-5-537-2009, 2009.
Scanlon, B. and Ward, B.: Oceanic wave breaking cov-erage separation techniques for active and matur-ing whitecaps, Methods in Oceanography, 8, 1–12, https://doi.org/10.1016/j.mio.2014.03.001, 2013.
Schwendeman, M. and Thomson, J.: Observations of whitecap coverage and the relation to wind stress, wave slope, and tur-bulent dissipation, J. Geophys. Res.-Oceans, 120, 8346–8363, https://doi.org/10.1002/2015jc011196, 2015.
Stefels, J., Steinke, M., Turner, S., Malin, G., and Belviso, S.: En-vironmental constraints on the production and removal of the climatically active gas dimethylsulphide (DMS) and implica-tions for ecosystem modelling, Biogeochemistry, 83, 245–275, https://doi.org/10.1007/s10533-007-9091-5, 2007.
Virkkula, A., Teinilä, K., Hillamo, R., Kerminen, V.-M., Saarikoski, S., Aurela, M., Koponen, I. K., and Kulmala, M.: Chemical size distributions of boundary layer aerosol over the Atlantic Ocean and at an Antarctic site, J. Geophys. Res.-Atmos., 111, D05306, https://doi.org/10.1029/2004jd004958, 2006.
Wanninkhof, R.: Relationship between wind speed and gas ex-change over the ocean, J. Geophys. Res.-Oceans, 97, 7373–7382, 1992.
Wanninkhof, R. and Knox, M.: Chemical enhancement of CO2 exchange in natural waters, Limnol. Oceanogr., 41, 689–697, https://doi.org/10.4319/lo.1996.41.4.0689, 1996.
Wanninkhof, R., Ledwell, J. R., and Broecker, W. S.: Gas exchange-wind speed relation measured with sul-fur hexafluoride on a lake, Science, 227, 1224–1226, https://doi.org/10.1126/science.227.4691.1224, 1985.
Watson, A. J., Upstill-Goddard, R. C., and Liss, P. S.: Air-sea gas exchange in rough and stormy seas measured by a dual-tracer technique, Nature, 349, 145–147, 1991.
Weiss, R. F.: Carbon dioxide in water and seawater: The solubility of a non-ideal gas, Mar. Chem., 2, 203–215, https://doi.org/10.1016/0304-4203(74)90015-2, 1974.
Woolf, D. K.: Bubbles and the air-sea transfer velocity of gases, Atmos. Ocean, 31, 517–540, 1993.
Woolf, D. K.: Bubbles and their role in gas exchange, in: The Sea Surface and Global Change, edited by: Liss, P. S. and Duce, R. A., Cambridge University Press, Cambridge, 173–205, 1997. Woolf, D. K.: Parametrization of gas transfer velocities and
sea-state-dependent wave breaking, Tellus B, 57, 87–94, 2005. Woolf, D. K., Leifer, I. S., Nightingale, P. D., Rhee, T. S., Bowyer,
P., Caulliez, G., de Leeuw, G., Larsen, S. E., Liddicoat, M., Baker, J., and Andreae, M. O.: Modelling of bubble-mediated gas transfer: Fundamental principles and a laboratory test, J. Marine Syst., 66, 71–91, https://doi.org/10.1016/j.jmarsys.2006.02.011, 2007.
Woolf, D. K., Land, P. E., Shutler, J. D., Goddijn-Murphy, L. M., and Donlon, C. J.: On the calculation of air-sea fluxes of CO2 in the presence of temperature and salin-ity gradients, J. Geophys. Res.-Oceans, 121, 1229–1248, https://doi.org/10.1002/2015jc011427, 2016.
Yang, M., Blomquist, B. W., Fairall, C. W., Archer, S. D., and Hue-bert, B. J.: Air-sea exchange of dimethylsulfide in the South-ern Ocean: Measurements from SO GasEx compared to temper-ate and tropical regions, J. Geophys. Res.-Oceans, 116, C00F05, https://doi.org/10.1029/2010jc006526, 2011.
Yang, M., Beale, R., Liss, P., Johnson, M., Blomquist, B., and Nightingale, P.: Air-sea fluxes of oxygenated volatile organic compounds across the Atlantic Ocean, Atmos. Chem. Phys., 14, 7499–7517, https://doi.org/10.5194/acp-14-7499-2014, 2014.