Robust Speech Recognition Using Perceptual Wavelet Denoising and
Mel-frequency Product Spectrum Cepstral Coefficient Features
Mohamed Cherif Amara Korba
University of Larbi Tebessi, Tebessa, Electronic Department Constantine road, BP 15454, Tebessa, Algeria
E-mail: [email protected]
Djemil Messadeg
University of Badji-Mokhtar, Annaba, Electronic Department BP 12, 23000, Annaba, Algeria
E-mail: [email protected]
Rafik Djemili
University 20 Aout 1955, Skikda, Electronic Department El-Hadaiek road, BP 26 Skikda, Algeria
E-mail: [email protected]
Hocine Bourouba
University of Mentouri, Constantine, Electronic Department Ain El Bey road, BP 325, 25017 Constantine, Algeria E-mail: [email protected]
Keywords: noise robust speech parametrization, perceptual wavelet-packet transform, penalized threshold, mel-frequency product spectrum cepstral coefficients
Received: May 25, 2008
To improve the performance of Automatic Speech Recognition (ASR) Systems, a new method is proposed to extract features capable of operating at a very low signal-to-noise ratio (SNR). The basic idea introduced in this article is to enhance speech quality as the first stage for Mel-cepstra based recognition systems, since it is well-known that cepstral coefficients provided better performance in clean environment. In this speech enhancement stage, the noise robustness is improved by the perceptual wavelet packet (PWP) based denoising algorithm with both type of thresholding procedure, soft and modified soft thresholding procedure. A penalized threshold was selected. The next stage of the proposed method is extract feature, it is performed by the use of Mel-frequency product spectrum cepstral coefficients (MFPSCCs) introduced by D. Zhu and K.K and Paliwal in [2]. The Hidden Markov Model Toolkit (HTK) was used throughout our experiments, which were conducted for various noise types provided by noisex-92 database at different SNRs. Comparison of theproposed approach with the MFCC-based conventional (baseline) feature extraction method shows that the proposed method improves recognition accuracy rate by 44.71 %, with an average value of 14.80 % computed on 7 SNR level for white Gaussian noise conditions.
Povzetek: Opisana je nova metoda robustnega strojnega prepoznavanja govora.
1
Introduction
ASR systems are used in many man–machine communication dialog applications, such as cellular telephones, speech driven applications in modern offices or security systems. They give acceptable recognition accuracy for clean speech, their performance degrades when they are subjected to noise present in practical environments [3].
Recently many approaches have been developed to address the problem of robust speech parametrization in ASR, The Mel-frequency cepstral coefficients (MFCCs)
are the most widely used features, they were adopted in many popular speech recognition systems by many researchers, such as [8],[9]. However, it is well-known that MFCC is not robust enough in noisy environments, which suggests that the MFCC still has insufficient sound representation capability, especially at low SNR.
phase spectrum and uses only magnitude spectrum for speech perception [1]. Recently, it has been shown that the phase spectrum is useful in human speech perception [2]. The features derived from either the power spectrum or the phase spectrum have the limitation in representation of the signal.
In this paper, we proposed noise robust feature extraction algorithm based on enhancement speech signal before extraction feature to improve performance of Mel-cepstra based recognition systems.
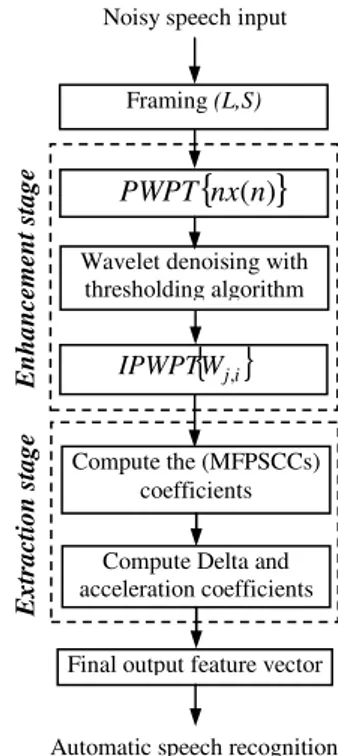
The feature extraction system performs two major functions. The first is speech enhancement; the other is feature extraction. (see Figure 1).
The speech enhancement stage employs the perceptual wavelet packet transform (PWPT) instead of conventional wavelet-packet transform, to decompose the input speech signal into critical sub-band signals. Such a PWPT is designed to match the psychoacoustic model and to improve the performance of speech denoising [11]. Denoising is performed by thresholding algorithm introduced by Donoho [7] as a powerful tool in denoising signals degraded by additive white noise.
Denoising procedure is divided into two steps: firstly, threshold is estimated by penalized threshold algorithm [5], and secondly, two types of thresholding algorithms are applied, soft thresholding algorithm [6] and modified soft thresholding (Mst) algorithm proposed in [4] to determine who of these algorithm is more efficient to improve recognition accuracy. Finally, these thresholded wavelet coefficients are constructed to obtain the enhanced speech samples by the inverse perceptual wavelet packet transform (IPWPT).
Stage of feature extraction is performed by the use of Mel-frequency product spectrum cepstral coefficients (MFPSCCs) introduced by D. Zhu and K.K. Paliwal in [2]. This is defined as the product of the power spectrumand the group delay function (GDF). It combines the magnitude spectrum and the phase spectrum.
The GDF can be defined as follows [2]
ω ω ω
τρ
d X d(log( ( )) Im
)
( =− (1)
2
) (
) ( ) ( ) ( ) ( Im
ω
ω ω ω
ω
X
Y X Y
XR R + I I
−
= (2)
Where X(ω) is the Fourier transforms of frame speech x(n), Y(ω) is the Fourier transforms of nx(n), and the subscripts R and I denote the real and imaginary parts. They have shown in their experiments [2] that the MFPSCC feature gives better performance than power spectrum and phase spectrum features. But in the low SNR the recognition accuracy rate remains weak.
The rest of this paper is organized as follows. Section 2 introduces a block diagram of proposed noise robust feature (PNRF) extraction algorithm and provides detailed description of each constituting part. Section 3 shows a graphical comparison between different features. Section 4 evaluates the performance of the proposed
system under a different level of noise conditions. The conclusion is presented in Section 5.
2
Description of proposed feature
extraction algorithm
Figure1 presents a block diagram of proposed noise robust feature extraction algorithm. Noisy input speech is sampled at Fs =11025Hz and segment into frames of length L = 275 samples (25 ms) with frame shift interval of S = 110 samples (10 ms). There is no need to apply classical windowing operation in the perceptual wavelet packet decomposition (PWPD) scheme.
Figure 1: Block diagram of proposed noise robust feature extraction algorithm.
2.1
Perceptual wavelet-packet transform
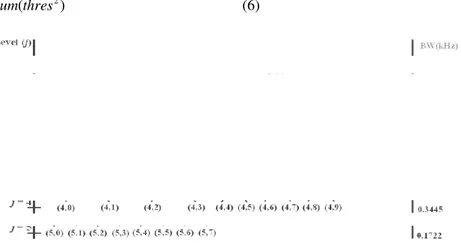
The decomposition tree structure of PWPT is designed to approximate the critical bands (CB) as close as possible in order to efficiently match the psychoacoustic model [12] [13]. Hence, the size of PWPT decomposition tree is directly related to the number of critical Bands. The sampling rate is 11025 Hz, yielding a speech bandwidth of 5.512 KHz. Within this bandwith, there are approximately 17 critical bands , which are derived from the Daubechies wavelet 8 (db8) and the decomposition is implemented by an efficient 5 level tree structure, the corresponding PWPT decomposition tree can be constructed as depicted in Figure 2. The perceptual wavelet transform (PWT) is used to decompose nx(n) into several frequency subbands that approximate the critical bands. The set of wavelet expansion coefficients is generated from
{
wj,i(k)}
=PWPT(
nx( )
n)
(3)E
x
tr
a
ct
io
n
s
ta
g
e
E
n
h
a
n
ce
m
en
t
st
a
g
e
Framing (L,S)
{
nx(n)}
PWPTWavelet denoising with thresholding algorithm
{ }
WjiIPWPT ,
Compute the (MFPSCCs) coefficients
Compute Delta and acceleration coefficients
Final output feature vector Noisy speech input
Where n=1, 2,K,L (L is the length of frame as mentioned above L =275 samples).
5 2 1 , 0 , , ,
j= K ( j: number of levels (five levels)). )
1 2 ( 2
1 −
= , , , j
i K (i: denotes index of subbands in each level j).
Terminal nodes of PWPD tree represent a non uniform filterbank, which is sometimes called as ‘perceptual filterbank’ in the literature. Node (5,0) through (3,7) at the last level of decomposition tree are the terminal node. The output of this stage is a set of wavelet coefficients.
2.2
Wavelet denoising procedure
Denoising by wavelet is performed by thresholding algorithm, in which coefficients smaller than a specific value, or threshold, will be shrunk or scaled [6] ,[14]. There are many algorithms for obtaining threshold value. In this study, threshold is obtained by PWP coefficients using a penalization method provided by Birge-Massart [5].
2.2.1Penalized threshold for PWP denoising
Let column vector wj,ibe a wavelet packet coefficient
(WPC) sequence, where j represents wavelet packet decomposition (WPD) level and i stands for sub band. The standard deviation σ is estimated in the same way as in [6]
1 Median
( )
w1,1mad
γ
σ = (4)
1 , 1
w : is a WPC sequence of node (1,1)
The constant γmad =0,6745in equation (4) makes the estimate of median absolute deviation unbiased for the normal distribution.
nc : number of all the WPC of the ascending node index
cfs : content all the WPC of the ascending node index )
,
(W5,0 W5,1KW3,7
) (t cd
thres= where t=1Kncd (5)
threscontain absolute value of WPC stored in decreasing
order, cd content the WPC of the ascending node index )
,
(W5,1 W5,2KW3,7 and ncd is the number of the WPC in
the cd
)
(thres2
cumsum
A= (6)
cumsum: compute the cumulative sum along different
dimensions of an array
(
)
(
)
(
t nc t A)
index
valthr= _min2σ2 α+log − (7)
α : is a tuning parameter of penalty term (α =6.25)
( )
cfsMaxthr=max (8)
(
valthr Maxthr)
Valthr=min , (9)
Where Valthrdenotes threshold value.
2.2.2Thresholding algorithms
In this subsection, we review the most used thresholding algorithms, both hard and soft thresholding techniques proposed in [6] can be implemented to denoising speech signal. The hard thresholding function is defined for threshold
λ
as
≤
=
λ λ δλ
f x x
x x
H 0
)
( (10)
in this thresholding algorithm, the wavelet coefficients x
less than the threshold
λ
will be replaced with zero. and the soft thresholding function is defined as
−
≤ =
λ λ
λ δλ
f x x
x sign
x x
S
) )( (
0 )
( (11)
which can be viewed as setting the components of the noise subspace to zero, and performing a magnitude subtraction in the speech plus noise subspace. (figure 3)
2.2.3Modified soft thresholding procedure
Each one of these algorithms defined above has its own disadvantages. The hard thresholding procedure creates discontinuities in the output signal is disadvantage, and in soft thresholding algorithm, the existence of the bias is the disadvantage. But soft thresholding procedure is near optimal for the signals corrupted by additive white Gaussian noise, however, some considerations applying the thresholding method (hard or soft thresholding method) to speech signal since the speech signal in the unvoiced region contains relatively lots of high frequency components that can be eliminated during the thresholding process. For improving these disadvantages, a modified soft thresholding (Mst) algorithm was been introduced and it is defined as follow [4] (see Figure 3):
≥ −
+ =
=
λ θ
λ
λ θ
δλ
x x
x
x x
x
y Mst
)) 1 ( )( sgn( ) (
p
(12)
Where x∈wj,i and y∈wj,i if wj,iis the output column
vector of denoised wavelet coefficient sequence. WPD subband i and level j as defined in equation (3). The inclination coefficient
θ
introduced in equation (12) is defined as follows:) max(wj,i
λ β
θ = (13)
β
is the inclination adjustment constant. The main idea of modified soft thresholding is the introduction of the inclination coefficientθ
, which prevents crudely setting to zero the wavelet coefficients whose absolute values lie below the thresholdλ
.The modified soft thresholding procedure is equivalent to the soft thresholding forβ
=0. In our case the inclination adjustment constantβ
has been set to 0.5.Figure 3: Characteristic of soft and modified soft thresholding technique, threshold λ is set to 0.5 in the figure above. In the case of modified soft threshold the parameter β is 0.5
2.3
Mel-frequency product-spectrum
cepstral coefficients
On using the IPWPT, we obtained the enhanced speech signal n~x(n)and we compute the robust feature MFPSCC as described in [2]
The MFPSCCs are computed in the following four steps:
1) Compute the FFT spectrum of ~x(n)and n~x(n).
Denote them by X(k) and Y(k).
2) Compute the product spectrum
Q(k)=max
(
XR(k)YR(k)+XI(k)YI(k),ρ)
(14) Where1010 max
(
X (k)Y (k) X (k)Y (k))
I I R
R +
⋅ =
σ
ρ (15)
σ is the threshold in dB ( in our case σ =−60dB).
3) Apply a Mel-frequency filter-bank to Q(k)to get the filter-bank energies (FBEs).
4) Compute DCT of log FBEs to get the MFPSCCs.
In all our experiments, the performances of ASR system are enhanced by adding time derivatives and log energy to the basic static parameters for different
features. The delta coefficients are computed using the following regression formula
∑
∑
Θ
= Θ
=
− + − =
1 2 1
1 1
2
) (
θ θ
θ θ
θ θ c c
dt (16)
Where dt is the delta coefficient computed in terms of
the corresponding static coefficients ct−Θto ct+Θ. The
same formula is applied to the delta to obtain acceleration coefficients.
3
Graphical comparison between the
different features
Figure 4 shows a sample comparison between PNFR, Mfpscc and corresponding MFCC features for Arabic
digit one obtained before DCT operation for different
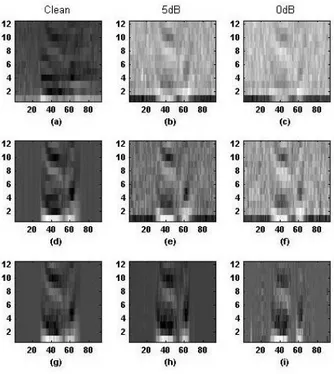
SNR levels. As standard in MFCC, a window size of 25 ms with an overlap of 10 ms was chosen, and cepstral features were obtained from DCT of log-energy over 22 Mel-scale filter banks. The degradation of spectral features for MFCC in the presence of white noise is evident, whereas PNFR obtained with soft thresholding (PNRF_soft) and Mfpscc features prevail at elevated noise levels. For SNR < 10dB we can see clearly that PNFR_soft is better noise robustness than mfpscc features.
Figure 4: MFCC features (a)-(c), MFPSCC features (d)-(f) and PNRF_soft (g)-(i) for Arabic digit one, under different SNR conditions (clean, 10 dB and 0 dB).
4
Speech recognition experiments
of automatic and signals of University of Badji-Mokhtar Annaba Algeria, which were designed to evaluate the performance of automatic speech algorithms.
This database contains 90 speakers: 46 male and 44 female, each speaker repeats each Arabic digit 10 times. The leading and trailing silence is removed from each utterance. All samples are stored in Microsoft wave format files with 11025Hz sampling rate, 16 bit PCM, and mono-channels.
In our experiments, training is performed on clean speech utterances and testing data, which is different from the training data, is corrupted by different real-world noises added at the SNRs from -5 dB to 20dB at the step of 5dB, are used to evaluate the performance of a speech recognizer system. Four types of additive noises were used: white noise, pink noise, factory noise (plate-cutting and electrical welding equipment) and F16 cockpit noise selected from Noisex-92 database [15].
There are two test sets, In the test set A, There are 10 utterance of each digit (0-9) from each speaker (90 speakers): 6 of the utterance are for training and 4 remaining are for testing, what gives 5400 utterances for clean training and 3600 utterances were used for testing the system.
In the test set B, The training set contained 10 utterances of the Arabic digits each from 60 speakers (31 male and 29 female) comprising a total of 6000 utterances, and the test set contained isolated digits from 30 other speakers (15 male and 15 female) for a total of 3000 utterances.
A recognition system was developed using the Hidden Markov Toolkit (HTK) [10], implementing a 15 state left-to-right transition model for each digit where the probability distribution on each state was modeled as a three-mixture Gaussian.
We measured the robustness by comparing the word accuracies obtained with the proposed method and
baseline feature parameters. As a baseline, the recognition system was developed using MFCC features comprising of 12 cepstral coefficients (0th coefficient is not used), log energy, delta and accelerator coefficients, totally 39 coefficients.
In the calculation of all the features, the speech signal was analyzed every 10ms with a frame width of 25ms multiplied with hamming window, accept proposed feature there is no need to apply Hamming window. The Mel filter bank was designed with 22 frequency bands in the range from 0 Hz to 5.51 kHz.
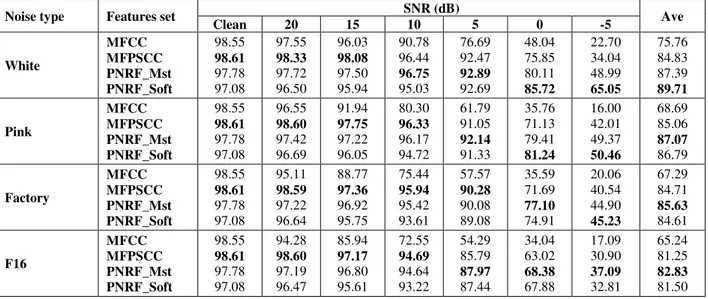
Tables 1 and table 2 show the accuracies obtained for various noise types with the different features. The last column is the average accuracy under different SNRs between clean and -5dB. From the results we may draw the following conclusions:
1. For clean speech, the performance of both features MFCCs and MFPSCCs are comparable, with high recognition rates. They provide better performance than the PNRF for the two test sets.
2. At SNR between 20 and 10dB, MFPSCC feature
demonstrates much better noise robustness than other features for all noise types.
3. At SNR between 5 and -5dB the PNRF_soft features
and PNRF with modified soft thresholding algorithm (PNRF_mst) obtain better performance than other features.
4. For white noise the PNRF_soft features obtain better performance than PNRF_mst, which indicate that the soft thresholding procedure reduces efficiently the level of additive white noise.
5. For pink, factory and f16 noises PNRF_mst features demonstrate significantly better performance than PNRF_soft features, which indicate that modified soft thresholding is better able to reduce the level of additive colored noise in the input speech signal.
Table 1: Digit recognition accuracy (%) for different features of test set A (new speech samples from speakers whose speech was used for training system).
Noise type Features set SNR (dB) Ave
Clean 20 15 10 5 0 -5
White
MFCC MFPSCC PNRF_Mst PNRF_Soft
98.55 98.61 97.78 97.08
97.55 98.33 97.72 96.50
96.03 98.08 97.50 95.94
90.78 96.44 96.75 95.03
76.69 92.47 92.89 92.69
48.04 75.85 80.11 85.72
22.70 34.04 48.99 65.05
75.76 84.83 87.39 89.71
Pink
MFCC MFPSCC PNRF_Mst PNRF_Soft
98.55 98.61 97.78 97.08
96.55 98.60 97.42 96.69
91.94 97.75 97.22 96.05
80.30 96.33 96.17 94.72
61.79 91.05 92.14 91.33
35.76 71.13 79.41 81.24
16.00 42.01 49.37 50.46
68.69 85.06 87.07 86.79
Factory
MFCC MFPSCC PNRF_Mst PNRF_Soft
98.55 98.61 97.78 97.08
95.11 98.59 97.22 96.64
88.77 97.36 96.92 95.75
75.44 95.94 95.42 93.61
57.57 90.28 90.08 89.08
35.59 71.69 77.10 74.91
20.06 40.54 44.90 45.23
67.29 84.71 85.63 84.61
F16
MFCC MFPSCC PNRF_Mst PNRF_Soft
98.55 98.61 97.78 97.08
94.28 98.60 97.19 96.47
85.94 97.17 96.80 95.61
72.55 94.69 94.64 93.22
54.29 85.79 87.97 87.44
34.04 63.02 68.38 67.88
17.09 30.90 37.09 32.81
Noise type Features set SNR (dB) Ave
Clean 20 15 10 5 0 -5
White
MFCC MFPSCC PNRF_Mst PNRF_Soft
97.80 97.60 97.00 96.27
96.77 97.47 96.87 95.67
95.03 97.13 96.67 95.07
88.93 96.03 95.47 93.73
74.49 92.13 92.36 91.00
43.91 77.33 80.83 84.09
18.34 39.41 49.65 63.05
73.61 85.30 86.97 88.41
Pink
MFCC MFPSCC PNRF_Mst PNRF_Soft
97.80 97.60 97.00 96.27
95.63 97.59 96.70 95.77
89.36 97.07 96.03 95.23
79.03 95.50 94.83 93.73
60.59 90.30 90.43 89.63
39.28 68.99 77.49 78.09
22.44 39.48 46.28 48.92
69.16 83.79 85.53 85.37
Factory
MFCC MFPSCC PNRF_Mst PNRF_Soft
97.80 97.60 97.00 96.27
93.93 97.59 96.37 95.33
87.16 96.70 95.47 94.43
73.12 95.07 93.70 92.23
54.52 88.13 87.86 86.76
35.88 69.66 73.86 73.02
22.71 37.35 42.08 42.61
66.44 83.15 83.76 82.95
F16
MFCC MFPSCC PNRF_Mst PNRF_Soft
97.80 97.60 97.00 96.27
92.63 97.59 96.40 95.53
83.59 95.93 95.63 94.70
69.26 93.30 92.86 91.86
50.72 82.22 86.26 85.06
34.41 58.82 66.32 66.12
19.87 29.68 34.38 31.78
64.04 79.30 81.26 80.18
Table 2: Digit recognition accuracy (%) for different features of test set B (speech samples from speakers whose speech was not used for training system).
5
Conclusion
In this paper we presented a novel speech feature extraction procedure, for deployment with recognition systems operating under various noise types and different levels of SNR. Results showed that The PNRF
(PNRF_soft and PNRF_mst) features improved
efficiently average recognition accuracy, especially at low SNRs level (-5 to 5dB). PNRF features give better performance than MFCC and MFPSCC features.
Acknowledgement
This work was supported by LASA laboratory of university Annaba algeria. The authors would like to thank Professor Mouldi Bedda for Helpful discussion.
References
[1] K.K. Paliwal and L. Alsteris, Usefulness of Phase
Spectrum in Human Speech Perception, Proc.
Eurospeech, pp. 2117-2120, 2003.
[2] D. Zhu and K. Paliwal, Product of power spectrum and group delay function for speech recognition,
Proc ICASSP 2004, pp. I-125 I-128, 2004.
[3] Y. Gong, Speech recognition in noisy environments: A survey, Speech Communication, vol. 16, No. 3, pp. 261-291, 1995.
[4] B. Kotnik, Z. kacic and B. Horvat, The usage of wavelet packet transformation in automatic noisy speech recognition systems, IEEE, Eurocon 2003, Slovinia, vol. 2, No. 2, pp. 131-134, 2003.
[5] L. Birgé, P. Massart, From model selection to adaptive estimation, in D. Pollard (ed), Festchrift for L. Le Cam, Springer, vol. 7, No. 2, pp. 55-88, 1997. [6] D. L. Donoho, De-noising by Soft-thresholding,
IEEE Trans. Inform Theory, Vol. 41, No. 3, pp. 613-627, May 1995.
[7] D. L. Donoho, Nonlinear Wavelet Methods for Recovering Signals, Images, and Densities from
Indirect and Noisy Data, Proceedings of Symposia in Applies Mathematics. Vol. 47, pp. 173-205, 1993. [8] M. N. Stuttle, M.J.F. Gales , AMixture of Gaussians
Front End for Speech Recognition, Eurospeech 2001, pp. 675-678, Scandinavia, 2001.
[9] J. Potamifis, N. Fakotakis, G. Kokkinakis,
Improving the robustness of noisy MFCC features using minimal recurrent neural networks, Neural Networks, IJCNN 2000, Proceedings of the IEEE-INNS-ENNS International Joint Conference on, vo1.5, pp. 271-276, 2000.
[10]S. Young, The HTK Book, Cambridge University Engineering Department, Cambridge, UK, 2001. [11]B. Carneno and A. Drygajlo, Perceptual speech
coding and enhancement using frame-synchronized fast wavelet-packet transform algorithms. IEEE Trans. Signal Process. 47 (6), pp.1622-1635, 1999. [12]I. Pinter, Perceptual wavelet-representation of
speech signals and its application to speech enhancement. Comput. Speech Lang. vol. 10, pp. 1- 22, 1996.
[13]E. Zwicker, E. Tergardt, Analytical expressions for critical-band rate and critibandwith as a function of frequency. JASA68, pp. 1523-1525, 1980.
[14]M. Jansen, Noise reduction by wavelet thresholding. New York: Springer-Verlag, New York. 2001. [15]A. Varga, , H. Steeneken, , M. Tomlinson, D. Jones,
The NOISEX-92 study on the effect of additive noise on automatic speech recognition, Technical report, DRA Speech Research Unit, Malvern, England,
1992. Available from: