Evaluation of the Use of AHRQ and Other
Quality Indicators
Evaluation of the Use of AHRQ and Other
Quality Indicators
Prepared for:
Agency for Healthcare Research and Quality U.S. Department of Health and Human Services 540 Gaither Road
Rockville, MD 20850
www.ahrq.gov
Contract No. WR-426-HS Prepared by:
RAND Health
Authors
Peter S. Hussey Soeren Mattke Lindsey Morse M. Susan Ridgely
AHRQ Publication No. 08-M012-EF December 2007
P A P E R
Evaluation of the Use of
AHRQ and Other Quality
Indicators
PETER S. HUSSEY, SOEREN MATTKE, LINDSEY MORSE, AND M. SUSAN RIDGELY
WR-426-HS October 2006
Prepared for the Agency for Healthcare Research and Quality
This product is part of the RAND Health working paper series. RAND working papers are intended to share researchers’ latest findings and to solicit informal peer review. They have been approved for circulation by RAND Health but have not been formally edited or peer reviewed. Unless otherwise indicated, working papers can be quoted and cited without permission of the author, provided the source is clearly referred to as a working paper. RAND’s publications do not necessarily reflect the opinions of its research clients and sponsors.
SUMMARY
Public recognition of health care quality issues has spiked remarkably in the past ten years, driven by a series of high-profile reports from the Institute of Medicine (IOM), the RAND Corporation, and other organizations. 1, , ,2 3 4 These reports showed, among other facts, that preventable medical errors in hospitals result in as many as 98,000 deaths per year; preventable medication errors occur at least 1.5 million times per year; and on average, only 55% percent of recommended care is delivered. In response, a variety of stakeholders from across the spectrum of health care delivery – including providers, professional and hospital associations, accreditation organizations, employers and business groups, insurance
companies, and state and federal governments – have focused on monitoring and improving the quality of care. These efforts have focused on avoiding unnecessary deaths and poor health, while also encouraging better quality and value for health care spending. In the current environment, the quality of health care is increasingly recognized as a product of systems, not individuals, and there is widespread agreement that systematic measurement, monitoring, and reporting are needed to make meaningful advances in improving quality.
Health care quality indicators provide an important tool for measuring the quality of care. Indicators are based on evidence of “best practices” in health care that have been proven to lead to improvements in health status and thus can be used to assess, track, and monitor provider performance. While the results of quality measurement were originally not typically shared outside the provider organization conducting the quality improvement project, more recent assessments using the indicators have been included in public reports intended to steer patients toward higher-quality care and drive providers to improve their scores in order to bolster their public reputation. Indicators have also been used to link quality of care to financial incentives, either in the form of pay-for-performance (i.e., paying more for good performance on quality metrics), or in the form of tiered insurance products, which steer patients towards higher-quality providers by charging higher copayments for visits to providers with poorer quality scores.
The Agency for Healthcare Research and Quality (AHRQ) has been a pioneer in the development of health care quality indicators. In 1994 its Healthcare Cost and Utilization Project (HCUP) developed a publicly available set of quality indicators for hospital care based on discharge data. AHRQ updated the HCUP indicators in 2001, which were then
renamed the AHRQ Quality Indicators (AHRQ QIs). Today, AHRQ maintains four sets of QIs: 1) Inpatient Quality Indicators (IQIs), which reflect the quality of care provided in hospitals; 2) Patient Safety Indicators (PSIs), which reflect potentially avoidable
complications or other adverse events during hospital care; 3) Prevention Quality Indicators (PQIs), which consist of hospital admission rates for 14 ambulatory care-sensitive
conditions; and 4) Pediatric Quality Indicators (PDIs), which combine components of the PSIs, IQIs, and PQIs, as applied to the pediatric population. The AHRQ QIs are publicly distributed and supported by AHRQ, with regular updates. They are widely used by a variety of organizations for many different purposes. Meanwhile, many other organizations, both public and private, have developed and used their own sets of quality indicators.
Given the rapid growth of and robust demand for quality indicators, it is important to assess the position of the AHRQ QIs in the quality indicator “market.” Who is using the AHRQ QIs today, and for what purposes? What have users’ experiences been, and what unmet needs do they still have? Who else is developing and/or distributing indicators similar to the AHRQ QIs? Most importantly, what has been the impact of the AHRQ QIs on the quality of care delivered to patients? To answer these and related questions, the RAND Corporation was asked to conduct a one-year evaluation to assess user experiences with the AHRQ QIs and to identify users of other quality indicators, vendors of quality measurement products using the AHRQ QIs, and developers of quality indicators
comparable to the AHRQ QIs. The results of this study are intended to inform decisions by AHRQ on future priorities for the QI program.
This report has three main objectives:
1. Provide an overview of the market for the AHRQ QIs as well as indicators and quality measurement tools developed by other organizations that are similar to the AHRQ QIs or that incorporate the AHRQ QIs.
2. Provide an overview of the range of ways in which the AHRQ QIs are used by various organizations.
3. Assess the market demand for the AHRQ QIs, identify unmet needs, and discuss implications for future activities by AHRQ.
THE MARKET AND USES FOR AHRQ QIs
While AHRQ has developed four sets of QIs, all the QIs share certain key characteristics.
• Based on administrative data. The AHRQ QIs are based on hospital discharge data and can be used with existing hospital administrative databases.
• Outcome-focused. Most of the AHRQ QIs reflect health care outcomes, not the rates at which evidence-based processes of care are followed.
• Hospital-focused. Most of the indicators focus on inpatient care, and all of the indicators are based on hospital data.
• Reviewed for scientific soundness. The AHRQ QIs were tested by the Evidence-Based Practice Center at the University of California San Francisco and Stanford University, and detailed documentation of technical information is available in the public domain.
• Available for public use. The AHRQ QIs and associated code for SAS, SPSS,a and
Windows are publicly available for download at no cost to the user.
To understand the market for the AHRQ QIs, we conducted a series of interviews with users of AHRQ QIs, users of other products, developers of similar indicator sets, and vendors of quality measurement products that include AHRQ QIs. This review found that the AHRQ QI program fills a unique niche in the market for QIs since there are no other sources of hospital care quality indicators that represent both a national standard and are also publicly available, transparent, and based on administrative data. Many of our interviewees stressed that the AHRQ QIs fill an important void in this respect.
AHRQ’s unique place in the market for quality indicators has led to a wide
proliferation of uses for the AHRQ QIs. Our environmental scan of users of the AHRQ QIs identified 114 users of the indicators and a range of different uses, including public
reporting, quality improvement/benchmarking, pay-for-performance, and research. The most common uses of the AHRQ QIs include:
• Research. We identified 43 uses of the AHRQ QIs for research. For example, Leslie Greenwald and colleagues used the AHRQ QIs to compare the quality of care provided in physician-owned specialty hospitals and competitor hospitals.5
• Quality improvement. We identified 23 organizations that use the AHRQ QIs as part of a quality improvement activity, including reports benchmarking performance against peers, but do not release the quality information into the public domain.
• Public reporting. We identified 20 organizations using the AHRQ QIs for public reporting. We classified an activity as “public reporting” if a publicly available report was published that compares AHRQ QI results between hospitals (IQIs and PSIs) or geographic areas such as counties (PQIs).
• Pay-for-Performance. We identified 4 organizations that are using the AHRQ QIs in pay-for-performance programs. Three were health plans and one was a Centers for Medicare and Medicaid Services (CMS) demonstration project.
As part of our environmental scan for users of the AHRQ QIs, we conducted a limited review of international uses. We found that the most visible current endeavor that attempts to make use of the AHRQ QIs is the Organization for Economic Cooperation and Development’s (OECD) Health Care Quality Indicators (HCQI) Project. The OECD is an intergovernmental economic research institution headquartered in Paris, France, with a membership of 30 developed countries that share a commitment to democratic government and the market economy. The organization recently convened a meeting to work on the development and implementation of QIs at the international level. Preliminary discussions indicate that there is interest in using the AHRQ QIs internationally as well as sufficient data and technical capability to implement them.
KEY FINDINGS
The results of our interviews and environmental scan focused on four key factors that can be used as criteria for evaluating quality indicators: importance, usability, scientific soundness, and feasibility.
Importance
Nearly all of the organizations interviewed stressed the importance of the AHRQ QI program. AHRQ was frequently mentioned as a “national leader” in measurement
development and research. Many interviewees stated very strongly that they rely on AHRQ as one of the only sources for publicly available, transparent indicators based on readily available data. They stressed that without the AHRQ QIs, they would have few alternatives and would likely have to drastically change or eliminate their quality reporting and/or
measurement activities. Interviewees generally felt that it was important that a federal agency like AHRQ, which is regarded as credible and respected, develop and support a quality indicator set for public use. AHRQ’s credibility and the transparency of the AHRQ QI methods were considered to be key in overcoming opposition to quality measurement and reporting by stakeholders, particularly providers. Overcoming this type of opposition is particularly important for public reporting and pay-for-performance initiatives, where providers’ reputations and revenues are at stake.
Although only one organization in our interviews had formally measured the impact of AHRQ QIs on the quality of care delivered to patients, many interviewees provided anecdotal evidence of the effect of the use of indicators on quality. When asked whether they had measured the impact of using the AHRQ QIs, many interviewees responded that indicator use began too recently to allow for observation of any impact. However, many interviewees reported anecdotally that their or their clients’ use of the AHRQ QIs was having some type of impact on quality of care. The impacts observed usually consisted of an activity such as putting a new quality improvement process in place, rather than an
improvement in outcomes.
Scientific Soundness
On the whole, our interviewees were impressed by the quality and level of detail of the AHRQ documentation on the face validity of the indicators and stated that the indicators captured important aspects of clinical care. Very rarely were indicators challenged on
conceptual grounds. Users largely felt that the AHRQ QIs can be reliably constructed from hospital discharge data, but that there was a certain learning curve during which hospital coding departments had to adjust to the requirements for the QIs. Thus far, coders had mainly been trained to apply coding rules to fulfill reimbursement requirements, but now they had to understand that coding practices also had implications for quality reporting. In selected instances, we heard concerns about ambiguity in the coding rules that would not provide sufficient guidance on whether to code an indicator-relevant diagnosis.
Sample size issues (whether due to the rarity of certain procedures or the infrequency with which some procedures are conducted at certain facilities) were repeatedly mentioned as a threat to the validity of the indicators, particularly the PSIs. Most users stated that the indicators were correctly operationalized within the constraints of the underlying data source. Isolated findings of specification errors were brought to our attention, but interviewees emphasized that AHRQ was always able to address those quickly. The limitations of administrative data were frequently mentioned as a threat to validity.
Usability
Most interviewees stated that the AHRQ QIs provide a workable solution for their needs and were very appreciative of the support that the AHRQ QI team provides for implementation and ongoing use. Despite these overall favorable impressions of the usability of the QIs, three needs related to their usability for reporting were raised repeatedly:
development of reporting templates, development of composite indicators, and clearer guidance on the use of the AHRQ QIs for public reporting and pay-for-performance programs.
Standard reporting format. Nine of 54 interviewees highlighted the need for a standard format for reporting AHRQ QI results as a top priority. At the simplest level, some interviewees requested AHRQ-supported, standard, basic names for the AHRQ QIs in plain language, as some of the current indicator names are difficult for non-clinical audiences to understand. Other interviewees expressed a desire for more guidance and support on other aspects of presentation.
Composite indicators. Twelve of 54 interviewees expressed a desire for an AHRQ-supported methodology for constructing a composite indicator. Forming composites would allow the results to be summarized into one statistic, which is easier to grasp and
communicate, in particular for non-expert audiences. Composites would also overcome sample size limitations, as indicators could be pooled.
Guidance on using AHRQ QIs for public reporting and pay-for-performance. Interviewees who are currently using the AHRQ QIs for public reporting and pay-for-performance generally felt that they provided a workable basis for their activities. Still, interviewees stated that additional standards and guidance on the reporting of AHRQ QI results were needed. Many interviewees expressed dissatisfaction with the current AHRQ guidance on the appropriateness of the AHRQ QIs for public reporting. They felt that clearer guidance from AHRQ would help to counter opposition from those who argue that the AHRQ QIs should only be used for quality monitoring and improvement and research, but not as a public reporting or pay-for-performance tool. Taking the opposing view were several interviewees (mostly hospitals) who would like to see AHRQ make a clear statement that the AHRQ QIs are not appropriate for use in public reporting, pay-for-performance, or other reporting activities because of the limitations of the underlying administrative data.
Feasibility
We were told consistently that a major advantage of the AHRQ QIs was the feasibility of their implementation. They require only administrative data in the UB-92 format to which many users have routine access, since those data are already being used for billing and other administrative purposes and have to be collected and reported by hospitals in most states.
Interviewees emphasized that another substantial advantage of the AHRQ QIs is that the indicators have clearly defined and publicly available specifications, which helps with implementation of measurement. These specifications were regarded as of particular importance for hospitals, as the originators of the data, because the specifications enable hospitals to work with their coding departments to ensure that the required data elements were abstracted from medical records consistently and with high reliability. In addition, users who analyze data with the QIs, such as researchers, appreciated the fact that they could dissect the indicator results and relate them back to individual records. That ability helped researchers gain a better understanding of the indicator logic and distinguish data quality issues from actual quality problems.
LESSONS LEARNED FOR FUTURE ACTIVITIES
Interviewees’ perspectives provided lessons in three areas: current, anticipated, and potential development projects involving the QIs; AHRQ’s role as a measures developer and the ways in which users speculate this role could evolve; and market demand for quality indicators, in particular, user willingness to pay for QIs.
Priorities for Future Development of QIs
We asked interviewees to prioritize three categories of AHRQ development projects: (1) improvements in the current QI product line, (2) addition of new product lines, and (3) improved support for the QI products. Improving the current products was most frequently seen as the highest priority, followed by both the addition of new products and
improvements in service, outreach, and user support for the measures. The most commonly requested improvement to the current QIs was the addition of data elements to the QI specifications, notably a flag for conditions present on hospital admission (currently in development by AHRQ), a flag for patients under do-not-resuscitate orders, and clinical data elements. The most commonly requested new product line was indicators of ambulatory care. As far as service improvements, the most frequently mentioned activities were a template and guidance for public reporting of the QIs, and guidance on next steps in quality improvement following identification of a potential quality problem using the QIs.
The Future Role of AHRQ Compared to Other Players
Our interviewees held AHRQ in very high regard. The work of the AHRQ QI team was described as technically sound, sensitive to the limitations of the underlying data, and transparent. AHRQ is regarded as an intellectual leader and “go-to” institution for health services research and the use of administrative data for hospital quality measurement. Several other organizations, especially the Joint Commission on Accreditation of Healthcare
Organizations (JCAHO), CMS, the Hospital Quality Alliance (HQA), and the Leapfrog Group, are seen as prominent sources for measures, but their indictors are generally regarded as complements to the AHRQ QIs. Interviewees were quite comfortable with AHRQ having a leading role in national quality indicator development. It was generally viewed as positive that a trustworthy federal institution had defined open-source and well-documented quality measurement standards. These standards were viewed as contributing to the transparency of health care quality measurement and reducing the measurement
burden for health care providers by limiting the number of measurement tools they must use to satisfy various reporting requirements.
We discussed whether it could be a viable option for AHRQ to give up parts of the current QI program in order to free up resources and set different priorities. Almost unanimously, interviewees rejected a model under which AHRQ would develop and distribute the QI software without supporting it. We received mixed reactions to a model under which AHRQ would develop and release indicators and their technical specifications, but no longer provide or support software. Interviewees were generally wary of the idea of delegating user support and/or software development and distributions to vendors, fearing that vendors would be prohibitively expensive or incapable of providing the same quality of support as the original developers.
Willingness to Pay for the AHRQ QIs
As an alternative to AHRQ realigning current funds, we asked interviewees whether AHRQ might consider financing program growth by generating additional revenues by charging users. Not unexpectedly, this proposal was not met with enthusiasm. However, almost half of interviewees (44%) were willing to pay a “reasonable fee” for access to the full QI resources.
DISCUSSION Limitations
The majority of the interviewees in this evaluation were users of the AHRQ QIs. Non-users may have more negative opinions of the AHRQ QIs. The few non-users we did interview did not have express substantially negative opinions about the AHRQ QI program, but a larger sample of non-users may have produced different results. This study also
focused on uses of the AHRQ QIs that were publicly discussed or released, so that the results likely do not fully reflect the use of AHRQ QIs for non-public uses such as confidential quality improvement activities by hospitals.
What is AHRQ’s Current Market Position?
The AHRQ QIs have achieved a strong position in their market segment and no obvious alternative or competitor could be identified, although some organizations (notably
JCAHO, CMS, HQA, and Leapfrog) have complimentary indicator sets. This is unlikely to change: new users have an incentive to adopt the prevailing product, because it makes their results comparable to a large number of other users. Widespread use lends legitimacy to the product, which is critical in the often-politicized debates about selecting quality indicators for public reporting and pay-for-performance.
Where are the Growth Opportunities for the AHRQ QI Program?
There are now a substantial number of users of the AHRQ QIs for public reporting and pay-for-performance programs. As the prevalence of those activities increases, we expect the number of users to increase substantially both for the programs themselves and for internal quality improvement programs and projects that will attempt to align their target measures with standards for external accountability. Our interviewees wanted expansion of the AHRQ QI program. They were largely aware and appreciative of AHRQ’s current efforts to improve and expand the program, but expressed an interest in scaling up, and speeding up, those activities.
How Could Growth Be Financed?
Most interviewees stated that federal funding should be used to support future AHRQ QI activities, even though they realized that this was a difficult proposition given the pressure on public budgets in general, and on AHRQ’s budget in particular. Interviewees were reluctant to see AHRQ give up software development and/or user support. As an alternative, we discussed the option of AHRQ continuing to provide specifications, software and user support but starting to charge for those services. While there was little enthusiasm for user fees, only a few stated that they would stop using the AHRQ QI product in that case. Most interviewees seemed to be willing to pay a “reasonable” amount. However, if AHRQ were to implement a charge-based model for the QIs, it would face the challenge of finding a business model that would generate sufficient revenue and still be consistent with AHRQ’s mission and values as a public agency.
LIST OF SYMBOLS Symbol Definition ACOG AHRQ AMI APR-DRGs BCBSMA CMS CHSC DFW DFWHC DI DRGs DVT EC ESQH ETGs GIC HCQI HCUP HQA ICD-9-CM IHI IOM
American College of Obstetricians and Gynecologists Agency for Healthcare Research and Quality
Acute myocardial infarction
All patient refined diagnosis related groups Blue Cross Blue Shield of Massachusetts Centers for Medicare and Medicaid Services Center for Studying Health System Change Dallas-Fort Worth
Dallas-Fort Worth Hospital Council DFWHC Data Initiative
Diagnosis related groups Deep vein thrombosis European Commission
European Society for Quality in Healthcare Episode Treatment Groups
Group Insurance Commission (State of Massachusetts) Health Care Quality Indicators Project
Healthcare Cost and Utilization Project Hospital Quality Alliance
International Statistical Classification of Diseases and Related Health Problems – Version 9 – Clinical
Modification
Institute for Healthcare Improvement Institute of Medicine
ISQua JCAHO
IQIs Mass-DAC MHA MQIP NQF OECD
PDIs PE PQIs PSIs QI THCIC VBAC WHO
International Society of Quality in Healthcare Joint Commission on Accreditation of Healthcare Organizations
Inpatient Quality Indicators
Massachusetts Data Analysis Center Maryland Hospital Association Maryland Quality Indicators Project National Quality Forum
Organization for Economic Cooperation and Development
Pediatric Quality Indicators Pulmonary embolism
Prevention Quality Indicators Patient Safety Indicators Quality indicator
Texas Health Care Information Collection Vaginal birth after cesarean section
1. INTRODUCTION
1.1 BACKGROUND
Public recognition of health care quality issues has spiked remarkably in the past ten years, driven by a series of high-profile reports from the Institute of Medicine (IOM), the RAND Corporation, and others.6, , ,7 8 9 These reports showed, among other facts, that preventable medical errors in hospitals result in as many as 98,000 deaths per year;
preventable medication errors occur at least 1.5 million times per year; and on average, only 55% percent of recommended care is delivered.
In response, a variety of stakeholders from across the spectrum of health care delivery – including providers, professional and hospital associations, accreditation organizations, employers and business groups, insurance companies, and state and federal governments – have focused on monitoring and improving the quality of care. A primary goal has been to avoid unnecessary deaths and poor health – at a minimum, to “first do no harm” by limiting the amount of injury incurred by health care itself. Another strong motivation has been the increasing recognition that value for money is poor in the health care system. Health care costs are high and have been increasing rapidly, without the level or improvement in quality that is expected by those paying the costs.
In this environment, there is widespread agreement that “business as usual” – i.e., exclusively relying on providers to self-police the quality of care they provide without systematic measurement, monitoring, and reporting – is no longer adequate for improving the quality of care.10 Quality is increasingly recognized as a product of systems, not
individuals, and attention has focused on how to analyze and redesign those systems. A consensus has emerged that although solutions will not be easy, “a key component of any solution… is the routineavailability of information on performance at all levels” 11 – that is, “quality of care should be measuredand reported routinely at both the national and
provider-specific(e.g., hospital and physician) levels.”12 More simply, “that which cannot be measured is difficult to improve.”13
There are a variety of measurement-based approaches to improving quality. The most widespread and longest-used approach, referred to in this report as “quality improvement,” is an internal effort by providers or other organizations to measure quality of care, identify
areas of weakness, devise and implement changes, and monitor the effects of the changes. As results are typically not shared outside of the organization that conducts the quality improvement project, this approach can be viewed as formalization of the traditionally prevailing model of improving quality – mutual peer review. More recently, calls for external accountability of health care providers have led to two types of quality monitoring
approaches. One is public reporting of quality of health care providers.b These reports can
steer patients to higher-quality care and drive providers to improve their scores in order to bolster their professional reputation. The other one is linking quality of care to financial incentives, either in the form of pay-for-performance (paying more for good performance on quality metrics) or in the form of tiered insurance products, which steer patients towards higher-quality providers by charging higher copayments for visits to providers with poorer quality scores.
These efforts all depend on reliable, valid, and agreed-upon ways to measure the quality of care. However, health care quality is difficult to measure, in particular because there are many factors contributing to outcomes of health care in addition to the actual quality of the care provided. Many of these factors – for example, patient compliance with treatment – are largely out of providers’ control. Despite this and other difficulties, much progress has been made in the science of quality measurement. The underlying knowledge base has greatly expanded. The science of measuring health status has improved, as has the evidence supporting “best practices” that have been proven to lead to improvements in health status. This evidence base has allowed for the development of numerous quality indicators, which then have been tested for reliability, validity, ease of use, and usefulness for improving quality. The quality indicators fall into two main categories: counts of inputs or actions that are known to lead to better health outcomes (“structure” and “process” measures in Donabedian’s classic quality measurement framework),14 and direct
measurements of the outcomes of care (“outcomes”). Unfortunately, many of the most rigorous measures are also the most difficult to implement due to their burden of data collection. The data needed for quality measurement must be collected specifically for that purpose, abstracted from (usually) paper medical records, or abstracted from existing
electronic data that have been collected for other purposes, notably billing. However, as will
b Quality comparisons have been made between states, health plans, nations, etc. in addition to between
be shown in this report, there is now a small but growing arsenal of well-tested quality indicators that can be used with existing data sources or data collection processes.
The Agency for Healthcare Research and Quality (AHRQ) was one of the pioneers of quality indicator development. As early as 1994, its Healthcare Cost and Utilization Project (HCUP) developed a publicly available set of quality indicators for hospital care based on discharge data. Congress later tasked AHRQ with developing an annual report on the quality of health care in the United States, the National Healthcare Quality Report.15 In preparation for this report, in 2001 AHRQ invested in an update of the HCUP indicators, which were renamed the AHRQ Quality Indicators (AHRQ QIs).16 Indicators of patient safety were added in 2002.17 The AHRQ QIs and associated computer code are now publicly distributed and supported by AHRQ, with regular updates.18 They are widely used by a variety of organizations for many different purposes. Meanwhile, many other
organizations, both public and private, have developed and used their own sets of quality indicators.
Given the rapid growth of and robust demand for quality indicators, it is important to assess the position of the AHRQ QIs in the quality indicator “market.” Who is using the AHRQ QIs today, and for what purposes? What have users’ experiences been, and what are their unmet needs? Who else is developing and/or distributing indicators similar to the AHRQ QIs? Most importantly, what has been the impact of the AHRQ QIs on the quality of care delivered to patients?
To understand the answer to these and related questions, the RAND Corporation was asked to conduct a one-year evaluation to assess user experiences with the AHRQ QIs, and to identify users of other quality indicators, vendors of quality measurement products using the AHRQ QIs, and developers of quality indicators comparable to the AHRQ QIs. The results of this study are intended to inform decisions by AHRQ on future priorities for the QI program.
1.2 DESCRIPTION OF THE AHRQ QUALITY INDICATORS (AHRQ QIs)
AHRQ has developed several types of QIs, all of which share certain core characteristics. There are currently four sets of AHRQ QIs:
1. Inpatient Quality Indicators (IQIs). There are 32 IQIs reflecting the quality of care provided in hospitals. The indicators fall in four categories.
• The first category includes the in-hospital mortality rates for seven specific medical conditions. The conditions were selected because their mortality rates were shown to vary across providers and because evidence indicates that the mortality risk for those conditions may depend on quality of care. The mortality rates, adjusted for patient risk, can be compared to those of other providers or to other benchmarks, with lower rates indicating better quality.
• The second category includes the in-hospital mortality rates for eight surgical procedures. Like the condition-specific mortality rates, the procedures were chosen because their mortality risk was known to vary across providers and because evidence indicates that mortality for those procedures may be associated with inferior quality of care. The mortality rates can be benchmarked, and lower rates are better.
• The third category includes utilization rates for eleven procedures for which there is potential for overuse, underuse, or misuse. Four of the utilization rates were designed for comparisons between geographic areas (either counties or Office of Management and Budget Metro Areas), not hospitals. The rates are measured as the number of procedures performed divided by the total number of patients who were potential candidates for that
procedure. Utilization rates that are much higher or lower than benchmarks may point to poor quality. The direction of the indicator – i.e., whether higher or lower rates are desirable – depends on the condition. For
example, Cesarean delivery has been identified as an overused procedure, so lower rates indicate better quality (IQI 21). In contrast, vaginal delivery following a previous Cesarean delivery (VBAC) is considered an underused procedure, so higher rates indicate better quality (IQI 34).
• The fourth category includes indicators of the hospital-level volume for six complex procedures for which research suggests a positive impact of case volume on patient outcomes. The procedure volume therefore provides an indirect indication of the provider’s expected outcome for the procedure.
The indicators are simple counts of the number of times that the procedures are performed per year. These counts can be compared to thresholds for the minimum annual volume of procedures that providers should perform to ensure an acceptable level of quality. The volume thresholds are based on published research.
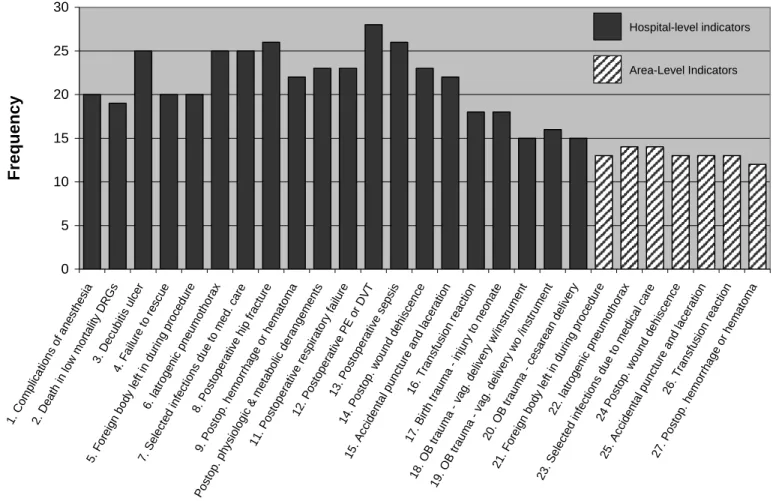
2. Patient Safety Indicators (PSIs). The PSIs contain 27 indicators of potentially-avoidable complications or other adverse events related to hospital care. For example, an infection resulting from medical treatment (PSI 7) is considered an avoidable complication, and the rate of surgical instruments or other “foreign bodies” left in the patient following surgery (PSI 5) is considered a preventable adverse event. The indicators are measured as the number of complications or adverse events divided by the total number of patients at risk for those events. Twenty of the indicators were designed for comparisons between hospitals, and the remaining 7 were designed for comparisons between geographic areas (either counties or Office of Management and Budget Metro Areas).
3. Prevention Quality Indicators (PQIs). The PQIs are based on the hypothesis that appropriate ambulatory care can help to prevent hospital admissions for some conditions. The indicators consist of hospital admission rates for 14 of these ambulatory care-sensitive conditions and are intended for comparisons of geographic areas. Unlike the other AHRQ QIs, they do not reflect quality of hospital care, but the quality of ambulatory care. The indicators are measured as condition-specific admission rates (e.g., the number of admissions for urinary tract infection per 100,000 people living in a Metro Area or county). Each admission to the hospital reflects a failure in the delivery of appropriate care outside the
hospital, so lower rates reflect better quality.
4. Pediatric Quality Indicators (PDIs). The PDIs contain 18 indicators, each of which is similar to a comparable type of IQI, PQI, or PSI, except that the PDIs in each case refer to the pediatric population. Since these indicators were released during the course of this study, they were not included in the analysis. Several of the PDIs were formerly included in the AHRQ IQI, PSI, and PQI sets. Most of the issues raised in this report would generalize to the PDIs.
• Based on administrative data. The AHRQ QIs are based on hospital discharge data that are collected using the UB-92 standardized claim reporting form and used mainly for billing purposes. The indicators can be used with existing hospital administrative databases, including the HCUP National Inpatient Sample and Medicare MedPAR data.
• Outcome-focused. Most of the AHRQ QIs reflect health care outcomes, and not the rates at which evidence-based processes of care are followed. The exceptions are the subset of IQIs which reflect utilization or volume of services.
• Hospital-focused. Most of the indicators focus on inpatient care, and all of the indicators are based on hospital data. The PQIs reflect the quality of ambulatory care, but the measurement focuses on admissions to the hospital that could have been prevented given appropriate, effective ambulatory care.
• Reviewed for scientific soundness. The AHRQ QIs were tested by the Evidence-Based Practice Center at the University of California San Francisco and Stanford University. Detailed documentation of technical information, including the methodology, evidence base, and measurement properties of the indicators, is available in the public domain.
• Available for public use. The AHRQ QIs and associated code for SAS, SPSS,c and
Windows are available for public download at no cost to the user. User support is also provided free of charge.
The AHRQ QIs were originally designed to be used for research and quality improvement activities.19 However, as examples included in this report demonstrate, the QIs are now used for a variety of other purposes, including public reporting,
pay-for-performance, and segmenting providers for tiered insurance products. AHRQ has evaluated and endorsed the use of the QIs for these new purposes, given certain caveats.20
1.3 OBJECTIVES
This report has three main objectives:
1) Provide an overview of the market for the AHRQ QIs as well as indicators and quality measurement tools developed by other organizations that are similar to the AHRQ QIs or that incorporate the AHRQ QIs.
2) Provide an overview of the range of ways in which the AHRQ QIs are used by various organizations.
3) Assess the market demand for the AHRQ QIs, identify unmet needs, and discuss implications for future activities by AHRQ.
1.4 ORGANIZATION OF THE REPORT
The remainder of this report is divided into six sections. Section 2 outlines the
methodology used in our evaluation. Section 3 assesses the market for quality indicators and AHRQ’s role in that market. Section 4 evaluates the AHRQ QI program on the dimensions of importance, scientific soundness, usability, and feasibility. Section 5 presents two case studies of how the AHRQ QIs are used in particular market areas. Section 6 summarizes lessons learned, and Section 7 concludes with a discussion of the implications of the evaluation for the future of the AHRQ QI program.
2. METHODS
In this chapter we describe the methods used in this study. There are three main components to our approach: an environmental scan to identify and catalog users of the AHRQ QIs and developers or vendors of similar projects; a series of interviews with individuals and organizations who use AHRQ or other QIs to understand how and why QIs are used, and what improvements, if any, users might like to see; and case studies to illustrate how QIs are used in two particular geographic areas.
2.1 ENVIRONMENTAL SCAN
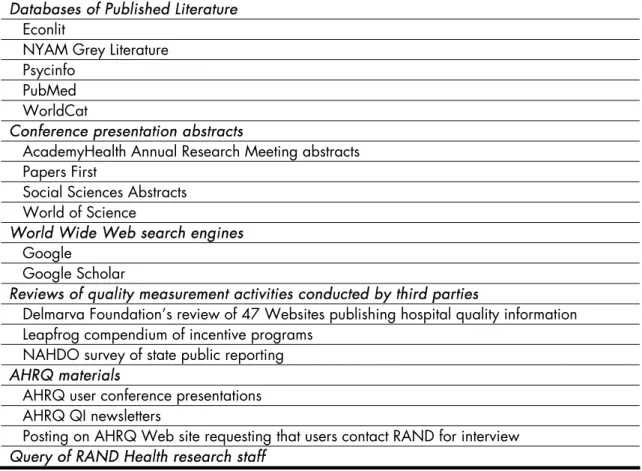
We conducted an environmental scan to identify four types of organizations: (1) users of the AHRQ QIs; (2) “non-users,” i.e., organizations that are using an alternative to the AHRQ QIs; (3) developers of similar sets of quality indicators; and (4) vendors of quality measurement products that may or may not include AHRQ QIs. The following six types of sources were used:
1) Databases of published literature 2) Conference presentation abstracts 3) World Wide Web search engines
4) Reviews of quality measurement activities conducted by third parties 5) AHRQ materials
6) Query of RAND Health research staff
Table 2.1. Sources Queried in Environmental Scan Databases of Published Literature
Econlit
NYAM Grey Literature Psycinfo
PubMed WorldCat
Conference presentation abstracts
AcademyHealth Annual Research Meeting abstracts Papers First
Social Sciences Abstracts World of Science
World Wide Web search engines Google
Google Scholar
Reviews of quality measurement activities conducted by third parties
Delmarva Foundation’s review of 47 Websites publishing hospital quality information Leapfrog compendium of incentive programs
NAHDO survey of state public reporting AHRQ materials
AHRQ user conference presentations AHRQ QI newsletters
Posting on AHRQ Web site requesting that users contact RAND for interview Query of RAND Health research staff
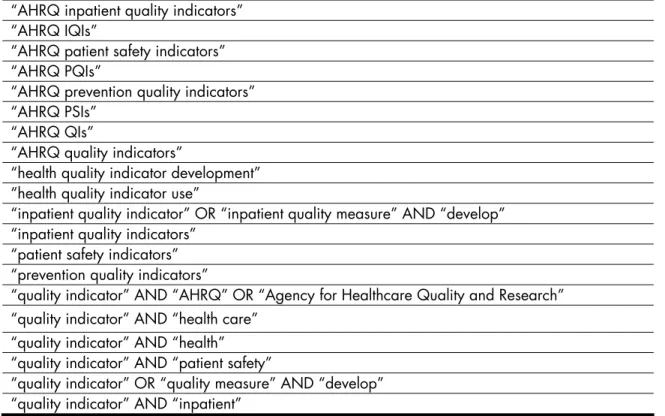
Table 2.2. Search Queries Used in Environmental Scan “AHRQ inpatient quality indicators”
“AHRQ IQIs”
“AHRQ patient safety indicators” “AHRQ PQIs”
“AHRQ prevention quality indicators” “AHRQ PSIs”
“AHRQ QIs”
“AHRQ quality indicators”
“health quality indicator development” “health quality indicator use”
“inpatient quality indicator” OR “inpatient quality measure” AND “develop” “inpatient quality indicators”
“patient safety indicators” “prevention quality indicators”
“quality indicator” AND “AHRQ” OR “Agency for Healthcare Quality and Research” “quality indicator” AND “health care”
“quality indicator” AND “health” “quality indicator” AND “patient safety”
“quality indicator” OR “quality measure” AND “develop” “quality indicator” AND “inpatient”
Each organization identified in the search was entered into a database together with the following information:
• Type of organization (e.g., hospital);
• List of quality indicators used;
• Primary use of quality indicators (research, public reporting, pay-for-performance, quality improvement, vendor, developer);
• Description of other uses of quality indicators;
• Citation;
• Contact information;
• Method of identification.
The environmental scan was used to understand the range of ways in which the AHRQ QIs are being used and to select interview candidates.
2.2 INTERVIEWS
2.2.1 Selection of interviewees
In order to select interview candidates, we first consulted with five members of the AHRQ QI team, which includes both AHRQ staff and contractors. We used information gained from these discussions, together with the results of our environmental scan, to compile a list of potential interviewees. We used the following method to select interviewees from this complete list:
1) We cross-tabulated the environmental scan results by type of organization (hospital association, state government, etc.) and primary indicator use (pay-for-performance, public reporting, etc.) to create a table representing the universe of potential
interviewees.
2) We selected the number of interviewees to be chosen in each type-use cell in order to distribute interviews across cells and ensure multiple interviews per cell where possible.
3) Two of the researchers (PH and SM) reviewed the list of organizations independently and chose interviewees for each cell based on the criteria: (a) maximize the variety of uses and types of organizations within each cell; (b)
maximize the estimated impact of quality indicator activity. The reviewers compared notes and reconciled differences to come to the final list of suggested interviewees to forward to AHRQ.
4) We met with AHRQ staff to discuss the suggested interviewees and incorporated AHRQ staff comments to arrive at the final list.
We then began the process of identifying the most appropriate respondent(s) for each organization. Identification of the most knowledgeable respondent was a multi-stage process. First, we identified an initial contact through available published materials or a telephone call to the organization. We then requested that the individual we contacted forward our interview request to the most appropriate individual(s). Prior to the interview, interviewees were given a fact sheet on the project, information about how the data would be used and assurances about confidentiality, and a list of sample questions similar to those asked during the interviews. All procedures, including verbal consent procedures, were
approved in advance by the RAND Human Subjects Protection Committee, RAND’s Institutional Review Board.
2.2.2 Interview procedures
We created interview guides based on input of AHRQ QI team staff, our own knowledge of the AHRQ QI program, and the results of the environmental scan. Separate guides were created for users of AHRQ QIs, developers of similar products, and vendors of quality measurement products. The interviews covered three main topics:
1) How AHRQ QIs (and other quality indicators) have been used;
2) Experiences (including impact of use and lessons learned) from quality indicator use; 3) Suggestions for future priorities for the AHRQ QI program.
Semi-structured interviews were conducted by telephone by one researcher accompanied by a note-taker. Some interviews were also recorded using a digital voice recorder. Interviewees were guaranteed that none of their responses would be reported in an identifiable format. During the interviews, we made note of any supporting documents mentioned by the interviewees and asked for a copy of the documents at the close of the interview. Interview notes were completed and edited in a timely fashion and data from the interviews and supporting materials were coded into the dimensions in the interview guide and entered into a database for analysis. Quotes published in this report have been
reconstructed from interview notes or recordings and thus in some cases may differ slightly from the exact wording used by the interviewee.
2.2.3 International Users
We took advantage of the (non-project related) participation of one member of the team (SM) in an OECD Expert Group meeting on patient safety. The meeting took place on June 29 and 30, 2006, in Dublin, Ireland. At the meeting, we interviewed five researchers who had used the AHQI QIs in countries other than the United States.
2.3 CASE STUDIES
Based on the results of the first round of interviews, we identified two geographic areas in which to conduct in-depth case studies on the use of AHRQ QI indicators for public reporting. The case study is a research strategy that is used in many settings (e.g., policy, political science, and public administration research; organizational and management studies; planning research; etc.). It is an empirical inquiry in which multiple sources of evidence are used to provide data from which judgments can be made about the usefulness of an approach to a problem and the generalizability of the findings to other sponsoring organizations and markets. We selected two geographic areas (Boston, MA and Dallas-Fort Worth, TX) and identified multiple organizations within each of these markets to provide a full picture of the various perspectives on a common application of AHRQ QIs.
These case studies were designed to refine our notions of the critical variables present in AHRQ QI initiatives; obtain evidence regarding how successful organizations were in developing and implementing QI initiatives; and to document the barriers and facilitators to using AHRQ QIs in real-world health care settings. We first identified organizations for case study interviews by (1) analyzing the results of the environmental scan to identify users of the AHRQ QIs in the two geographic areas; (2) asking for nominations from
representatives of organizations who had already been asked to participate; (3) taking suggestions from AHRQ staff. Detailed notes were taken for each case study. These notes as well as media and policy reports on health policy issues in the geographic areas were used as the basis for the case study analysis.
3. THE MARKET FOR QUALITY INDICATORS
Our environmental scan revealed strong demand for hospital care quality indicators. Demand for indicators for research and quality monitoring is strong and has a relatively long history. Demand is higher and increasing rapidly for quality indicators that can be used for other, newer purposes. These purposes include public reporting to inform consumers’ choice of providers and otherwise drive provider improvement; pay-for-performance to reward high-quality providers; the development of tiered insurance products; and using quality indicators to select a network of providers.
This demand has led to a proliferation of quality indicators. In addition to AHRQ, the market leaders in developing hospital quality indicators are the Centers for Medicare and Medicaid Services (CMS), the Joint Commission on Accreditation of Healthcare
Organizations (JCAHO), the Hospital Quality Alliance (HQA – a collaboration between CMS, JCAHO, and several other organizations), and the Leapfrog Group. In this section, we discuss these and other developers and vendors of quality indicators, and how the quality indicators developed by each of these agencies/organizations compares to the AHRQ QIs. Our environmental scan identified two main categories of players in the market for quality indicators. The first type, “developers,” includes organizations that develop, support, and distribute quality indicators. The second type, “vendors,” includes organizations that develop and/or sell quality measurement products to providers, insurers, and others. Their products often include the AHRQ QIs (or variants thereof), indicators from other
developers, and/or indicators developed by the vendors themselves.
3.1 DEVELOPERS
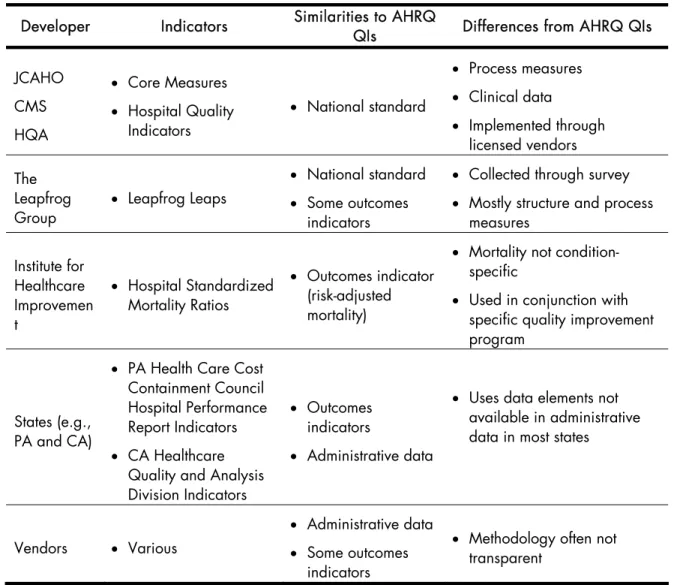
The environmental scan identified 12 organizations that have developed indicators that are similar in some way to the AHRQ QIs. The organizations that have developed indicators that are widely used and focused on hospitals are summarized in Table 3.1 and described below.
Table 3.1. Developers of Quality Indicators and Comparison with AHRQ QIs
Developer Indicators Similarities to AHRQ
QIs Differences from AHRQ QIs
JCAHO CMS HQA
• Core Measures
• Hospital Quality
Indicators
• National standard
• Process measures
• Clinical data
• Implemented through
licensed vendors The
Leapfrog Group
• Leapfrog Leaps
• National standard
• Some outcomes
indicators
• Collected through survey
• Mostly structure and process
measures Institute for
Healthcare Improvemen t
• Hospital Standardized
Mortality Ratios
• Outcomes indicator
(risk-adjusted mortality)
• Mortality not
condition-specific
• Used in conjunction with
specific quality improvement program
States (e.g., PA and CA)
• PA Health Care Cost
Containment Council Hospital Performance Report Indicators
• CA Healthcare
Quality and Analysis Division Indicators
• Outcomes
indicators
• Administrative data
• Uses data elements not
available in administrative data in most states
Vendors • Various
• Administrative data
• Some outcomes
indicators
• Methodology often not
transparent
Source: RAND analysis of environmental scan results
Note: Indicators were judged to be a “national standard” if they were described that way by any of the study’s interviewees.
Although there are similarities between these indicators and those developed by AHRQ, none of the indicators developed by organizations other than AHRQ were
comparable to the AHRQ QIs on all of their major characteristics: based on administrative data, outcome-focused, hospital-focused, based on transparent methodology, and available for public use.
JCAHO/CMS/HQA. Both JCAHO and CMS have developed quality indicators of hospital care for common conditions. CMS’s measures were originally used for quality improvement initiatives conducted by Medicare Quality Improvement Organizations
(QIOs). JCAHO’s Core Measures have been used as part of the JCAHO hospital accreditation process since 2002. They cover five clinical areas: (1) acute myocardial infarction, (2) heart failure, (3) pneumonia, (4) surgical infection prevention, and (5)
pregnancy and related conditions. JCAHO-accredited hospitals choose 3 of these 5 areas for reporting, depending on the services they provide. JCAHO publishes the results of the measures publicly on the Web.21
Since the measures had significant overlap, CMS and JCAHO agreed in 2004 to align specifications for overlapping measures and to maintain them as a shared set of measures. A subset of the joint CMS-JCAHO measures was later selected by the HQA, a public-private partnership for measuring and reporting hospital quality. Their Hospital Quality Measures are now publicly reported on the Web for both accredited and non-accredited hospitals.22 They are also used in other CMS activities such as the Premier pay-for-performance demonstration project.23
Like the AHRQ QIs, the CMS/JCAHO/HQA measures are widely used and viewed as a national standard.d A key difference between those measures and the AHRQ QIs is that
they are largely based on clinical data collected from medical records rather than
administrative data. JCAHO has estimated that collection of the clinical data for the Core Measures takes an average of 22-27 minutes per case for acute myocardial infarction, heart failure, and pneumonia.24 A second key difference is that the CMS/JCAHO/HQA measures are process indicators while the AHRQ QIs are outcome indicators. Another difference is that, while the AHRQ QIs reflect a broad range of conditions, the
CMS/JCAHO/HQA measures currently reflect only five conditions; however, JCAHO and CMS are currently developing indicators in additional clinical areas.
The method used by JCAHO to implement its Core Measures is also different from that used for the AHRQ QIs. Hospitals pay vendors to measure the JCAHO Core Measures on their behalf using standardized specifications. Hospitals have made a wide variety of arrangements with vendors for Core Measure collection and reporting, according to their specific needs and characteristics. All vendors of the JCAHO Core Measures must undergo
d Indicators were judged to be a “national standard” if they were described that way by any of the study’s
a certification process through which JCAHO ensures that they have appropriately implemented the measures.
Due to these differences, the CMS/JCAHO/HQA measures and the AHRQ QIs can be considered complementary in some respects. A number of the users of the AHRQ QIs interviewed (11 of 36) also use the JCAHO/CMS/HQA measures.
The only way in which the CMS/JCAHO/HQA measures and the AHRQ QIs could be considered competitors is as a function of limited hospital resources for quality
measurement. Hospitals are required to report the JCAHO Core Measures for accreditation and may have limited resources for other quality measurement activities, including the AHRQ QIs. One interviewee told us:
AHRQ could do a lot of terrific things with the AHRQ QIs, but facilities are trying to meet requirements right now and don’t have time and resources to work with other quality indicators to the exclusion of what they might like to do. Hospitals are doing only what they have to do – either by mandate or by the market.e
Leapfrog. The Leapfrog Group has developed a set of quality indicators that are widely used and considered to be a national standard. The indicators are intended to improve value in health care purchasing. Provider performance on the indicators is presented in a public report on Leapfrog’s Web site. In addition to developing and
marketing its own quality indicators, Leapfrog operates a pay-for-performance program, the Leapfrog Hospital Rewards Program, which uses JCAHO Core Measures and an efficiency measure in addition to the Leapfrog indicators. The program is implemented through vendors, who pay Leapfrog for every participating hospital, and then charge hospitals accordingly.
Unlike the AHRQ QIs, most of the Leapfrog indicators are not outcome-focused and require primary data collection. The indicators are organized into four content areas called “Leaps”: (1) computerized physician order entry, (2) intensive care unit staffing, (3) high-risk treatments, and (4) safe practices. Data are collected through a survey of hospitals. Leaps 1, 2, and 4 are structure and process indicators, such as use of a computerized physician order entry system or staffing hospital intensive care units with intensivists (physicians who
specialize in critical care medicine). Leap 3 (high-risk treatments) overlaps considerably with
the AHRQ IQIs. It measures procedure volume and risk-adjusted mortality for selected conditions. Leapfrog is currently standardizing its specifications to those used in the AHRQ IQIs in order to minimize the reporting burden for hospitals.
Institute for Healthcare Improvement (IHI). The IHI measures overall hospital mortality as part of its activities to improve hospital quality. This measurement activity is conducted in conjunction with the implementation of a specific set of interventions that are intended to improve quality in participating hospitals. The indicator used is similar to the AHRQ IQIs in that it is based on risk-adjusted mortality associated with hospital stays and is based on the analysis of administrative data. Unlike the AHRQ IQIs, however, the IHI measures the mortality rate for all conditions. Hospital- and area-level characteristics are used in regression models to control for patient risk. This measurement approach originated in the United Kingdom and has also been applied to hospitals in many countries other than the United States.25
States. We also interviewed representatives from California and Pennsylvania, two states that have developed their own methodologies for measuring quality using
administrative data. These states developed their own measurement approaches largely because their public reporting efforts predate the development of the AHRQ QIs. Both states also use data elements that are unavailable in the hospital administrative data collected in most other states. These features include a flag to indicate conditions that were present on hospital admission (California) and detailed data on severity of illness (Pennsylvania). Other states, such as New York, have also developed their own measurement approaches which may predate the AHRQ QIs or use data elements not available in other states.
Vendors. We interviewed several vendors who, in addition to implementing existing measures from other developers in their measurement tools, have also developed proprietary indicators. Some of these indicators are similar to the AHRQ QIs in that they are based on administrative data and are outcomes indicators. The key difference is the definitions and specifications of most vendors’ indicators are proprietary. The vendors’ indicators have also not always been subjected to validation of the same rigor as the AHRQ QIs. In the next subsection, we discuss the vendors identified by the environmental scan in more detail.
3.2 VENDORS
The environmental scan identified 12 vendors of quality measurement products that were determined to include the AHRQ QIs.f These vendors are listed in Table 3.2.
Table 3.2. Vendors of Quality Measurement Products That Include the AHRQ QIs
CareScience Consumers' Checkbook
Health Benchmarks HealthGrades Innovative Health Solutions Mediqual (Cardinal Health)
Medisolv Midas+ Solucient
Subimo
WebMD Quality Services
Source: RAND analysis of environmental scan results
Typically, the AHRQ QIs are included in software tools that are marketed to hospitals for quality improvement or to insurers or business groups for hospital profiling. The
vendors’ products offer additional functionality to the basic AHRQ QI software. For example, the vendors’ measurement tools often include non-quality indicators that inform hospital administration, such as financial performance indicators. The tools are often designed to offer users a variety of reporting options. These measurement tools may be particularly useful for hospitals that do not have the in-house expertise or staff time to construct indicators of quality and other aspects of care from raw data. Similar tools are used by insurance companies and other organizations.
f We attempted to determine whether vendors’ proprietary products included the AHRQ QIs, but since limited
information is available from some vendors, some mistaken attribution is possible. There are also other vendors with similar quality measurement products that do not include the AHRQ QIs, but they were not included in our study.
As mentioned above, many of these tools include proprietary quality indicators developed by the vendors themselves. In addition, many of the vendors are licensed to implement the JCAHO Core Measures, and many also produce indicators from other developers, such as Leapfrog.
Some users of the AHRQ QIs whom we interviewed use vendors for their
measurement activities and expressed a high degree of satisfaction with the vendors’ services. On the other hand, some users expressed a concern that the AHRQ QIs as implemented by some vendors may differ in key respects from the official AHRQ QI specifications, and that the proprietary nature of the tools makes these differences non-transparent. One hospital association captured this sentiment:
The AHRQ QIs are standardized measures, risk-adjusted, and not in a “black box” so we can get the numerator and denominator and make them accessible to hospitals. The industry is sick and tired of vendors and consulting firms creating black boxes.
Another interviewee sounded similar themes:
The problem is that if there’s any “black box” methodology, [users] won’t touch it - it’s politically dead, even if there is an underlying valid scientific process. Hospitals want to check their own numbers. [The vendors’] offers sound nice. The problem is, a hospital can’t replicate the findings or understand differences in methodology/calculations. [Users] like transparency, a tool that is open, where everyone can see what is happening, hospitals can replicate the results, then everyone can talk about the differences. It democratizes quality reporting.
3.3 AHRQ’S POSITION IN THE MARKET FOR QUALITY INDICATORS
While the quality indicators developed by organizations other than AHRQ share certain characteristics with the AHRQ QI program, there are no other sources of indicators that are viewed as a national standard and are also publicly available, transparent, hospital-focused, outcome-hospital-focused, and based on administrative data. Many of our interviewees stressed that the AHRQ QIs fill an important void in this respect. A representative of an integrated delivery system described the process of searching for quality indicators that could be readily used for monitoring quality and guiding quality improvement activities:
When we started looking for indicators, we really struggled to find valid quality measures based on readily available data and with benchmark potential. Without manually auditing patient charts, and coming up with numerator and denominator definitions on our own, there was no way we could do it by ourselves. AHRQ offered the set of measures prescribed for our needs.
A representative of a state doing public reporting told us:
If we didn’t have the AHRQ QIs, it would be difficult as a state to come up with our own indicators and there are not many other choices that are based on administrative data. Until electronic medical records are commonplace (5-10 years at least), we need to deal with using administrative data.
An insurance company representative highlighted the importance of AHRQ’s role in the quality indicator market, stating that more marketing of the QIs is needed:
AHRQ is doing something that no one else is doing. We have to have a national standard, something used across the country for comparison. [Does AHRQ] realize they’re one of the only good options out there? They should really pick up the outreach so that others will pick up using the QIs.
3.3.1 Overview of users and uses of the AHRQ QIs
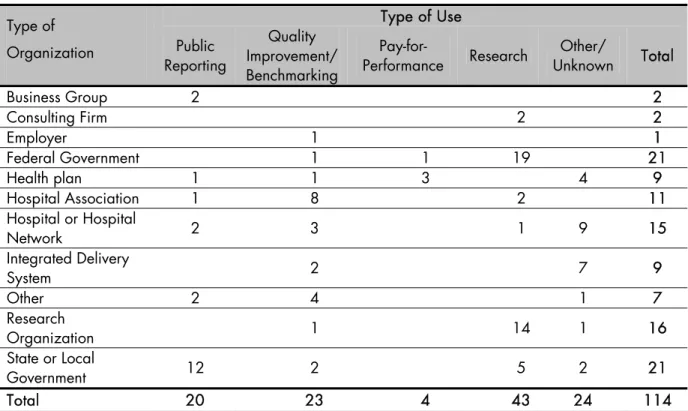
AHRQ’s unique position in the market for quality indicators has led to a wide proliferation of uses for the AHRQ QIs. Our environmental scan of users of the AHRQ QIs identified 114 users of the indicators and a range of different purposes, including public reporting, quality improvement/benchmarking, pay-for-performance, and research. Table 3.3 summarizes the number of users of the AHRQ QIs by type of organization and purpose of use.
Table 3.3. Users of the AHRQ QIs Type of Use Type of
Organization Public
Reporting
Quality Improvement/ Benchmarking
Pay-for-Performance Research
Other/
Unknown Total
Business Group 2 2
Consulting Firm 2 2
Employer 1 1
Federal Government 1 1 19 21
Health plan 1 1 3 4 9
Hospital Association 1 8 2 11
Hospital or Hospital
Network 2 3 1 9 15
Integrated Delivery
System 2 7 9
Other 2 4 1 7
Research
Organization 1 14 1 16
State or Local
Government 12 2 5 2 21
Total 20 23 4 43 24 114
Source: RAND analysis of environmental scan results
The most common uses of the AHRQ QIs include:
• Research. We identified 43 organizations that use AHRQ QIs for research. For example, Leslie Greenwald and colleagues used the AHRQ QIs to compare the quality of care provided in physician-owned specialty hospitals and competitor hospitals.26
• Quality improvement. We identified 23 organizations that use the AHRQ QIs as part of a quality improvement activity, including reports benchmarking performance against peers; however, these organizations do not release the quality information into the public domain.g
g Due to the methods used to identify users, the scan is likely to have significantly undercounted the
internal quality improvement activities, since this type of use rarely results in publicly available information that could be used to identify the user in an environmental scan.
• Pay-for-Performance. We identified 4 organizations that are using the AHRQ QIs in pay-for-performance programs. Three were health plans and one was a CMS demonstration project.
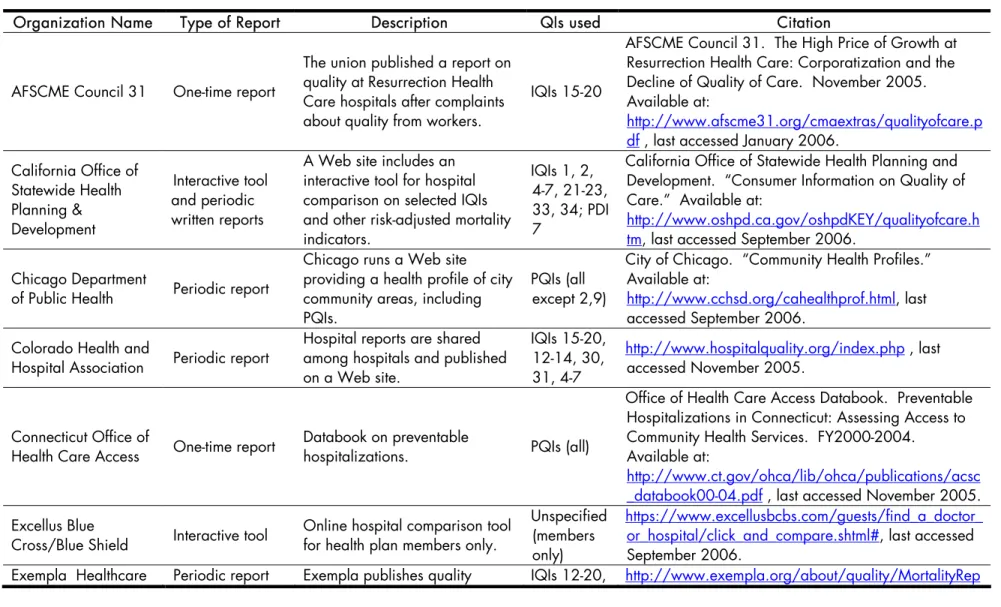
• Public reporting. We identified 20 organizations using the AHRQ QIs for public reporting. We classified an activity as “public reporting” if a publicly available report was published that compares AHRQ QI results between hospitals or geographic areas such as counties. The organizations using the AHRQ QIs for public reporting, with Web links to the reports, are listed in Table 3.4.